Day 1, part-to-whole

Day 2, neo

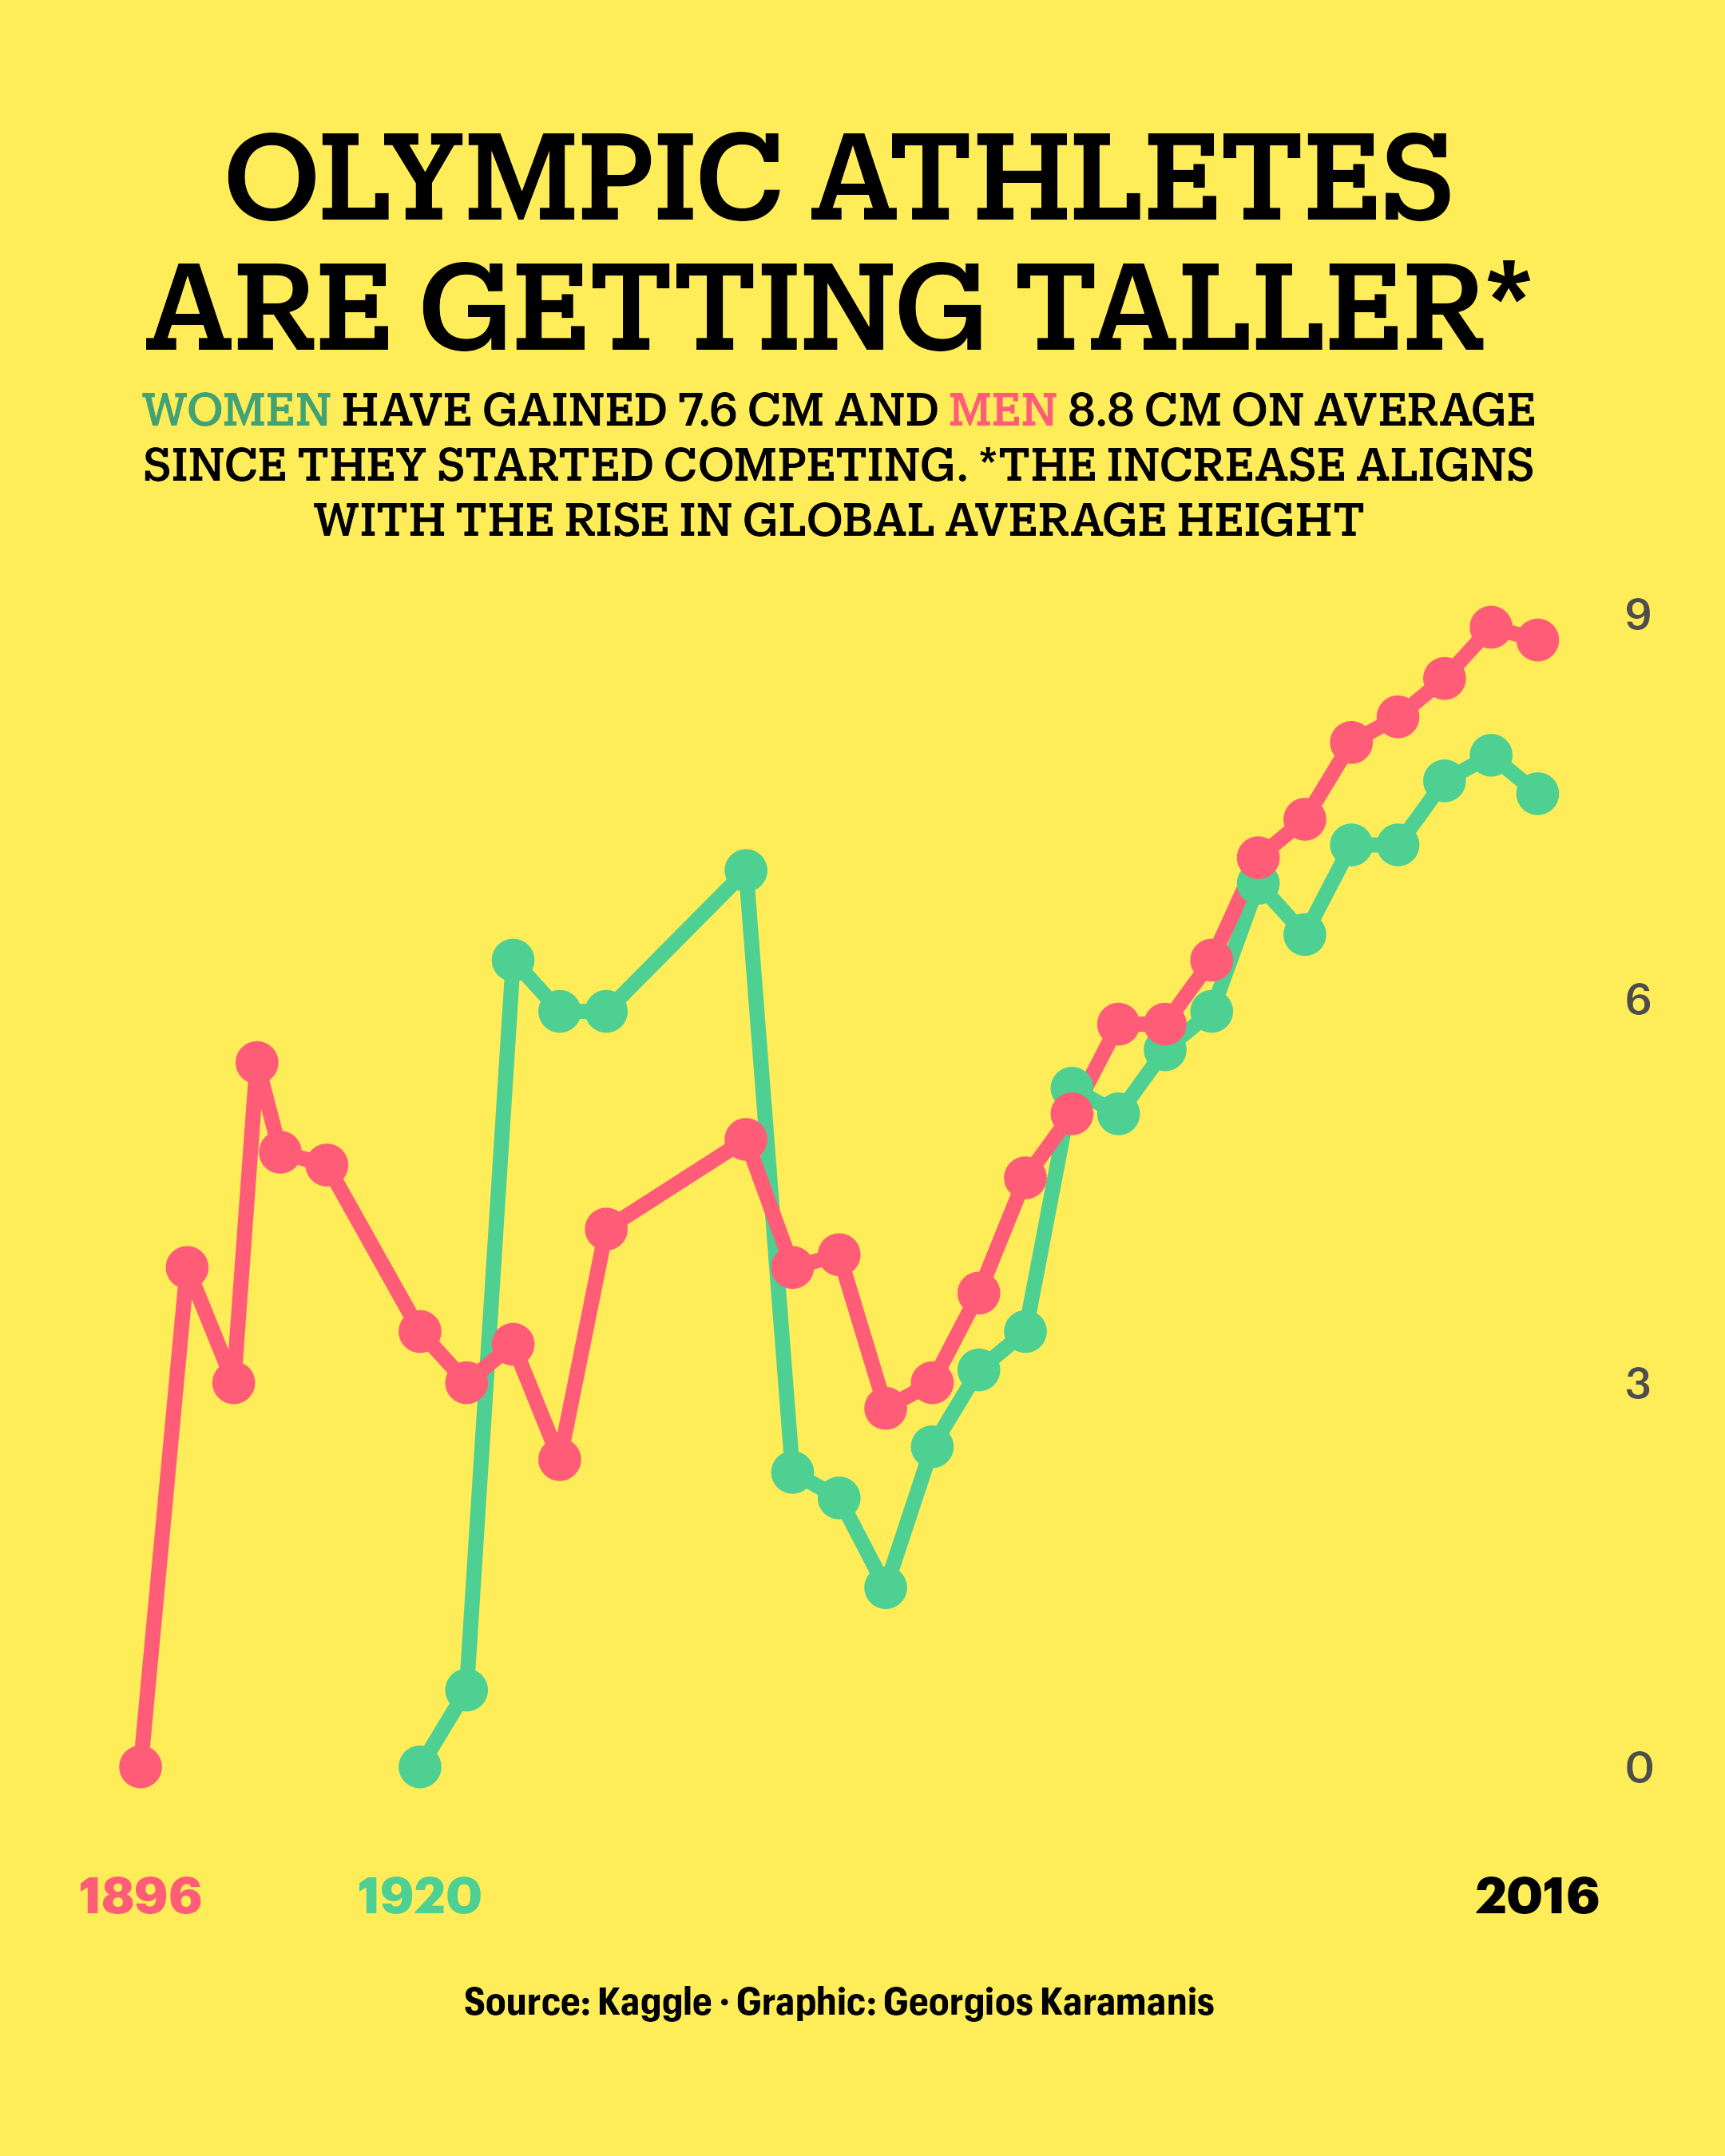
Day 3, makeover

Day 4. waffle

Day 5, diverging

Day 6, OECD

Day 7, hazards

Day 8, circular

Day 9, major/minor

Day 10, physical
Day 11, mobile friendly

Day 12, theme day: Reuters Graphics

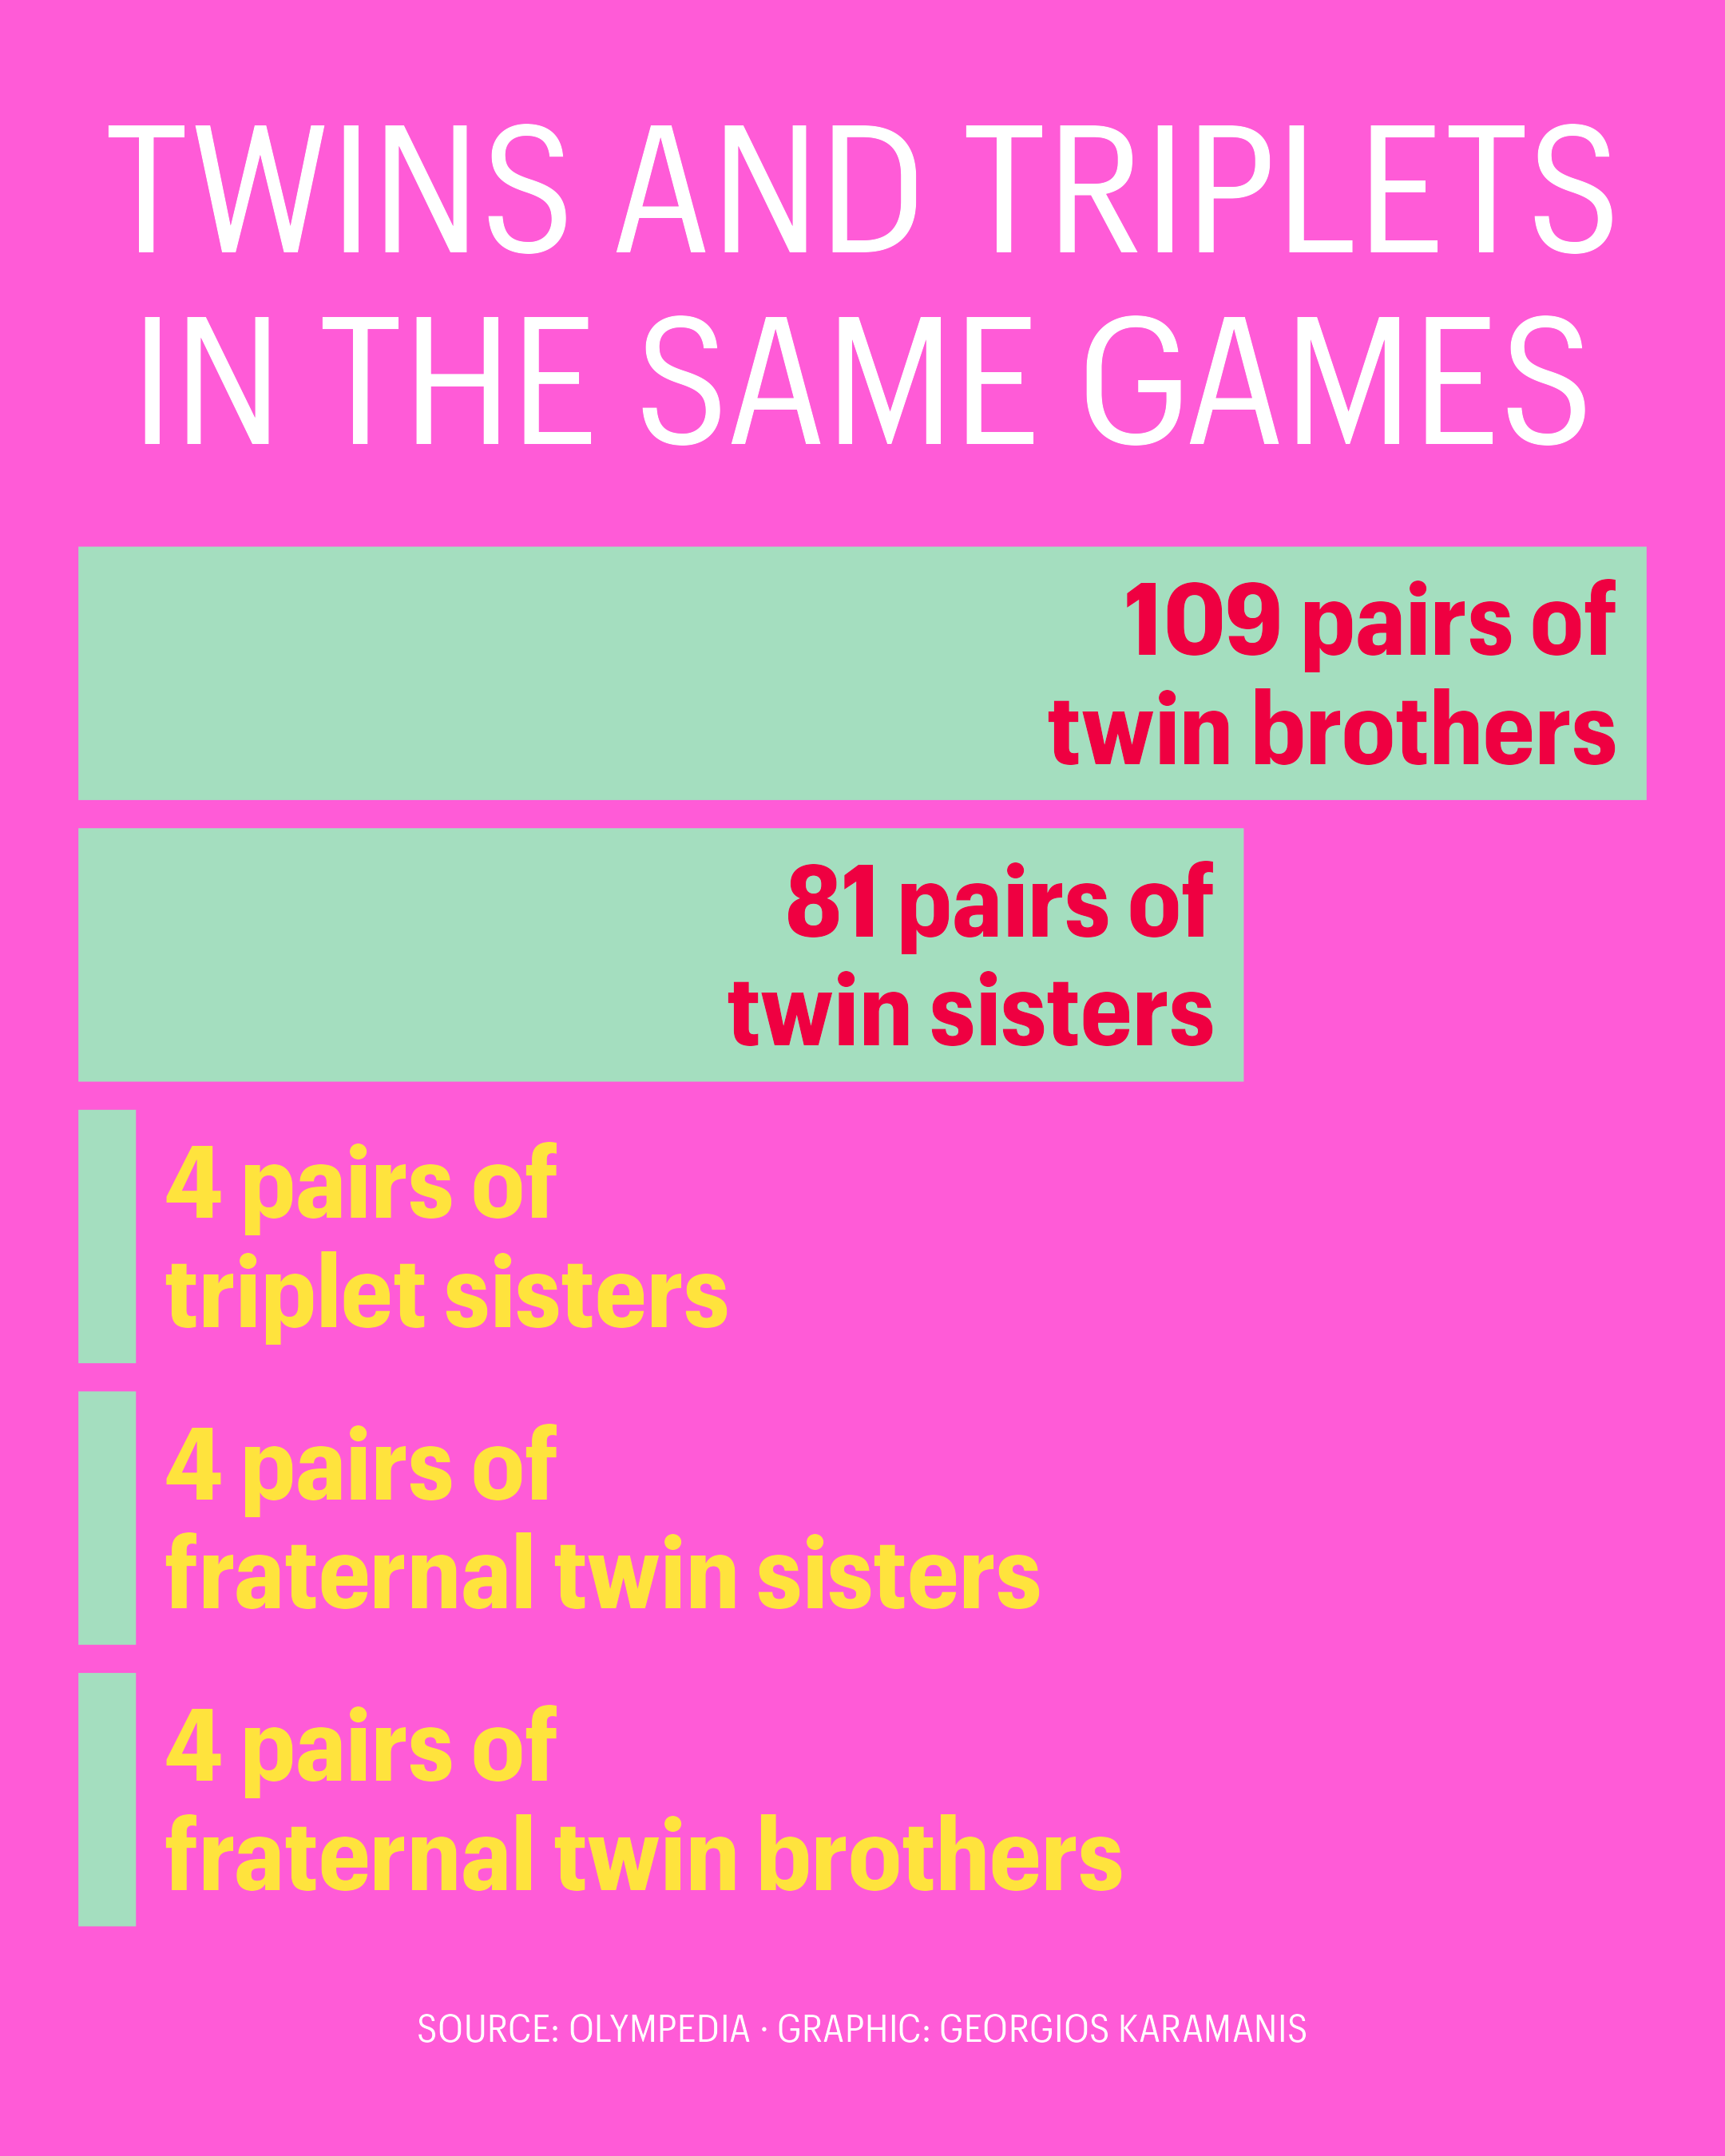
Day 13, family
Day 14, heatmap

Day 15, historical

Day 16, weather

Day 17, networks

Day 19, dinosaurs

Day 20, correlation

Day 22, mobility and day 23, tiles
