Immigration to Sweden for this week's #MapPromptMonday (Flow Map)
Code on GitHub
Sweden
Immigration to Sweden for this week's #MapPromptMonday (Flow Map)
Code on GitHub
When I saw Erin’s post a couple of days ago, I immediately wanted to do same for Sweden and started searching for data sources.
Screenshot from Erin’s blog
Luckily, Jordbruksverket, the Swedish Board of Agriculture, has an open data page and publishes detailed data about the number of livestock every 4 years. The latest dataset was from June 2020, so I got the population by municipality for 1 January 2021 from SCB (Statistics Sweden). The shapefile comes from Valmyndigheten, the Swedish Election Authority.
The original livestock categories were grouped to big four categories, chicken, cattle, pigs and sheep. I made one map for each category, apparently there is no municipality in Sweden that has more sheep than people (you can click on the images for bigger versions).
The plots were made in R and you can find the (a bit messy) code on GitHub.
Match results of Sweden women's national rugby sevens for this week's #TidyTuesday
code on GitHub
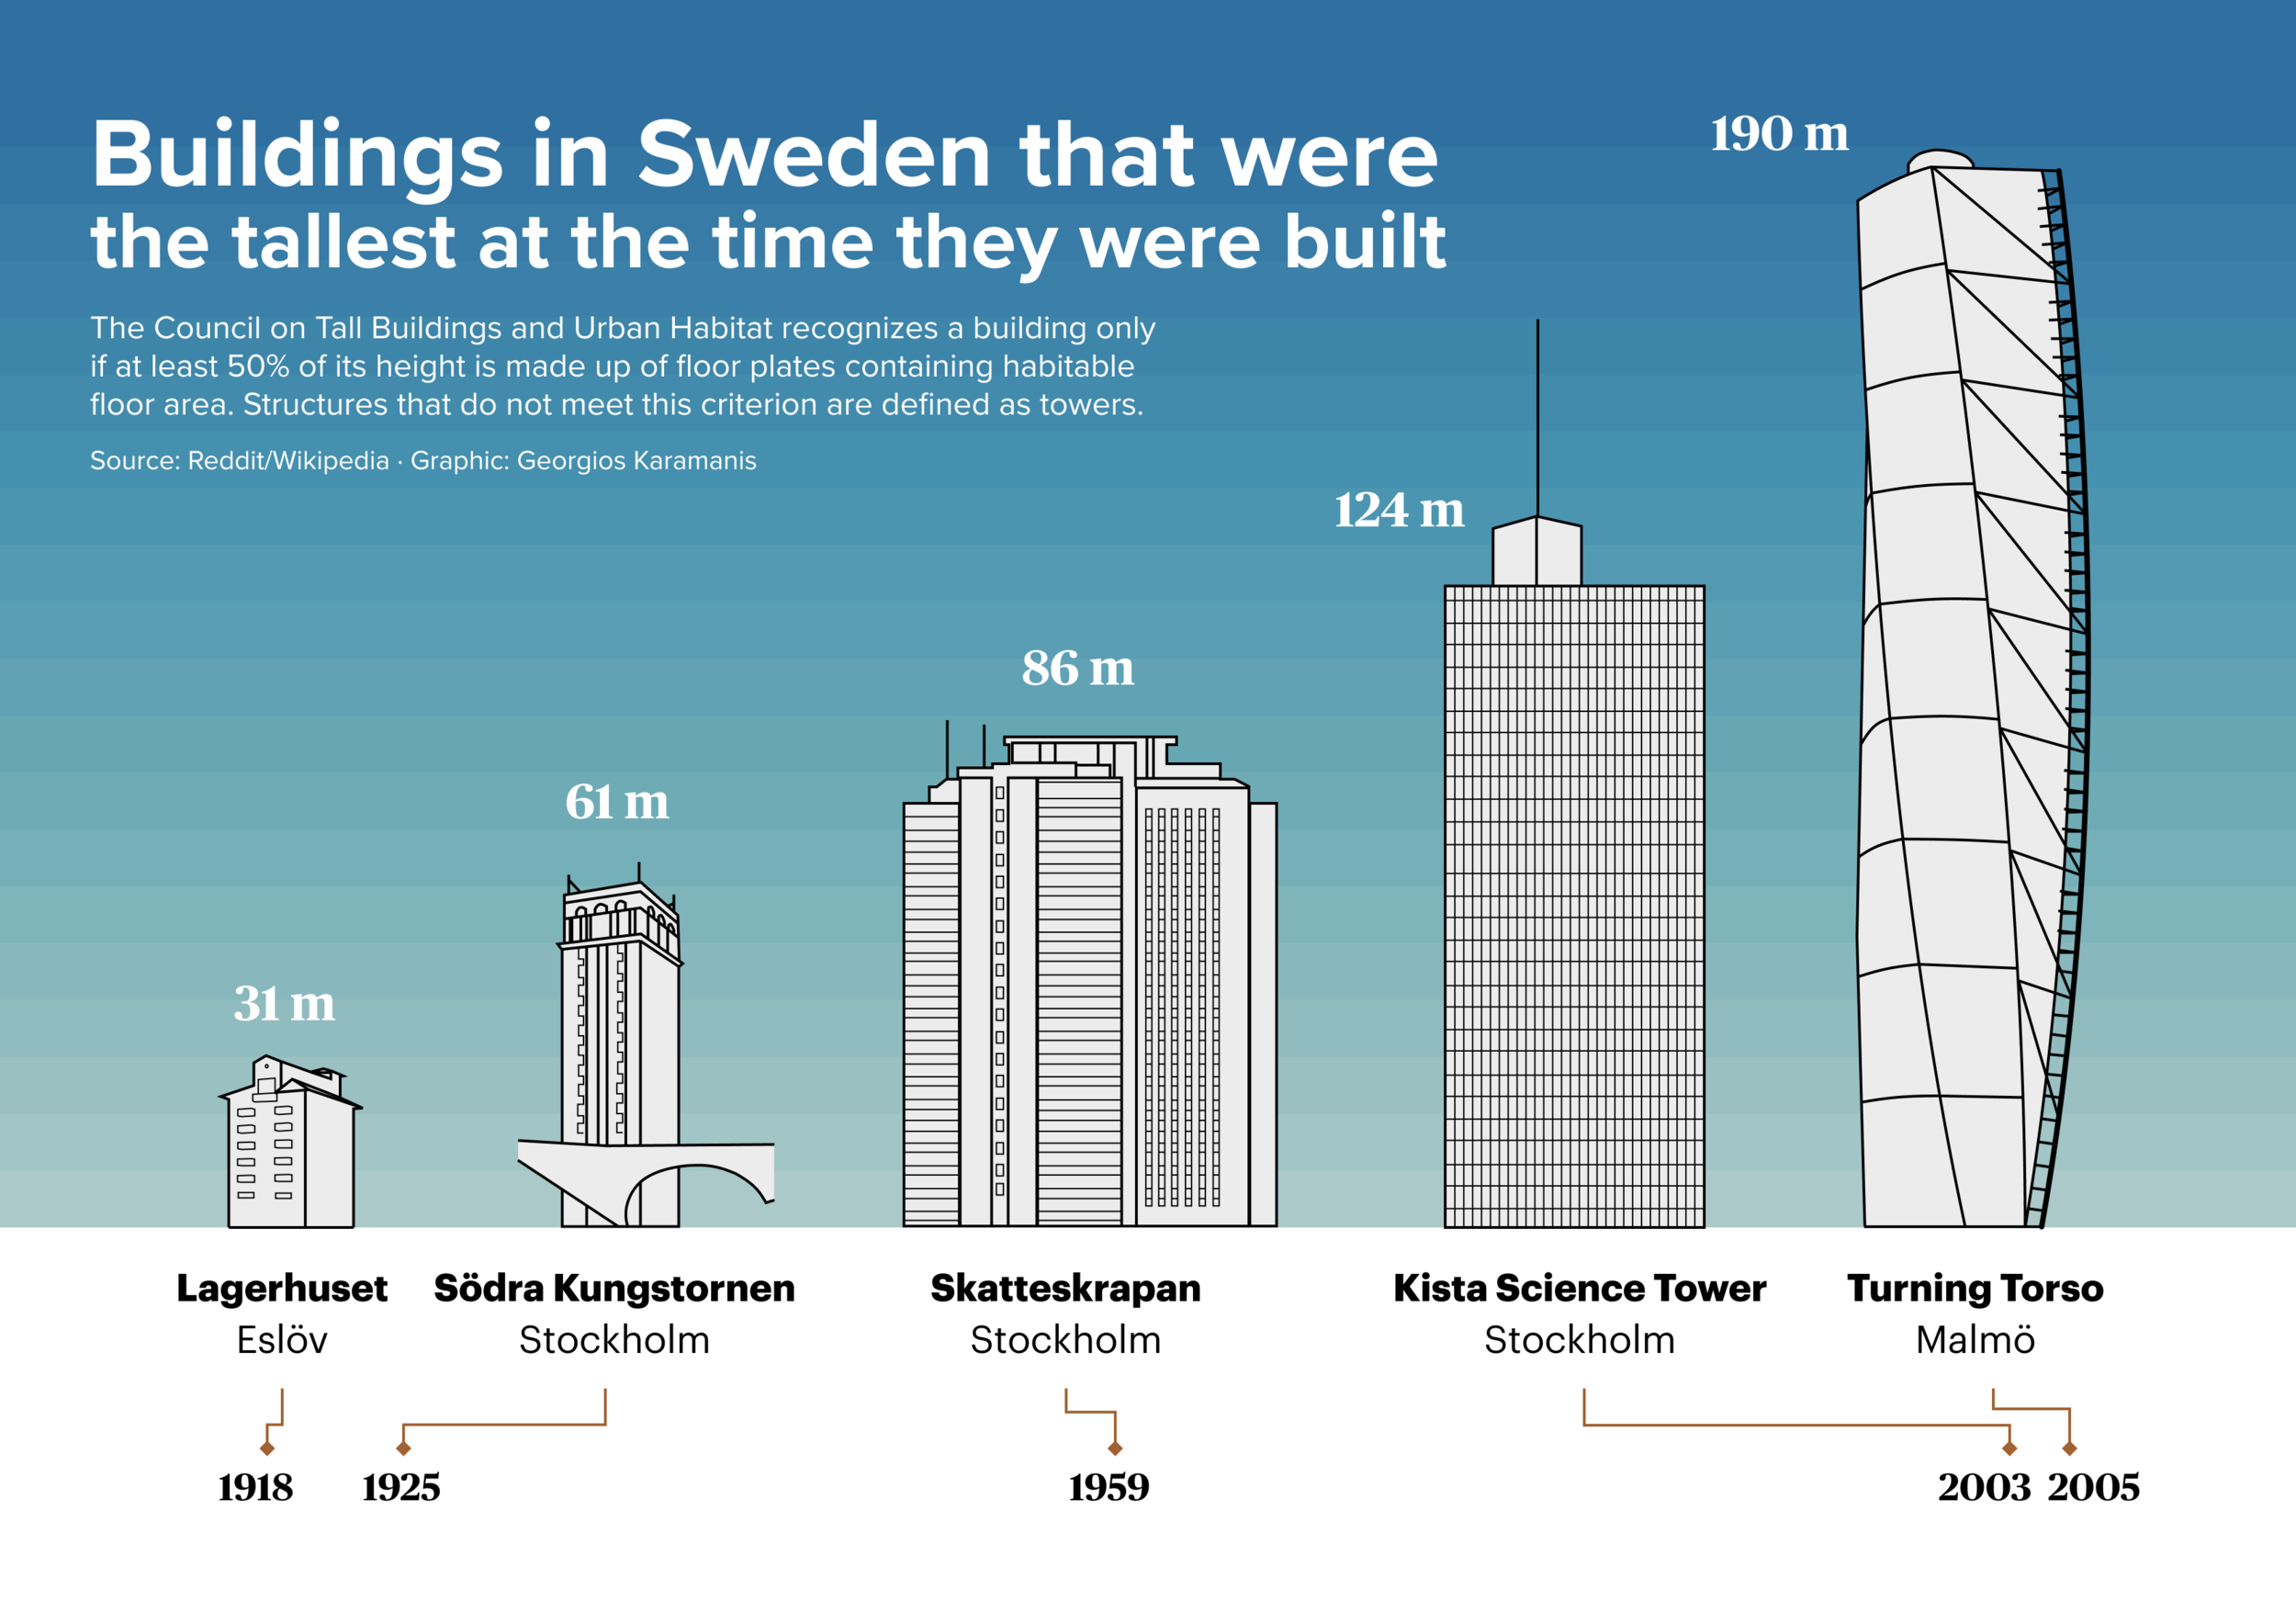
Wanted to try my hand at Figma, so I made this graphic about the tallest buildings in Sweden Idea from a post in r/Sweden
Transphobic hate crimes in Sweden for this week's Bring Your Own Data #TidyTuesday. The inspiration was a plot made by @thomasoide for an Axios article.
Source: Brå
Code on GitHub