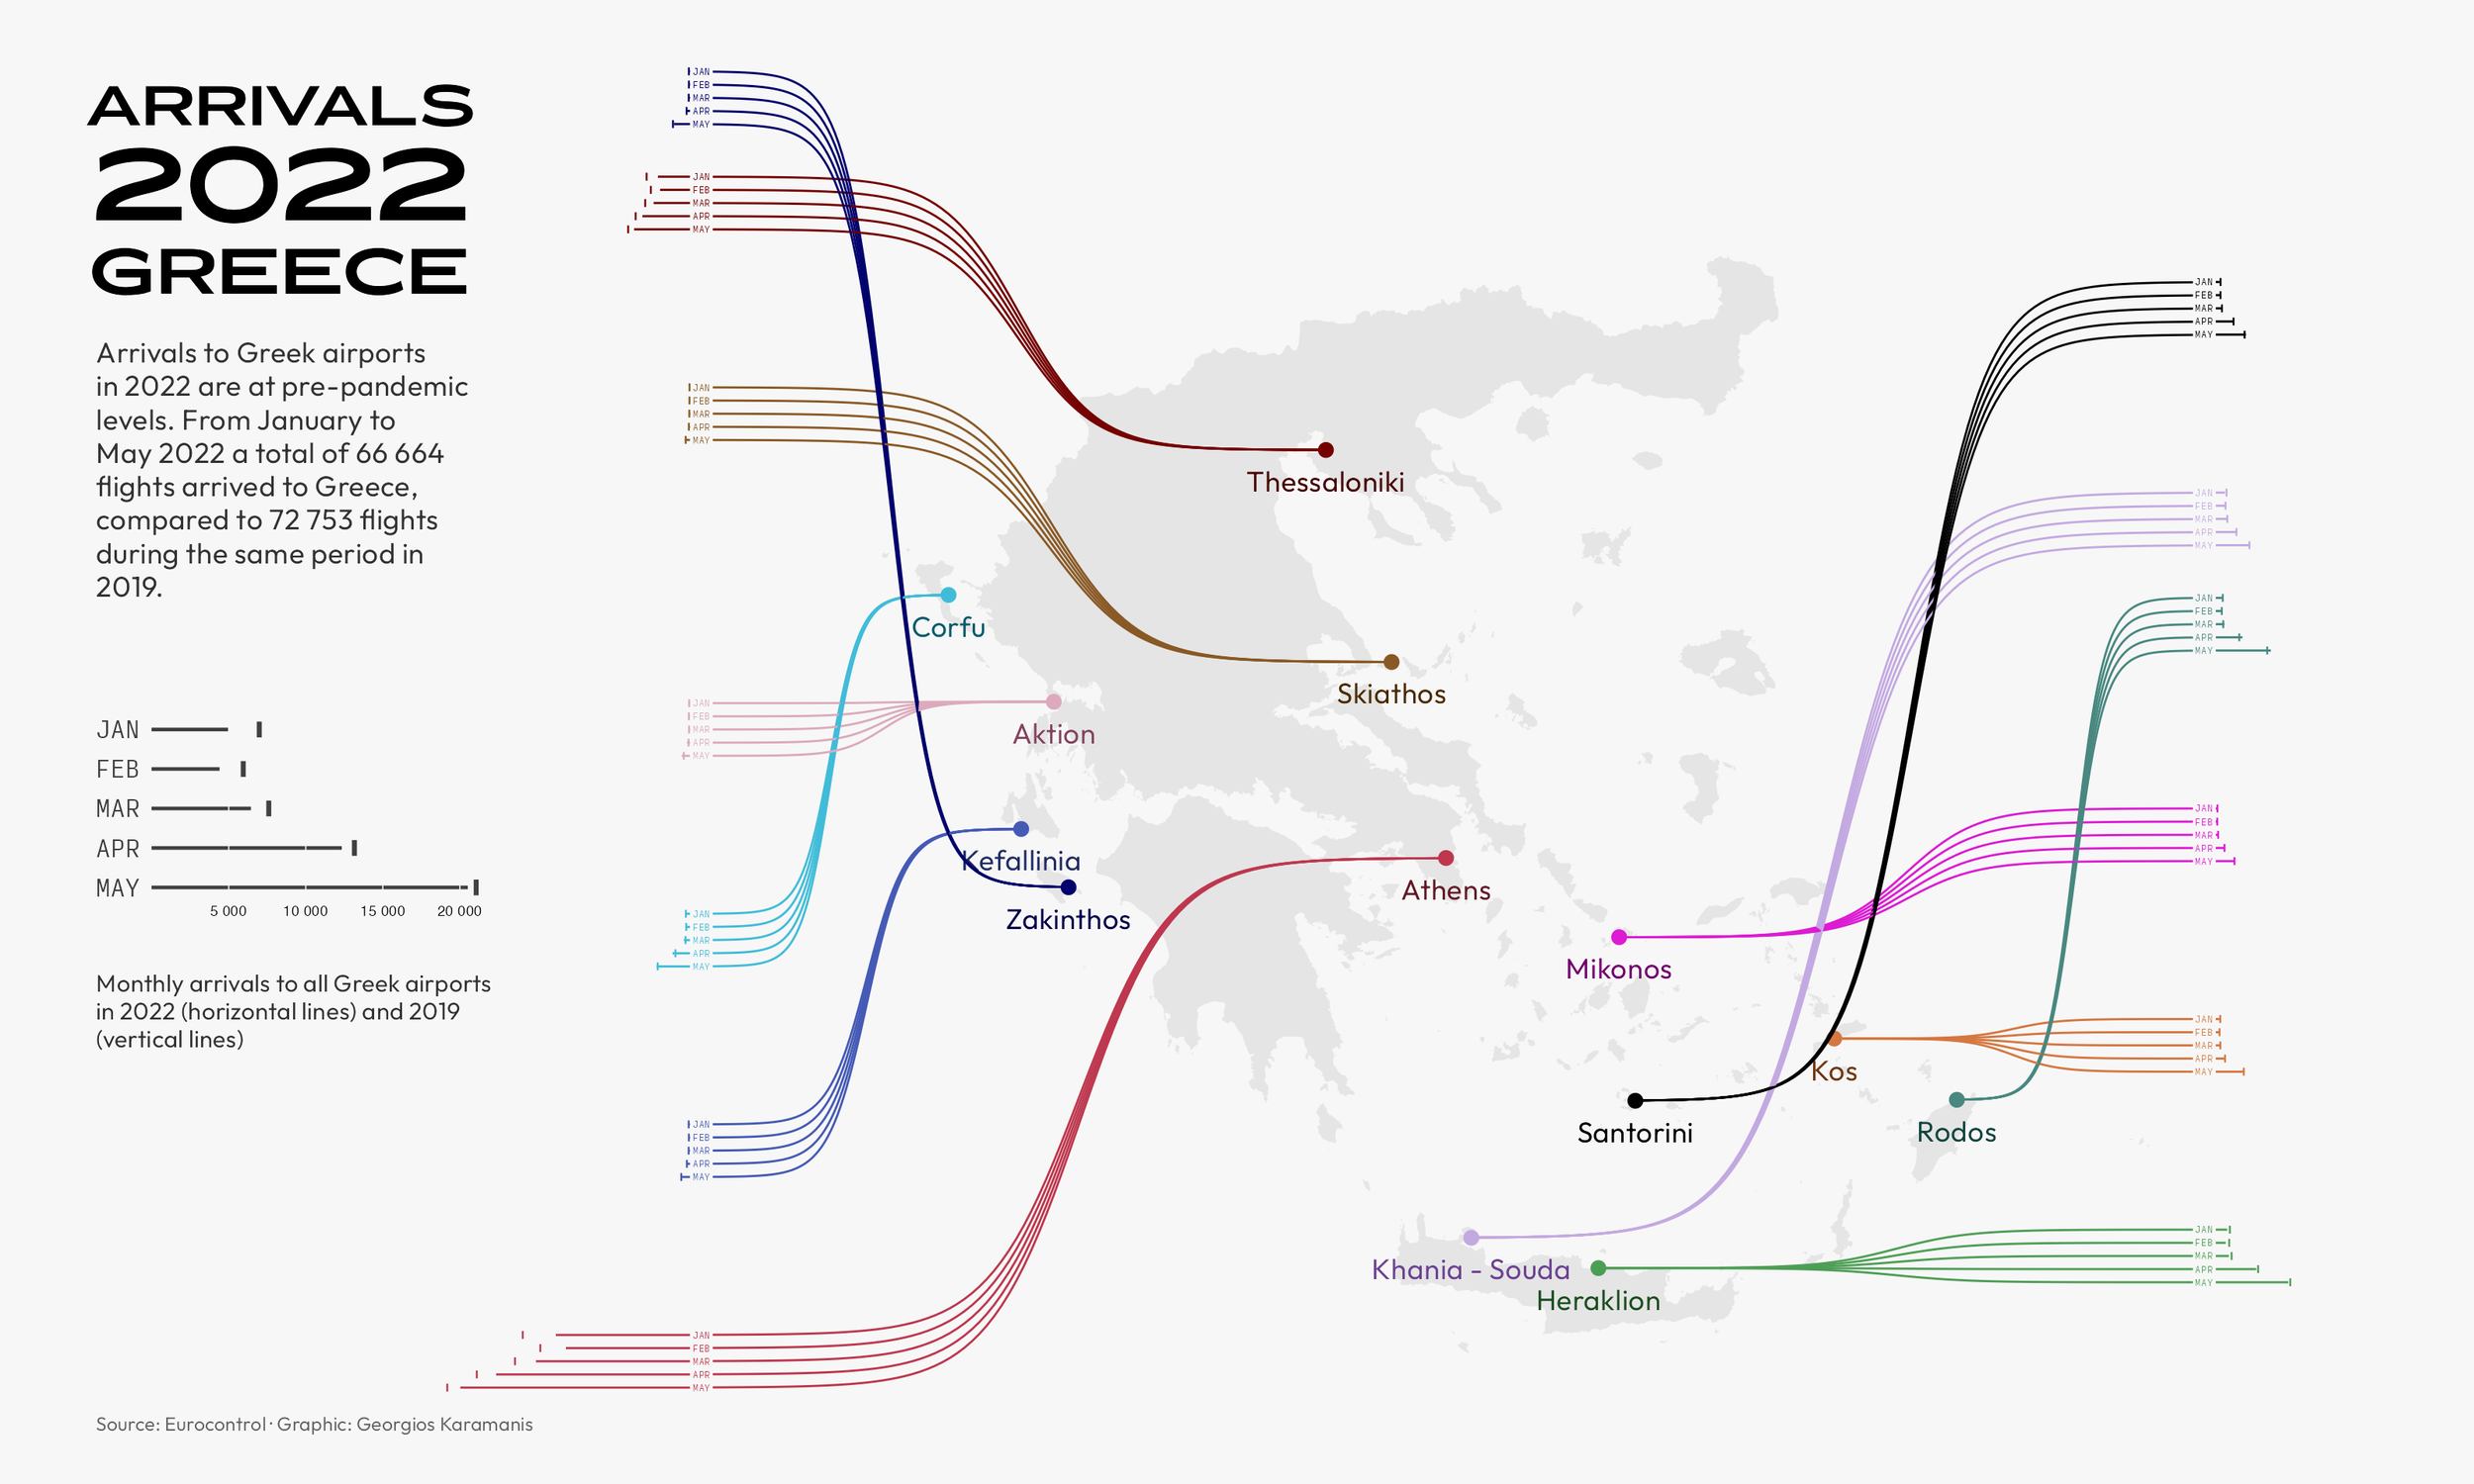
For this week's #TidyTuesday I plotted the arrivals to Greek airports in 2022 compared to 2019.
code on GitHub
Greece
For this week's #TidyTuesday I plotted the arrivals to Greek airports in 2022 compared to 2019.
code on GitHub
This post is going to be continuously updated with submissions to the 2021 #30DayMapChallenge. The code for all plots is on GitHub.
For day 1, I used an older dataset about heating degree days in Greece with about 160k points.
Ferry lines in Greece.
Another quick one, this is about the wildlife sanctuaries in Greece, trying a fill pattern with {ggpattern}.
Day 4, hexagons
A hex map of populated places in Greece that contain the words Saint, Santa or Holy (Άγιος, Αγία, Άγιο).
Speed limits in Thessaloniki, Greece
Average max temperature of warmest month in Greece, 1970-2000
NDVI for Greece with a touch of 3d. Both today's and yesterday's script were modifications of scripts in the great tutorials at https://rspatialdata.github.io
Mapping the depth of the sea around Greece with bathymetric data from NOAA.
A 3d render of Greece in Cinema 4D with data from CGIAR-CSI SRTM
Population density in Africa with raster data from the afrimapr R package.
Here is the same map with a scico palette and pseudologarithmic color scale:
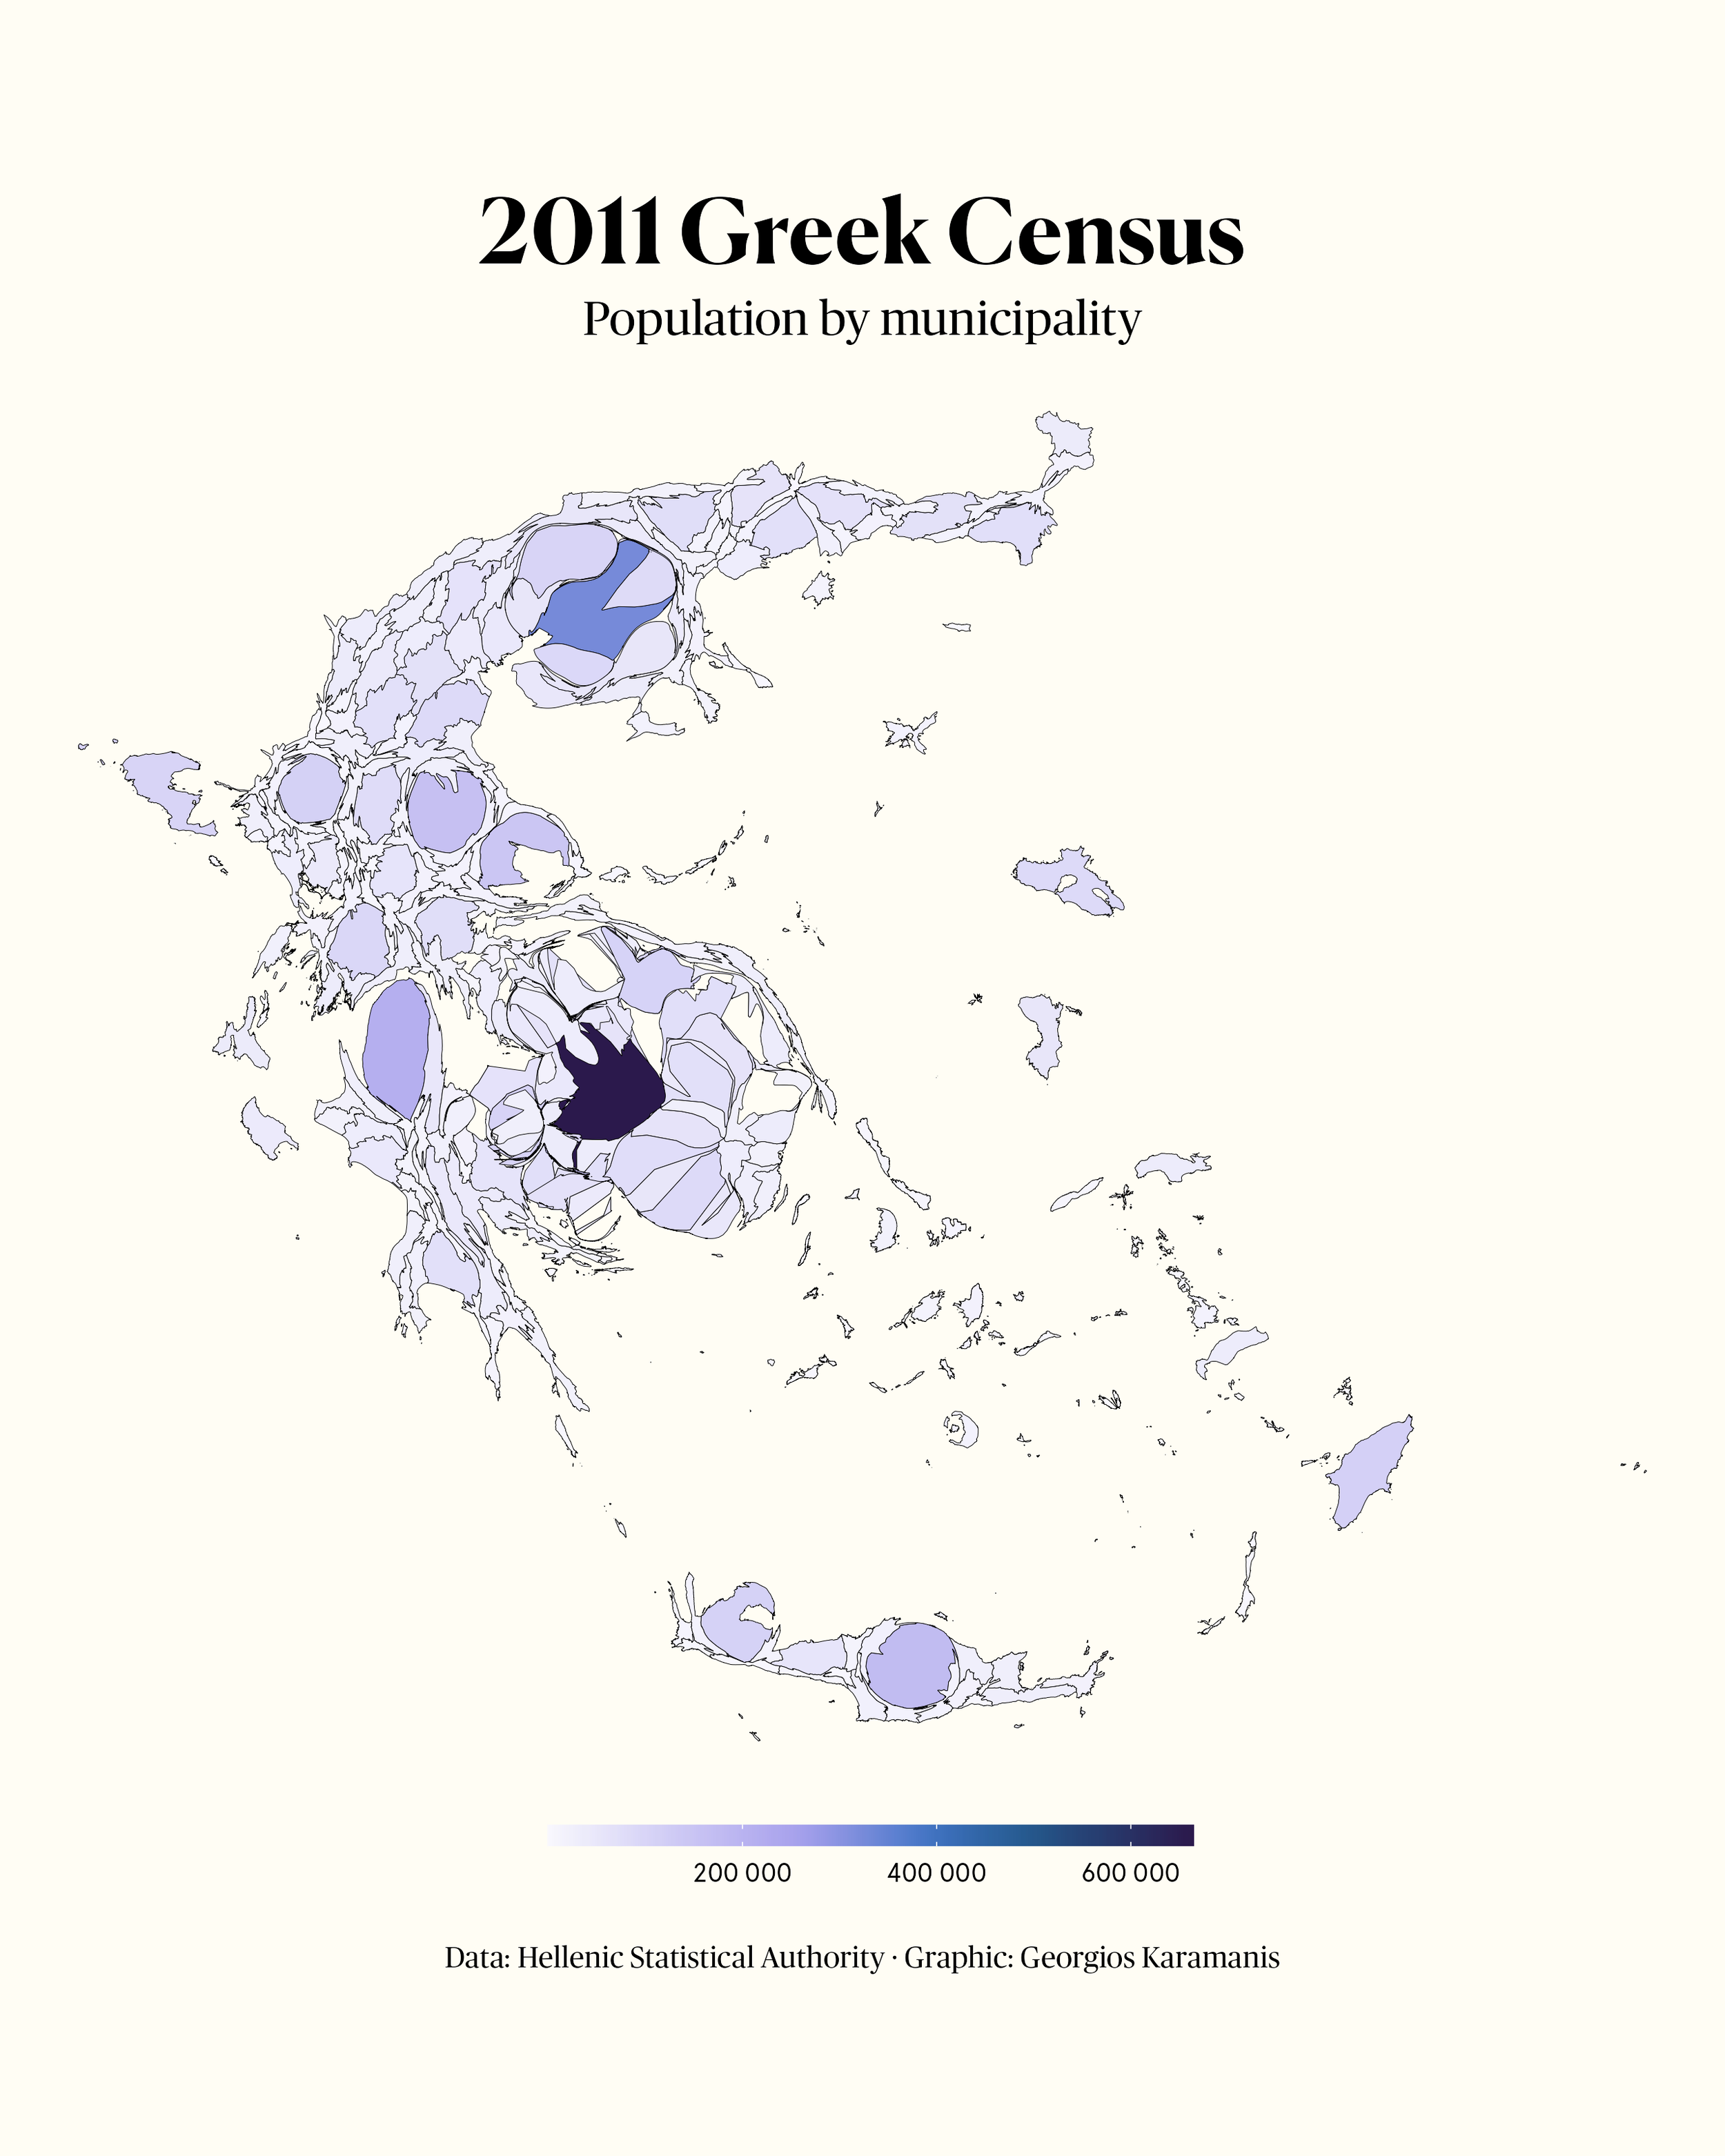
A cartogram about the 2011 Greek census, data from the Hellenic Statistical Authority
Day 13, Natural Earth
GeoJSON as ASCII in a very zoomed out terminal window
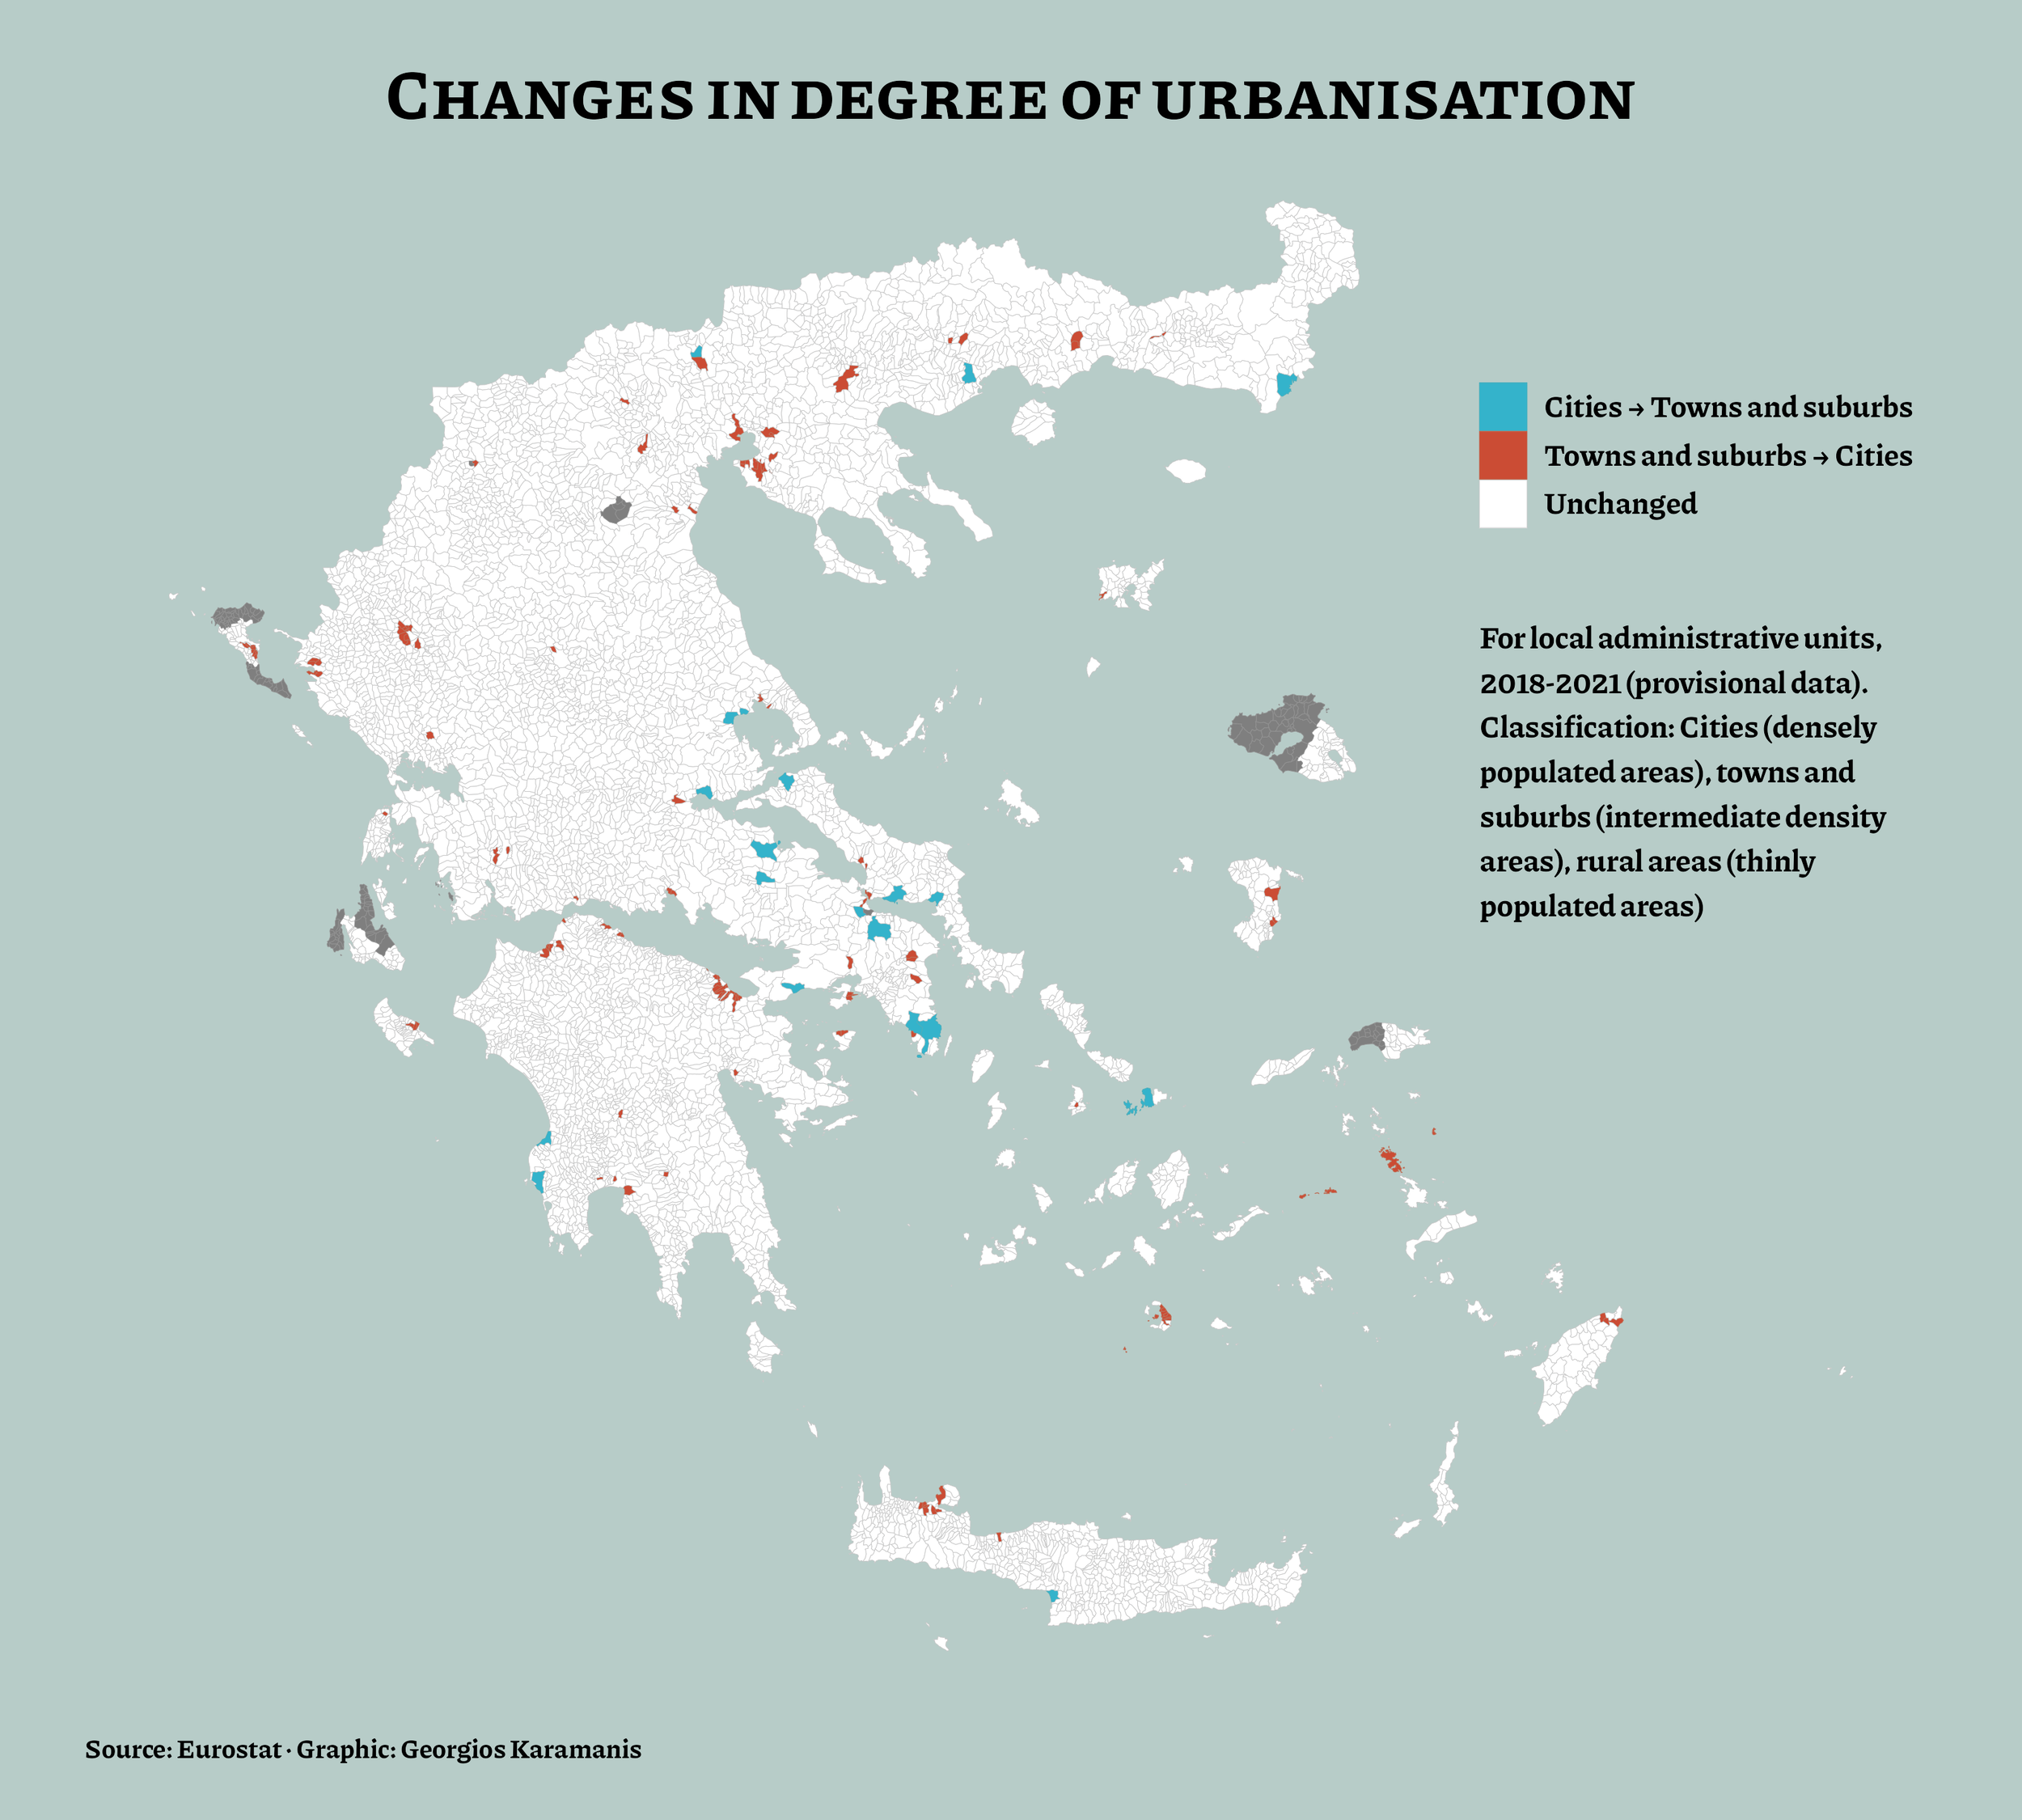
Code: geotype greece.geojson -z 13Changes in degree of urbanisation in Greece with data from Eurostat. Only small changes since the data is from 2018 and 2021.
Coastal land areas and costal water bodies of Greece. Data from Eurostat and http://geodata.gov.gr
Ferry routes between Greek islands. I took the ferry routes from day 2 and clipped the lines that intersected mainland Greece and the neighboring countries.
Passenger ship movement around Greece (I too wanted to use the ship movement dataset from The World Bank)
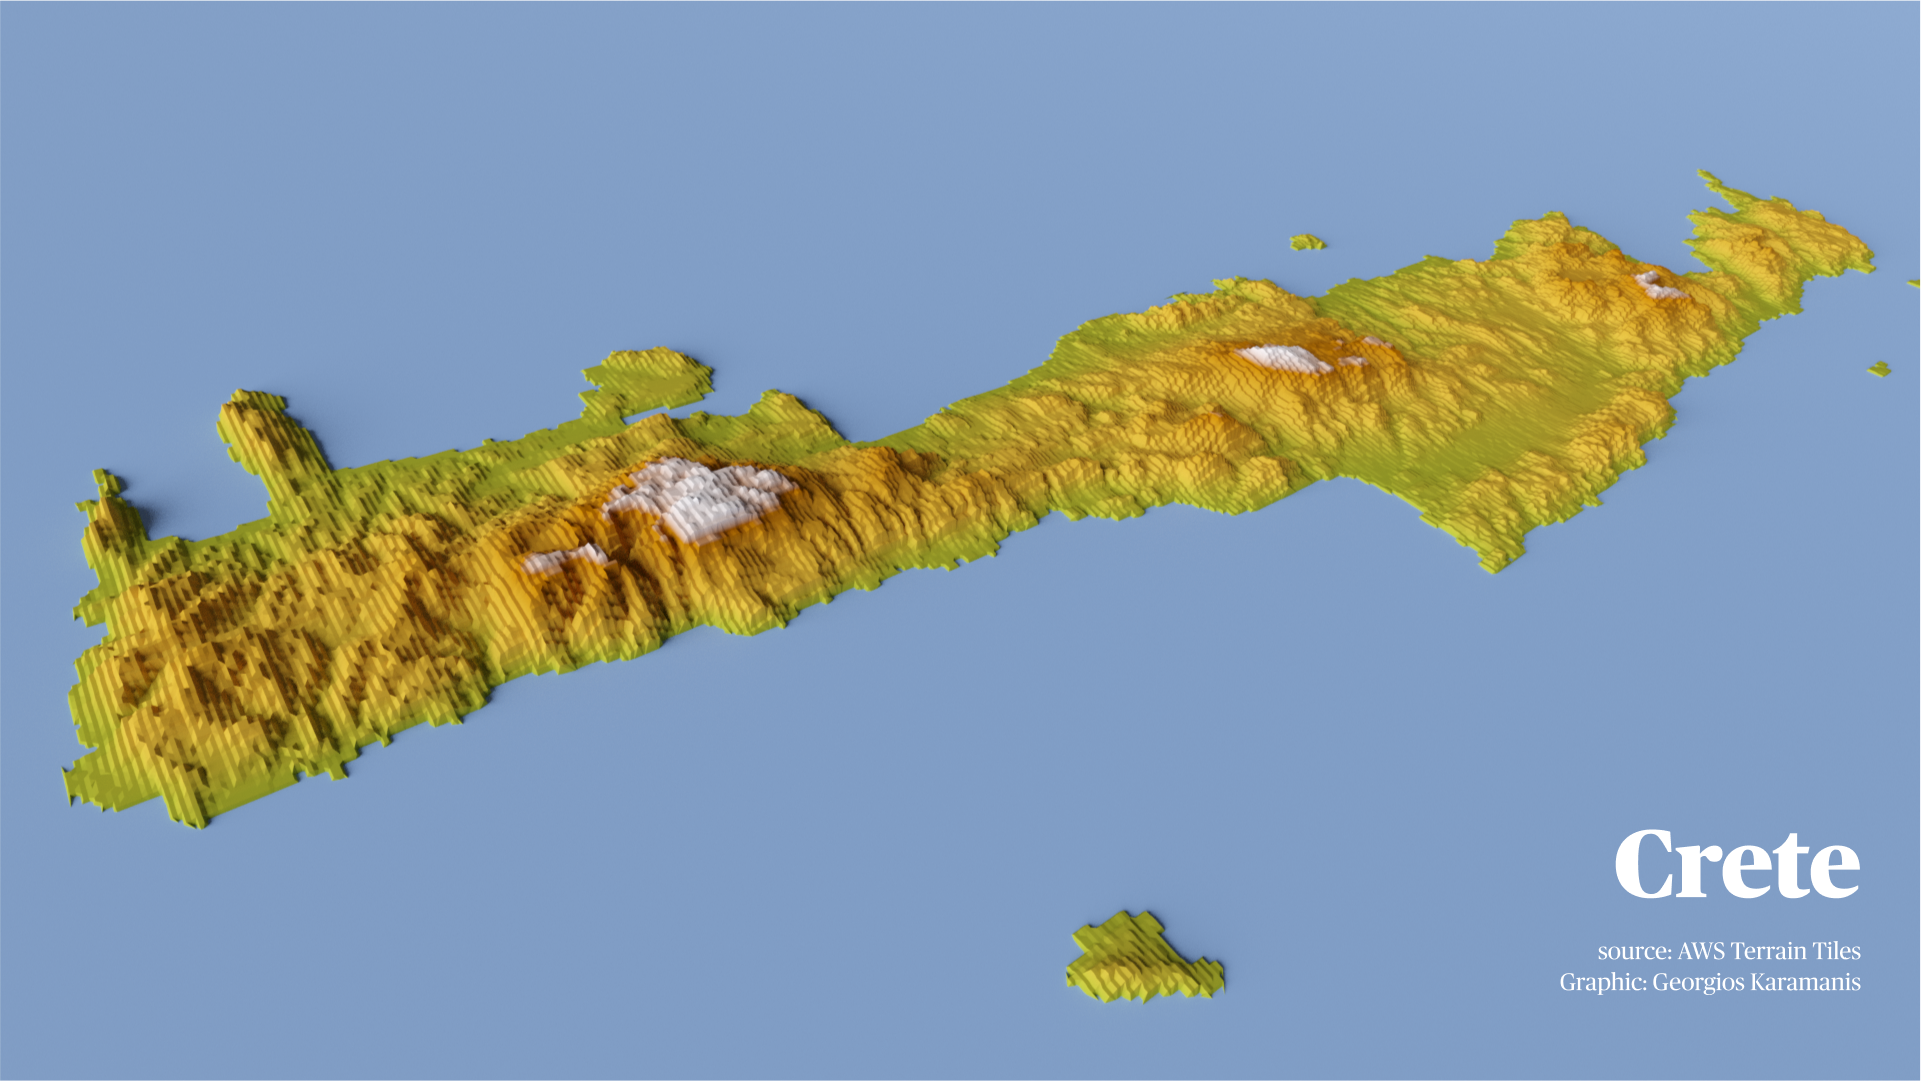
Started in #RStats following the tutorial at https://rspatialdata.github.io/elevation.html but then decided to try 3d. This might be my first Blender render, quite happy with the result.
Tectonic plates and significant earthquakes in Greece
Prices of unleaded 95 RON by prefecture in Greece, using mapdeck for the first time. Short video on Twitter
Density of restaurants in Greece with data from OpenStreetMap
Longitude of the centroids of the world's countries on a circle
Seafood production in Greece for this week's TidyTuesday. The inspiration for the plot was a data visualization from 1906 from this tweet.
code and full size image on GitHub
A timeline of the Greek athletes that have won a medal in the Summer Paralympics for last week's #TidyTuesday.
code on GitHub