Georgios Karamanis |||

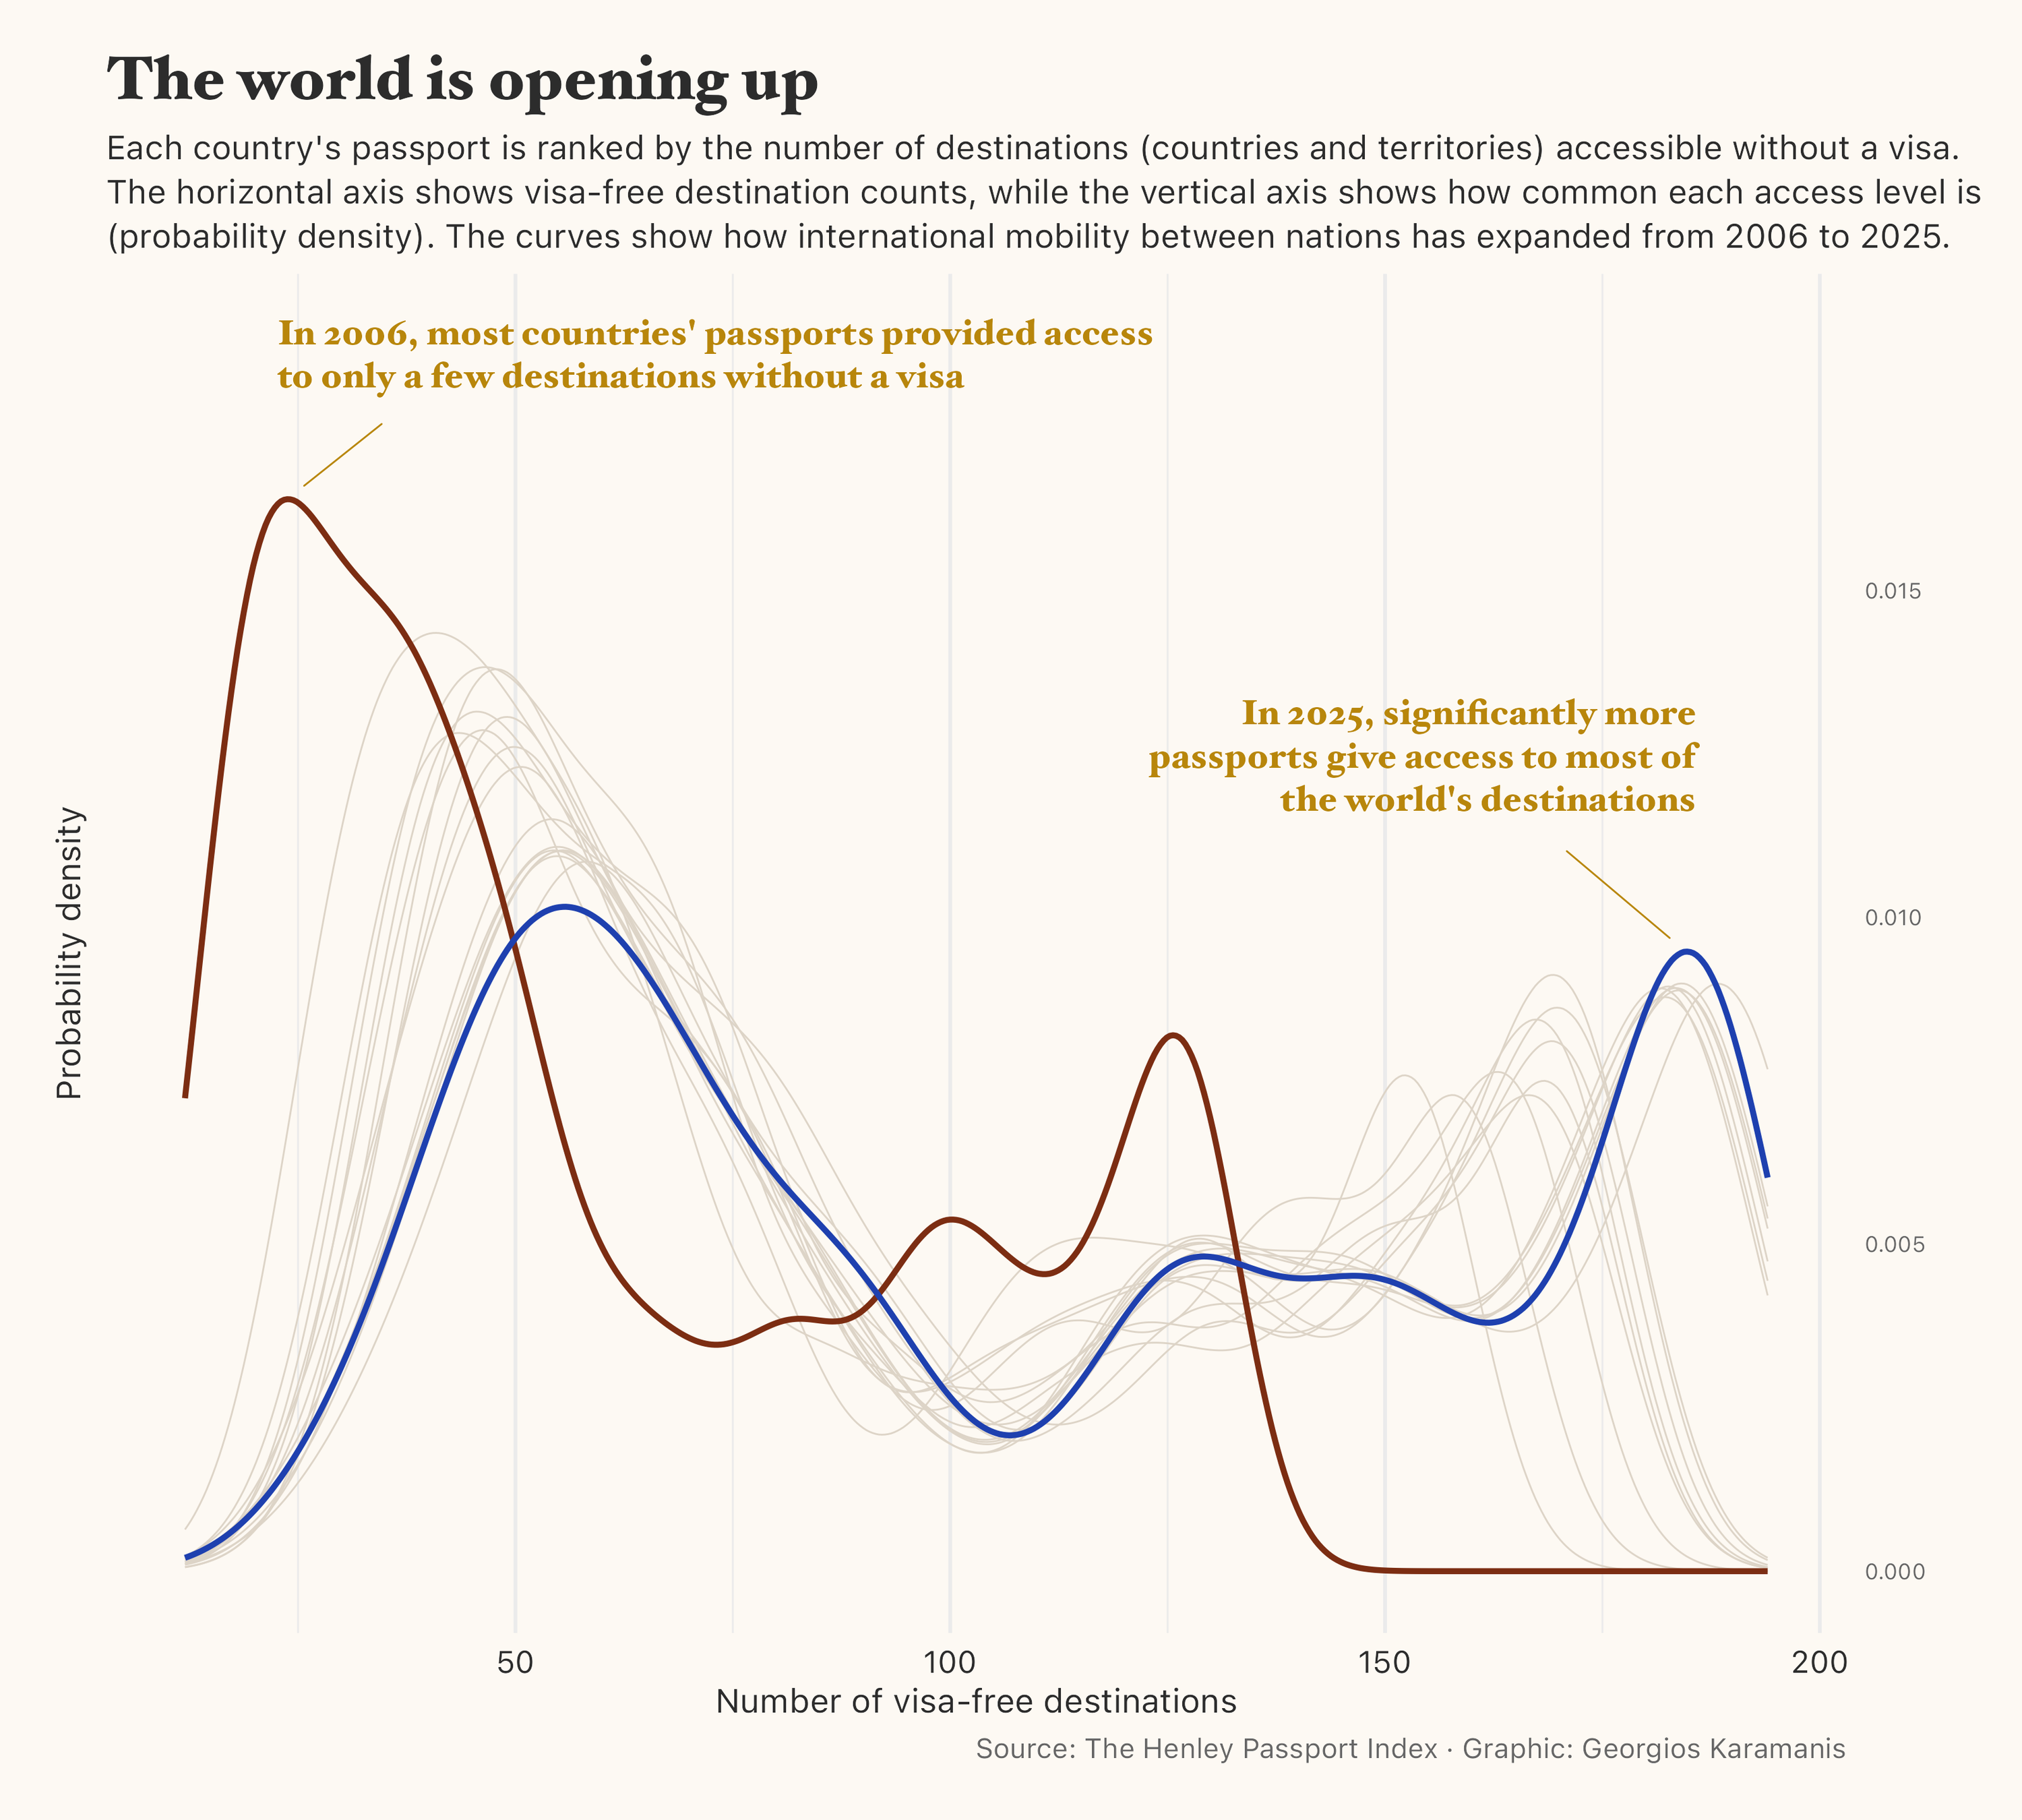
For this week’s #TidyTuesday, a visualization showing how more and more countries allow visa-free travel to most of the world’s destinations

Code on GitHub

A density plot showing the distribution of visa-free destinations accessible by country passports in 2006 versus 2025. The horizontal axis shows the number of visa-free destinations (0 to 200), while the vertical axis shows probability density. Two prominent curves are displayed: a burgundy curve for 2006 data peaks sharply around 25 destinations, indicating most countries’ passports provided access to relatively few places without visas. A blue curve for 2025 data shows a much flatter, broader distribution with a peak around 180 destinations, demonstrating that significantly more passports now provide access to most of the world’s destinations. Multiple faint gray curves in the background represent the years between 2006 and 2025, showing the gradual transition. Two text annotations explain that in 2006 most countries’ passports provided access to only a few destinations, while in 2025 significantly more passports give access to most of the world’s destinations.

Up next TidyTuesday 2025/36
Latest posts TidyTuesday 2025/37 TidyTuesday 2025/36 TidyTuesday 2025/35 TidyTuesday 2025/34 TidyTuesday 2025/33 TidyTuesday 2025/32 TidyTuesday 2025/31 TidyTuesday 2025/30 TidyTuesday 2025/29 TidyTuesday 2025/28 TidyTuesday 2025/27 TidyTuesday 2025/26 TidyTuesday 2025/25 TidyTuesday 2025/24 TidyTuesday 2025/23 TidyTuesday 2025/22 TidyTuesday 2025/21 TidyTuesday 2025/20 TidyTuesday 2025/19 TidyTuesday 2025/18 TidyTuesday 2025/17 30DayChartChallenge 2025 TidyTuesday 2025/16 TidyTuesday 2025/15 TidyTuesday 2025/14 TidyTuesday 2025/13 TidyTuesday 2025/12 TidyTuesday 2025/11 TidyTuesday 2025/10 TidyTuesday 2025/09 TidyTuesday 2025/08