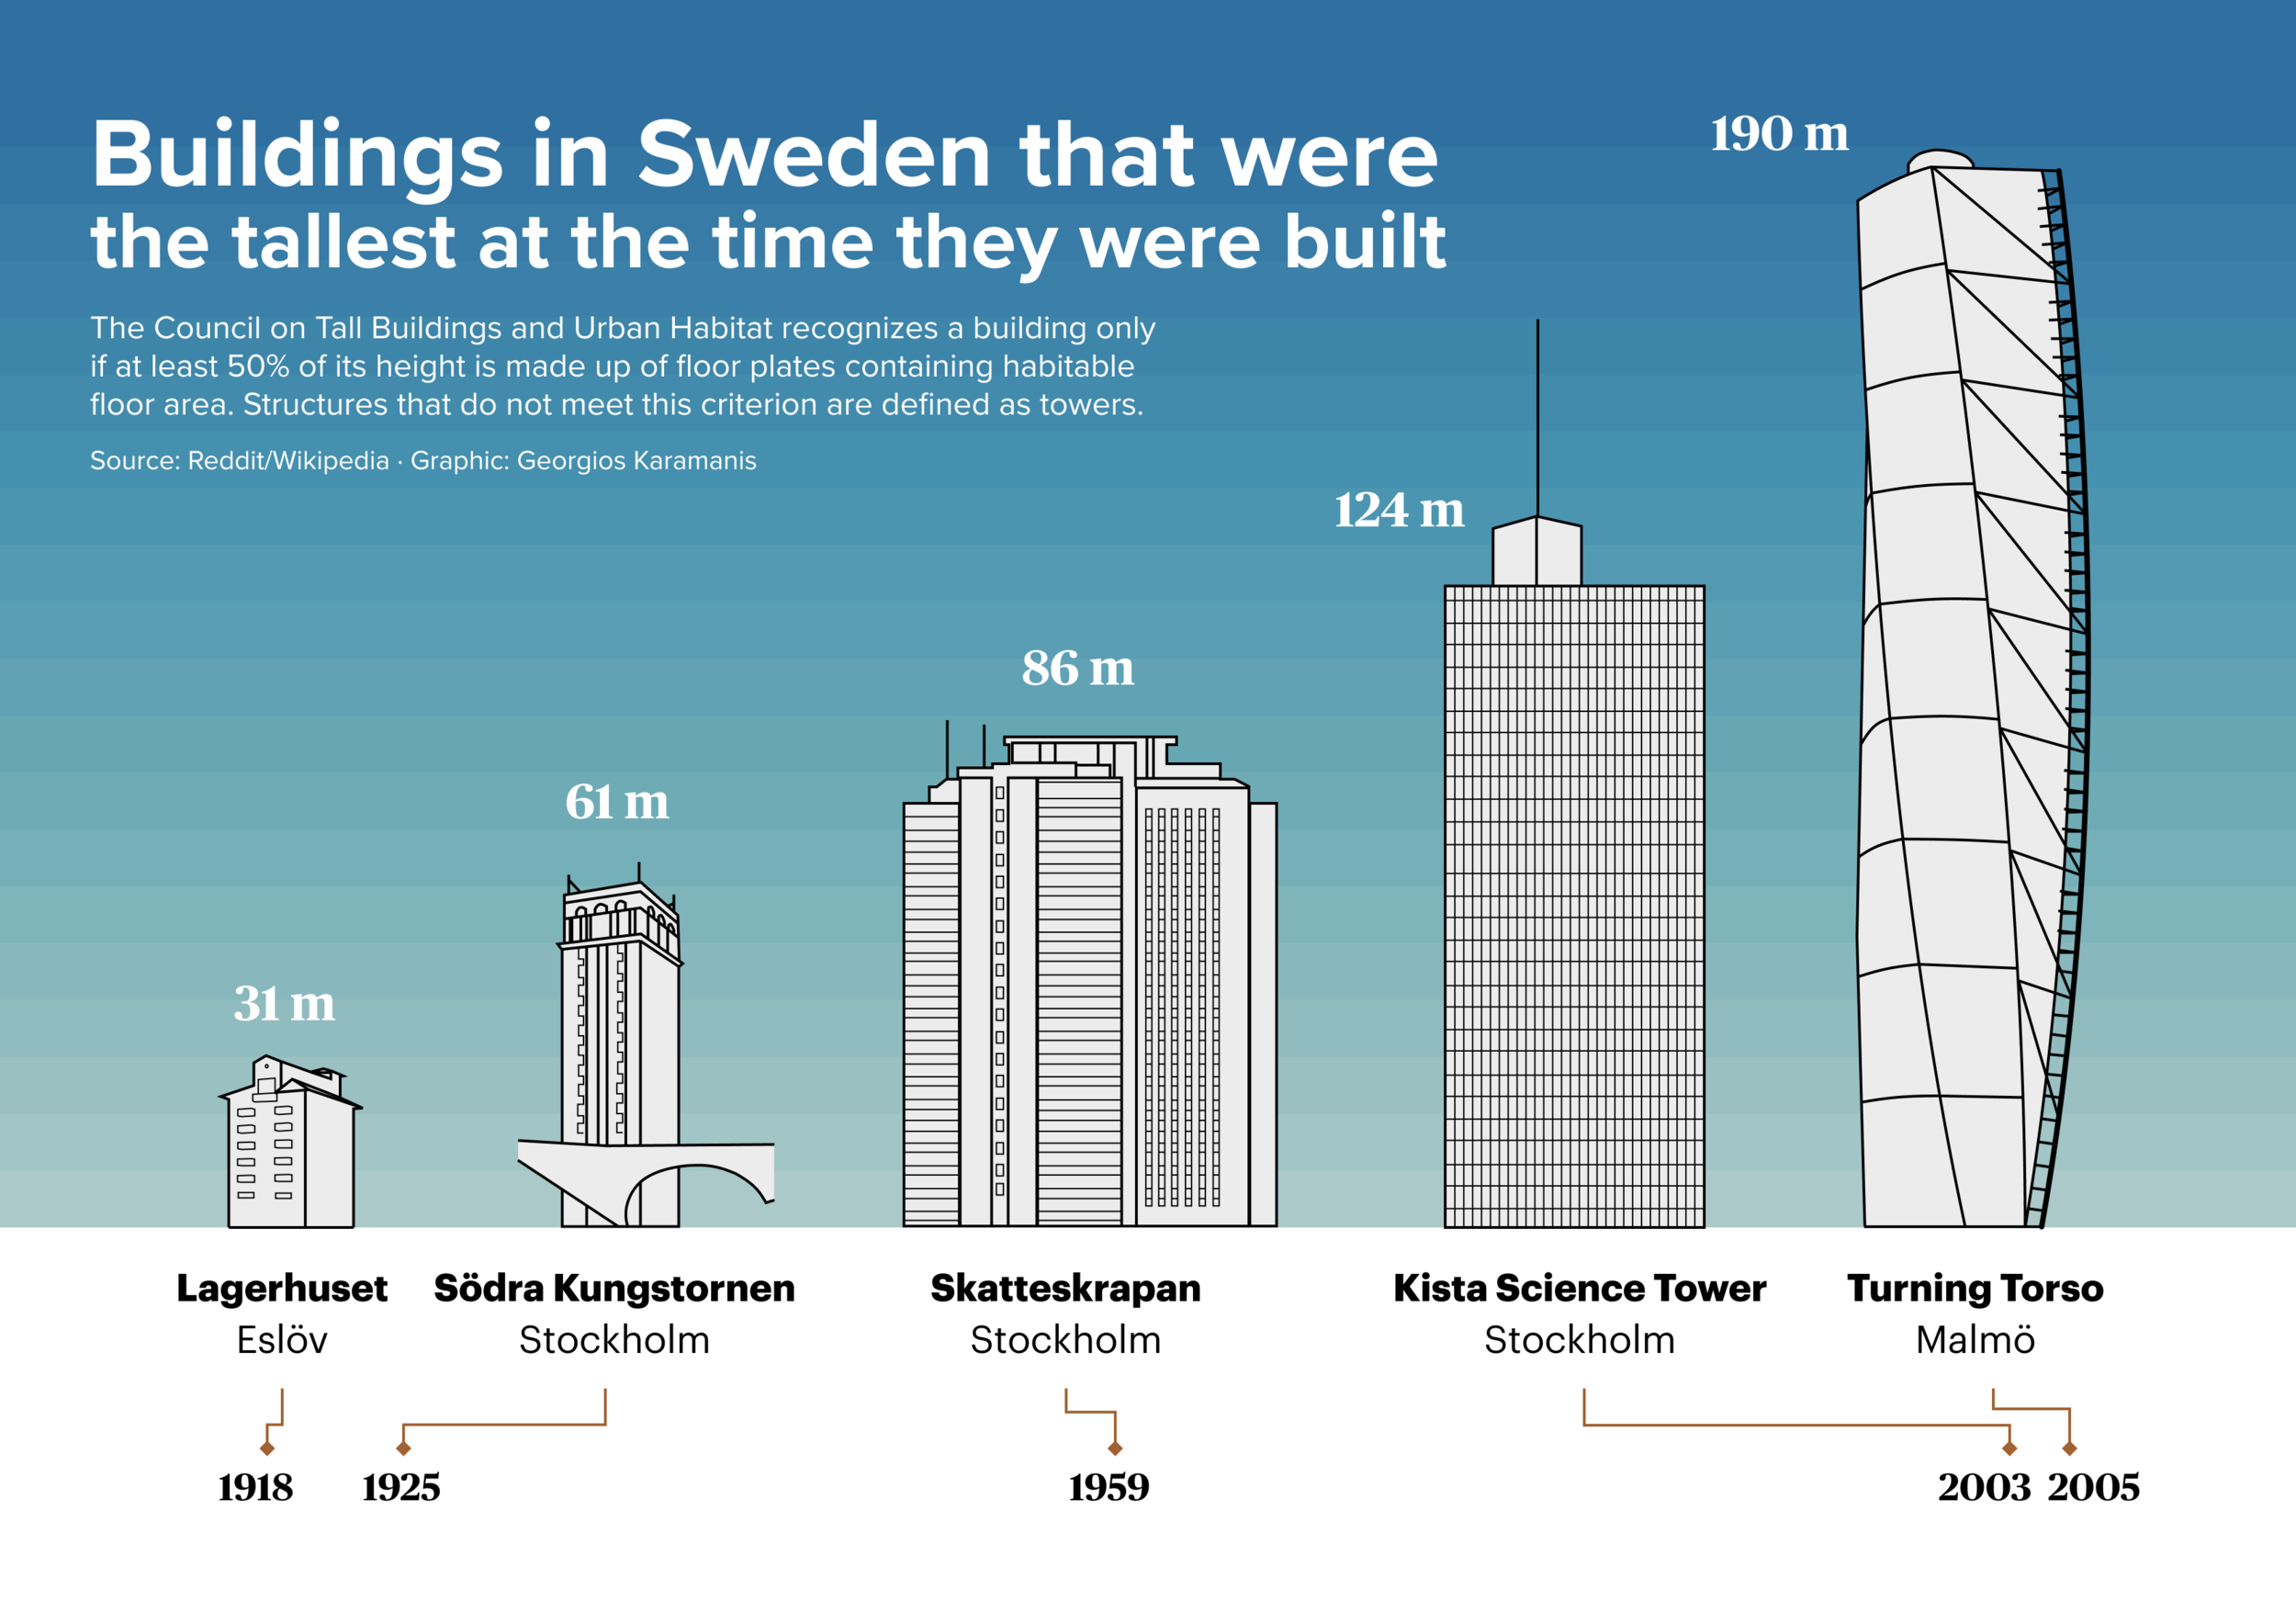
Wanted to try my hand at Figma, so I made this graphic about the tallest buildings in Sweden Idea from a post in r/Sweden


dataviz
Wanted to try my hand at Figma, so I made this graphic about the tallest buildings in Sweden Idea from a post in r/Sweden
For this week's #TidyTuesday I used the ComplexUpset package to plot the most common combinations of park amenities from 2018 to 2020, according to The Trust for Public Land's ParkScore index.
code: https://github.com/gkaramanis/tidytuesday/tree/master/2021/2021-week25
Cédric and I had a little chat when he was making his #DuBoisChallenge map (tweet) and wanted a hand-painted effect for the fill color. My recommendation was to try with the blend_with() function of the ggfx package and use a texture image as a “background” of the fill.
Read MoreThis post is not really a tutorial but more of a visual breakdown of the Commercial Fishing plot I did for last week’s TidyTuesday. The image below is the final plot (tweet) after fixing the numbers that were wrong in the original (tweet).
Read MoreFor this #TidyTuesday I was once again inspired by Gabrielle Merite’s (website, Twitter) work, as seen on the Data Viz Today Podcast. I looked at the ratio of total likes/retweets to tweets with and without the TidyTuesday hashtag during the #DuBoisChallenge
code: https://github.com/gkaramanis/tidytuesday/tree/master/2021/2021-week24

