Commercial Fishing plot breakdown
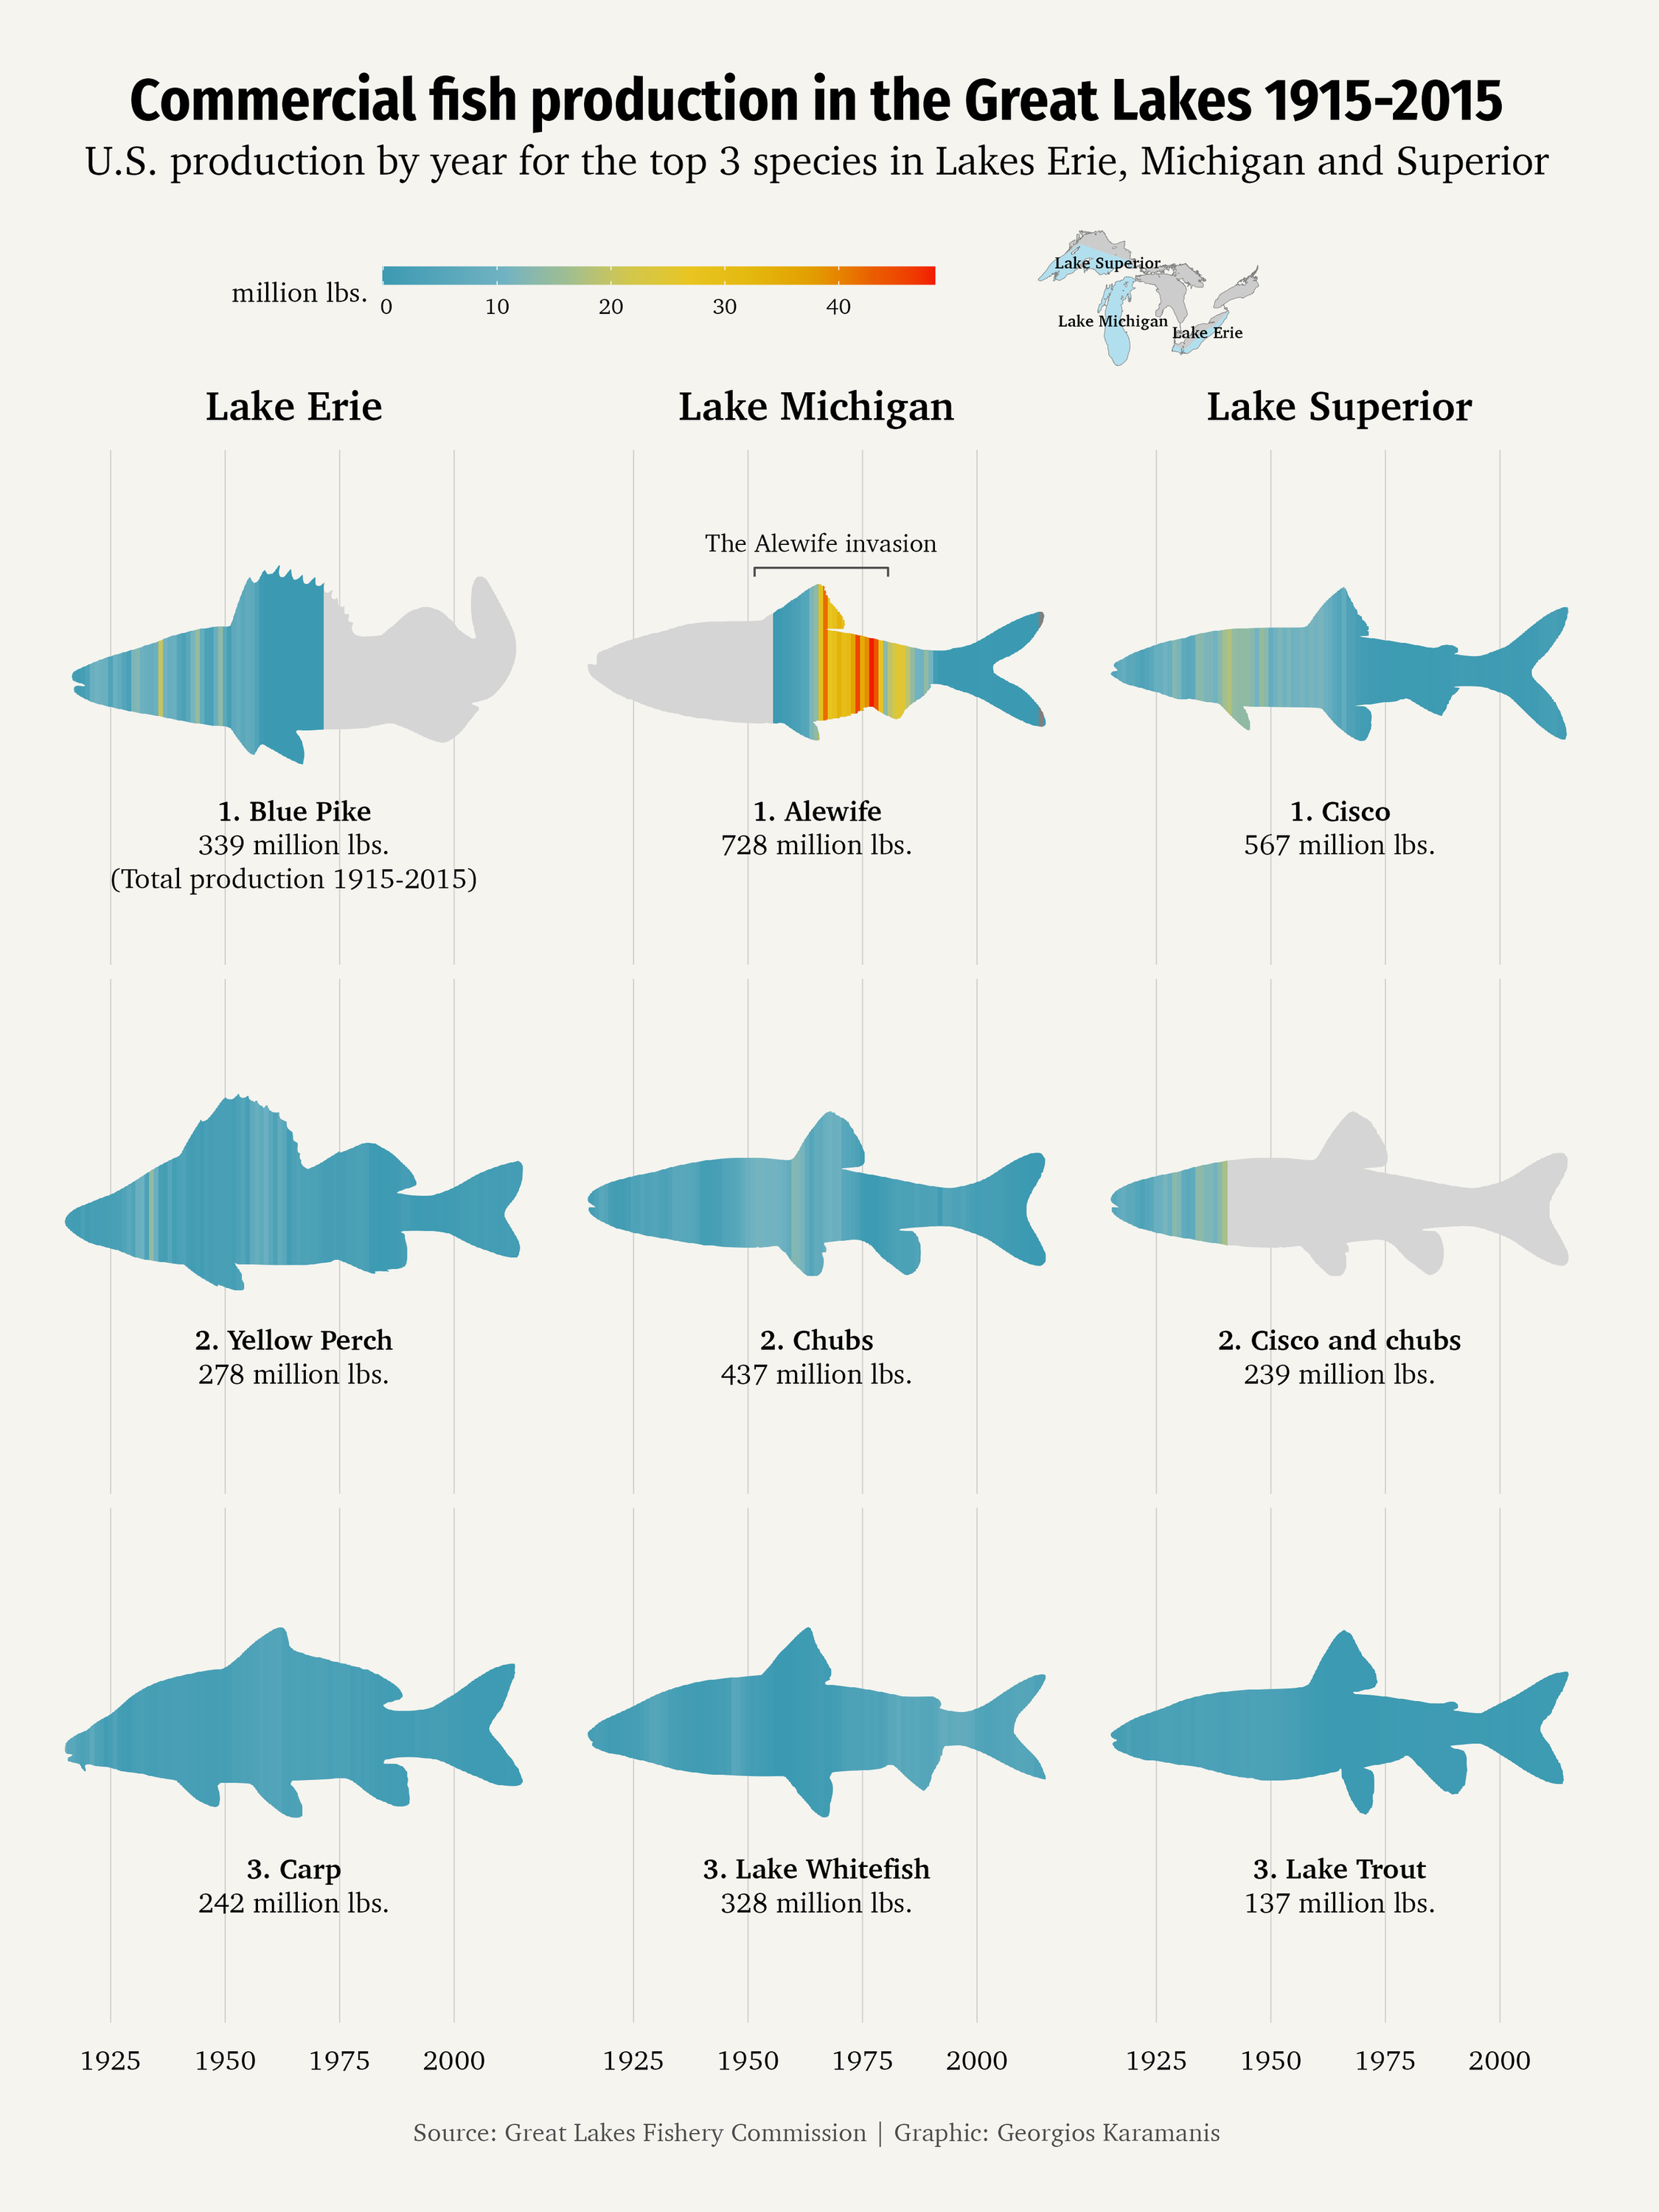
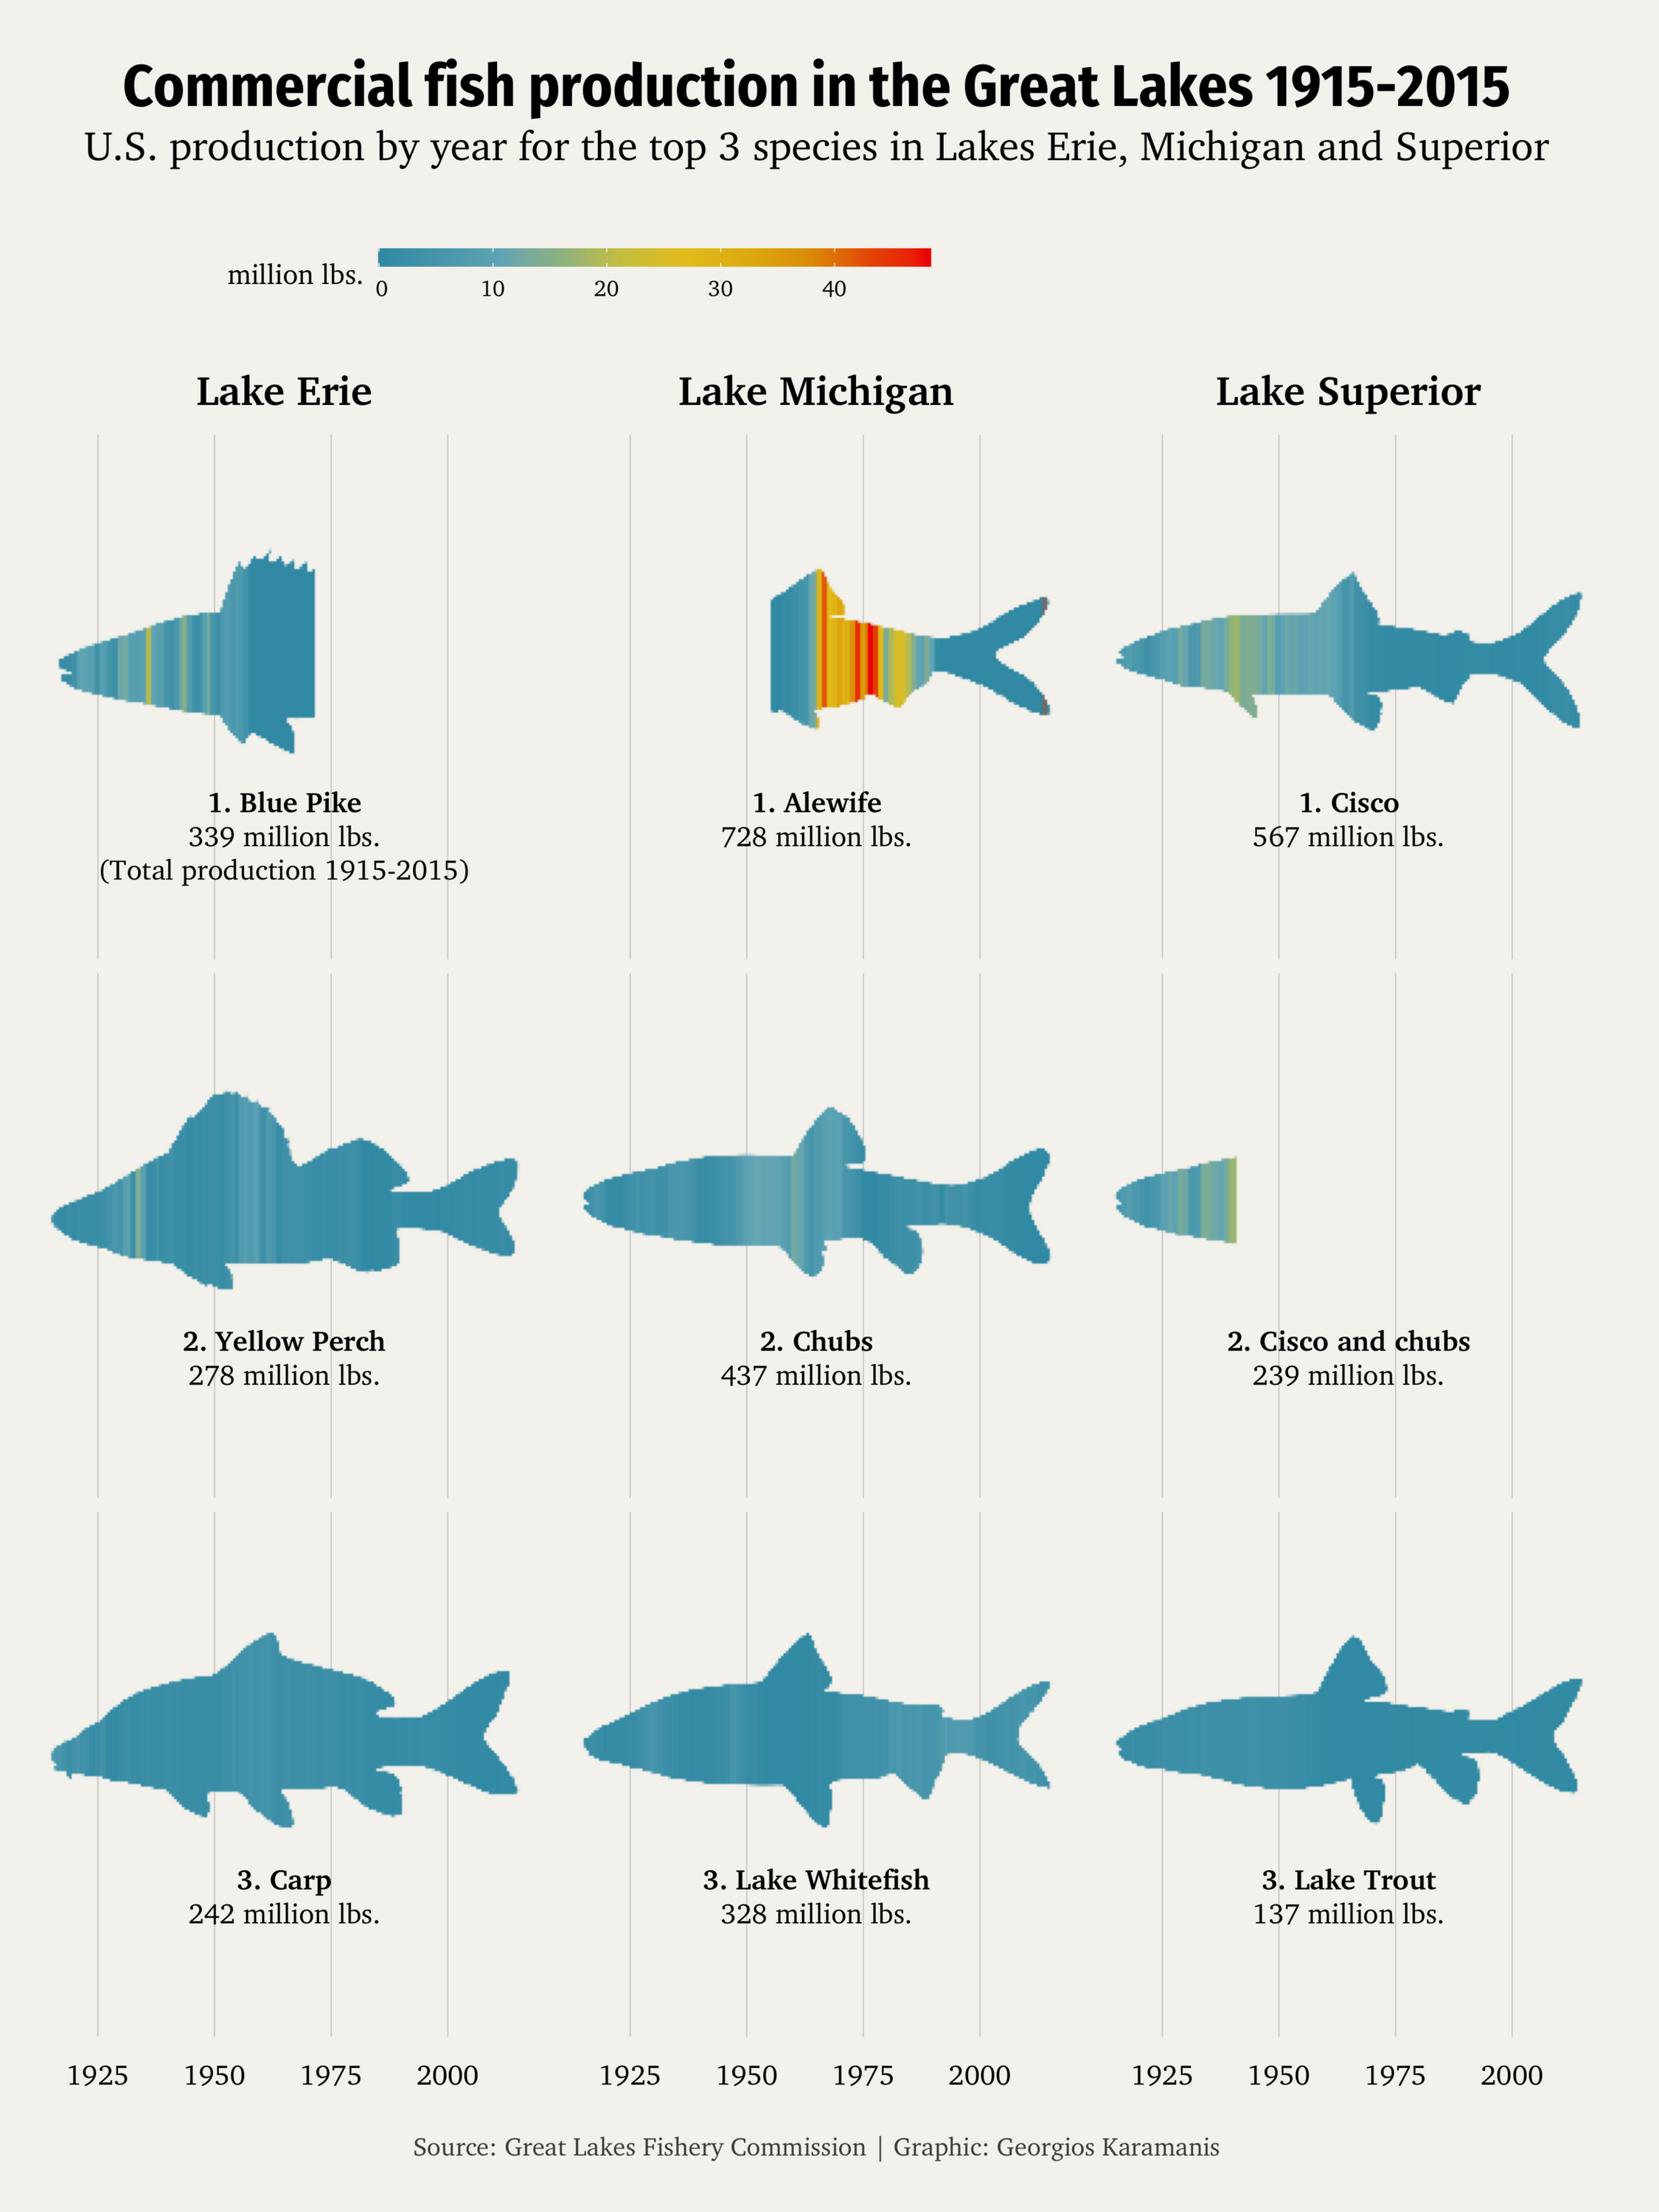
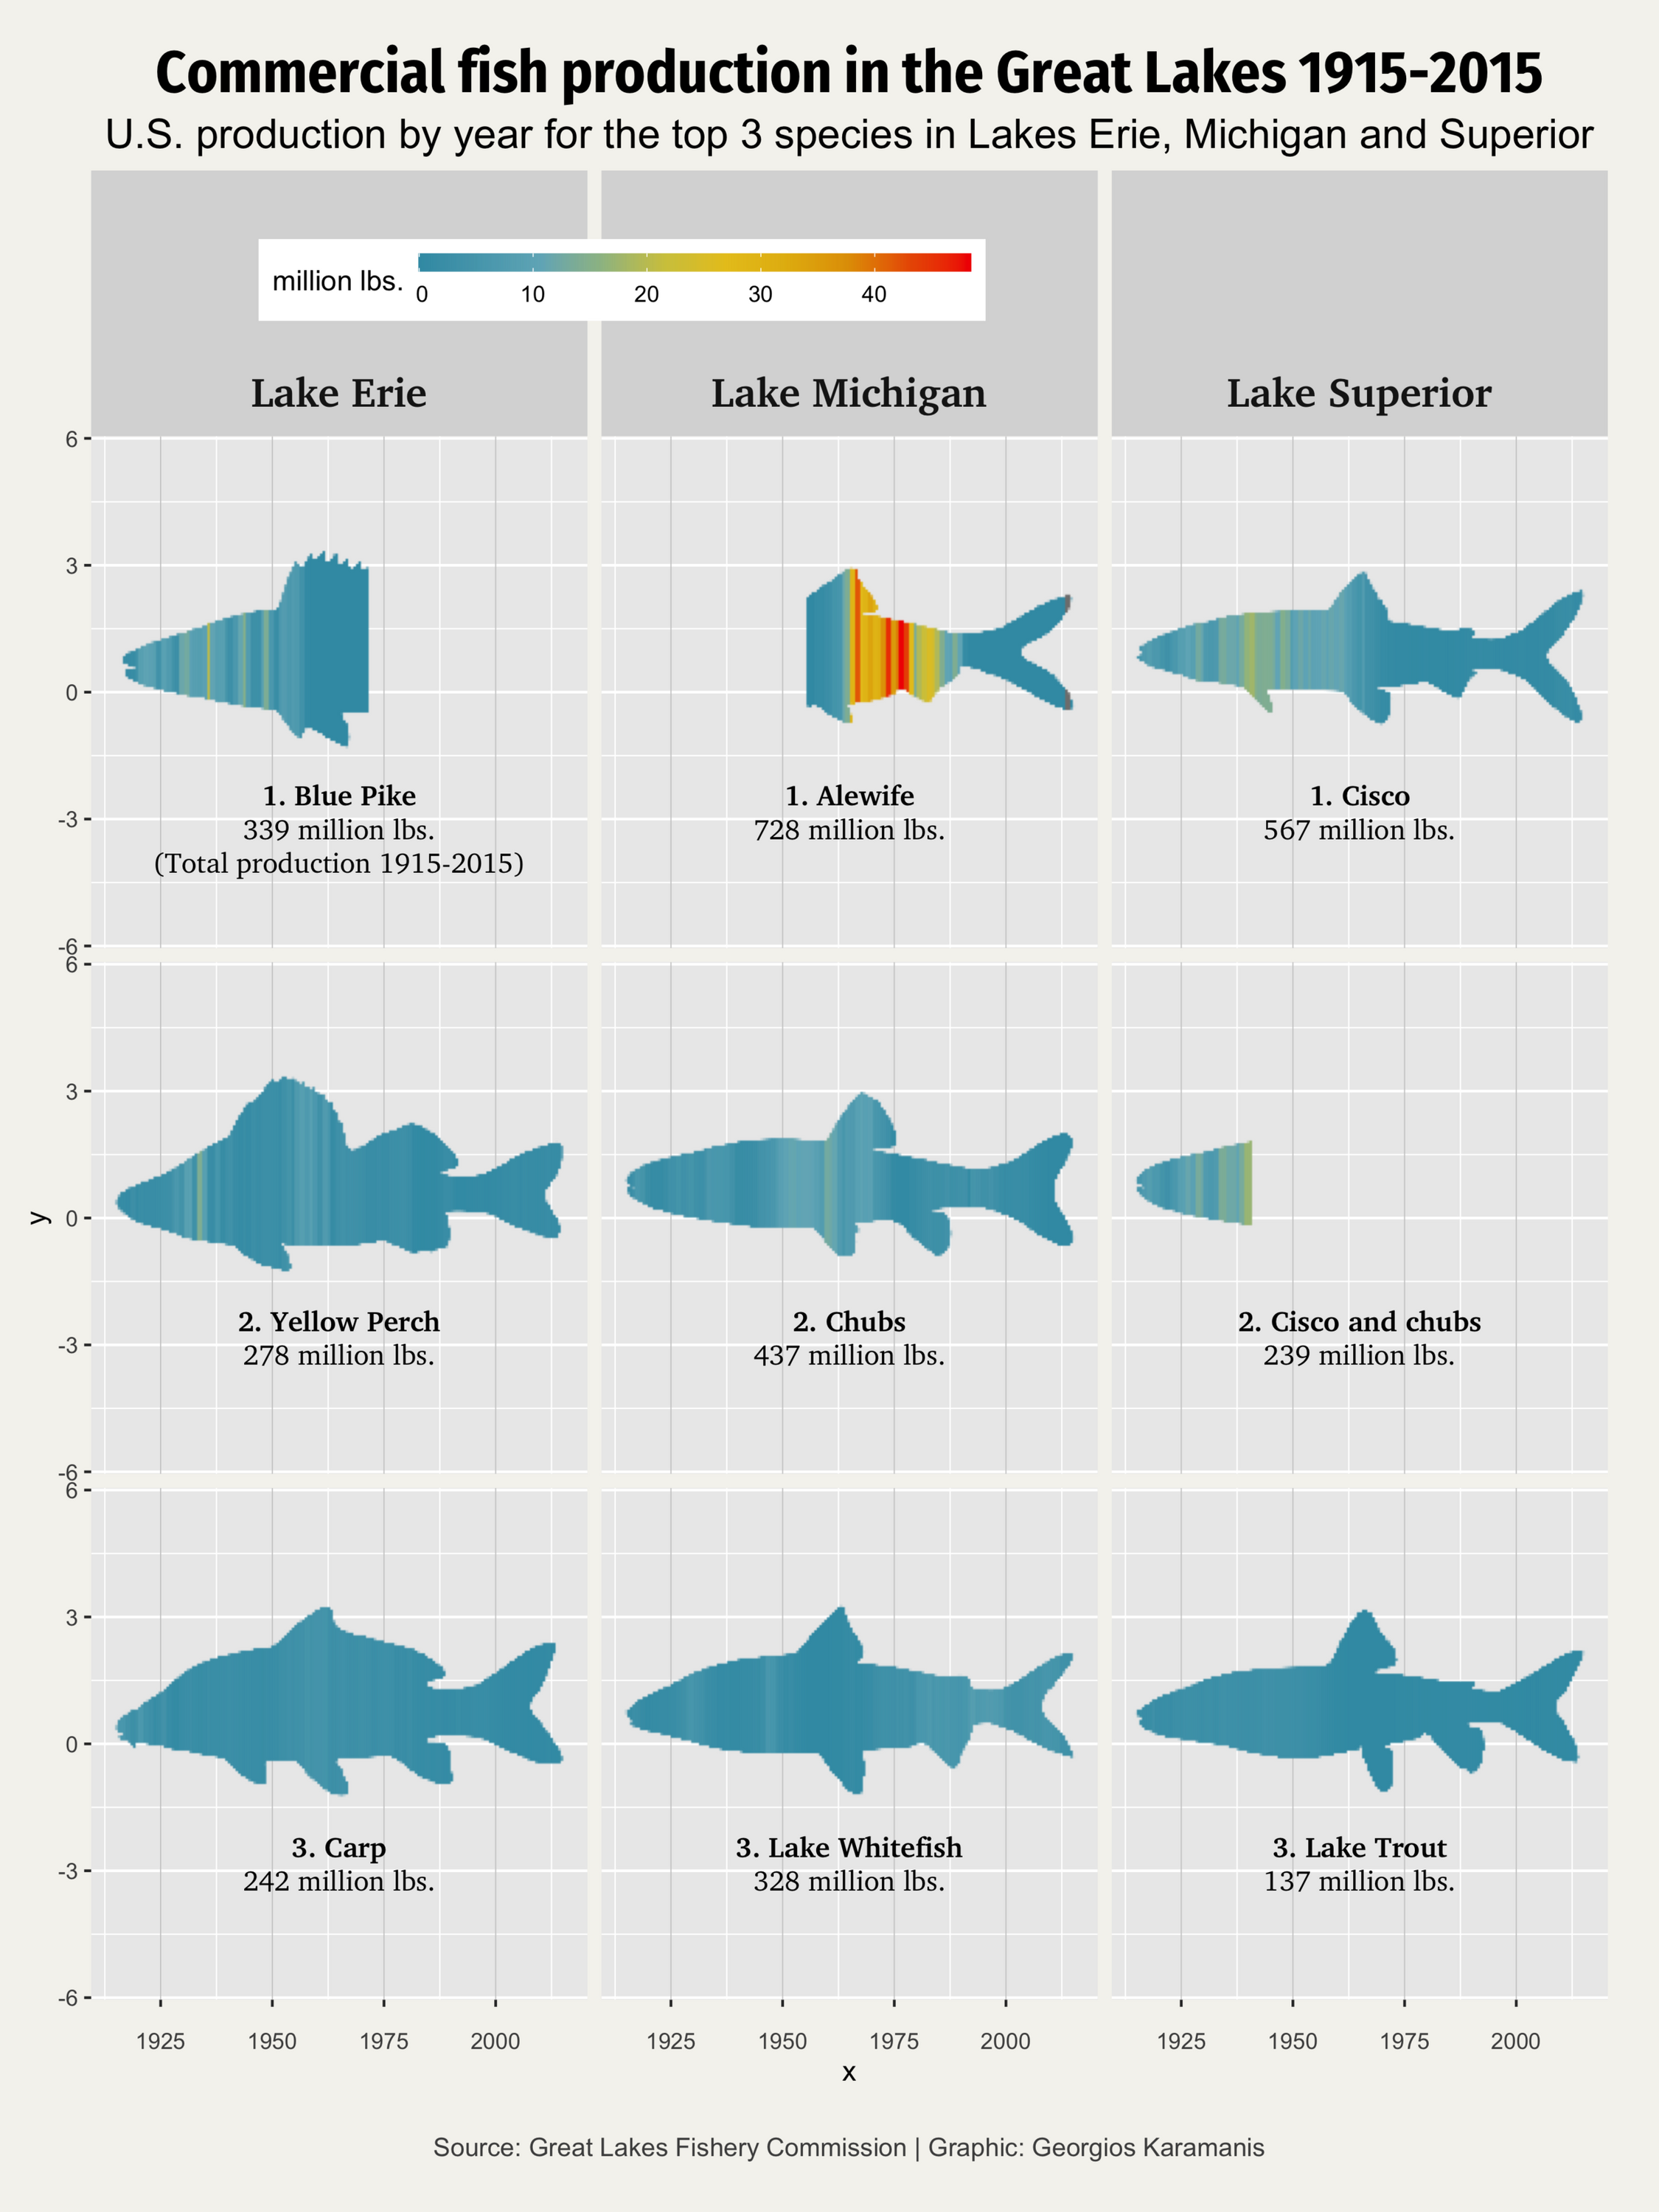
This post is not really a tutorial but more of a visual breakdown of the Commercial Fishing plot I did for last week’s TidyTuesday. The image below is the final plot (tweet) after fixing the numbers that were wrong in the original (tweet).
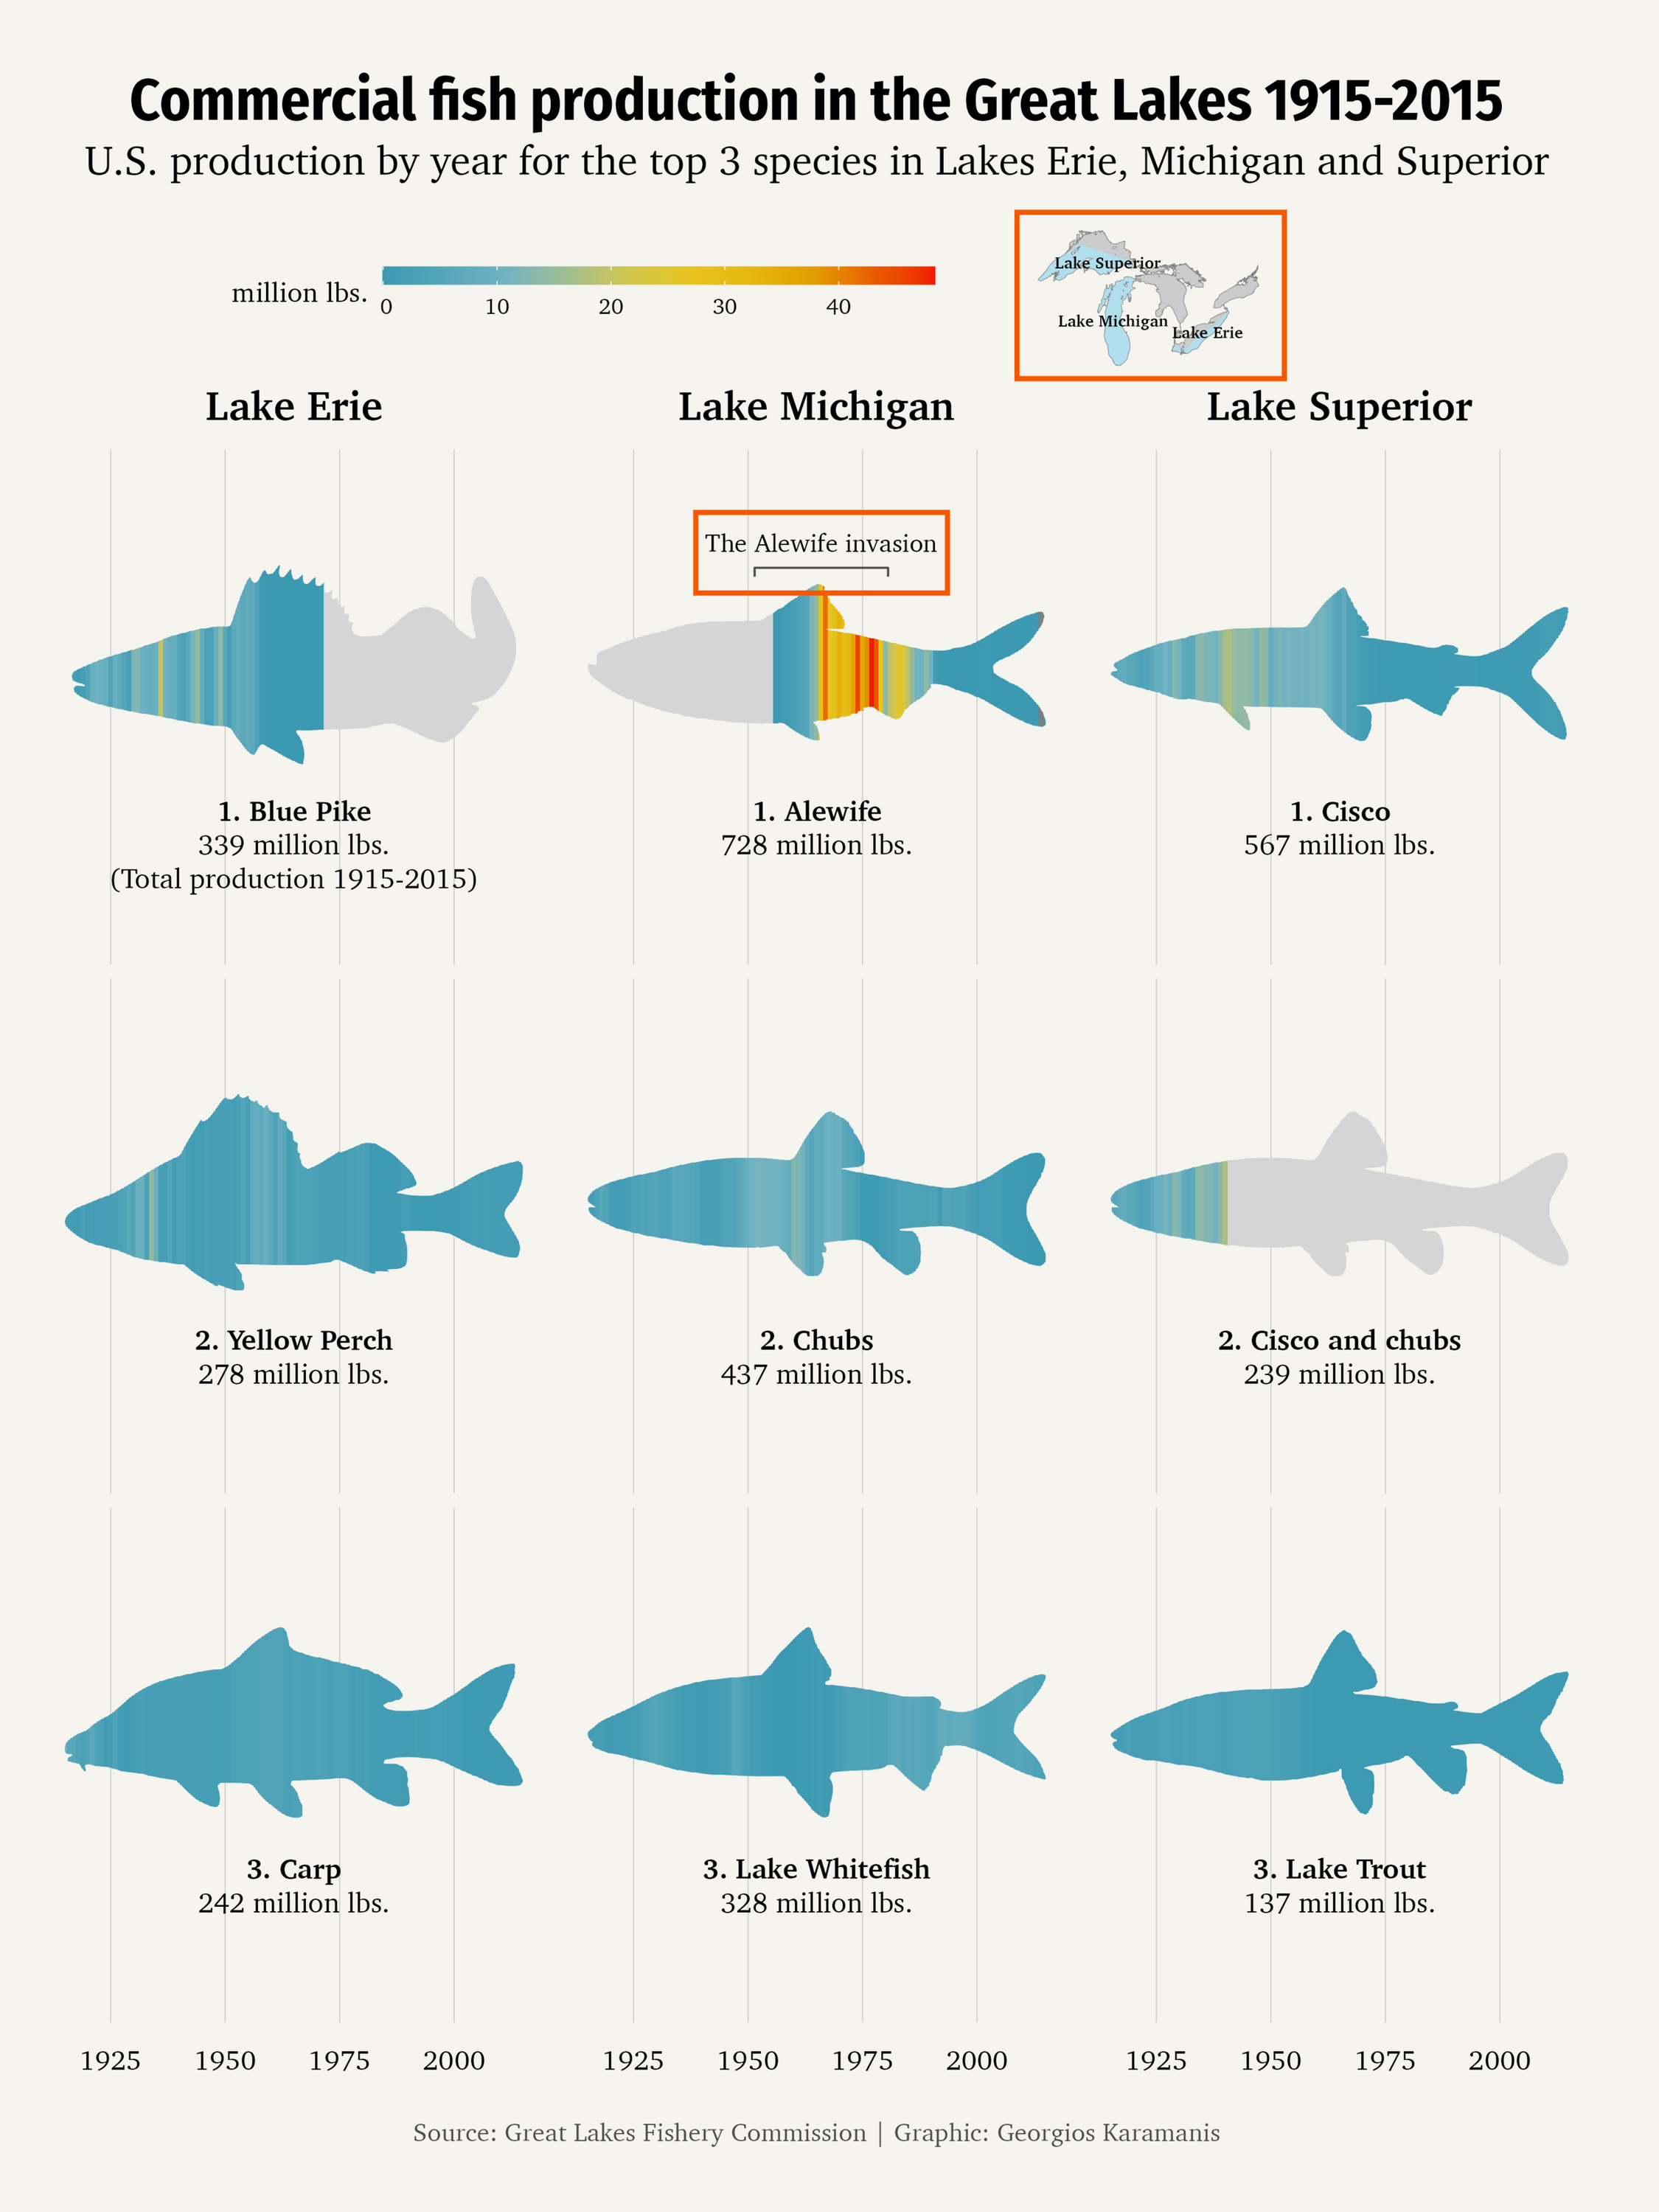
The final plot is actually three plots combined with the patchwork package. The map and annotation plot (annotated with red) were added as insets with the inset_element() function “on top” of the main plot. The main reason I added the annotation as inset was that the main plot is a 3x3 facet plot, which made adding annotations a little harder than having just one panel. There are other ways to do this but I was using patchwork for the map anyway, so I chose the inset method.
Here are the three different plots in their final form:
[View fullsize

 ](_ggfx-fish.png)
[View fullsize

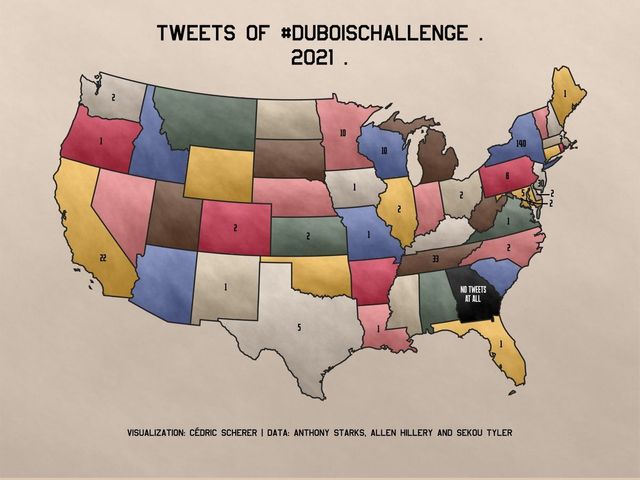
 ](_lakes.png)
[View fullsize

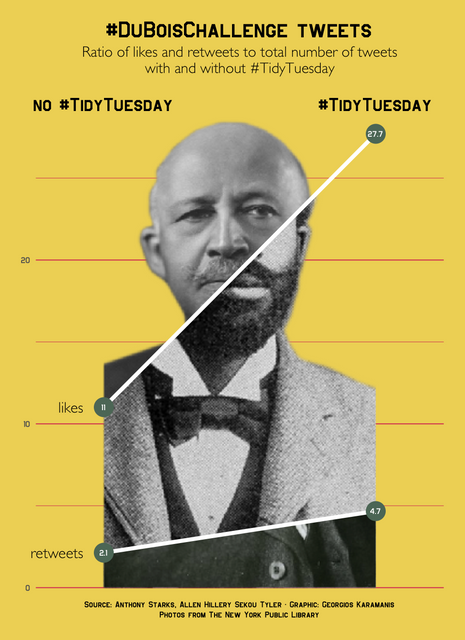
 ](_annotation.png)
#block-yui_3_17_2_1_1623740860183_20373 .sqs-gallery-block-grid .sqs-gallery-design-grid { margin-right: -10px; } #block-yui_3_17_2_1_1623740860183_20373 .sqs-gallery-block-grid .sqs-gallery-design-grid-slide .margin-wrapper { margin-right: 10px; margin-bottom: 10px; }
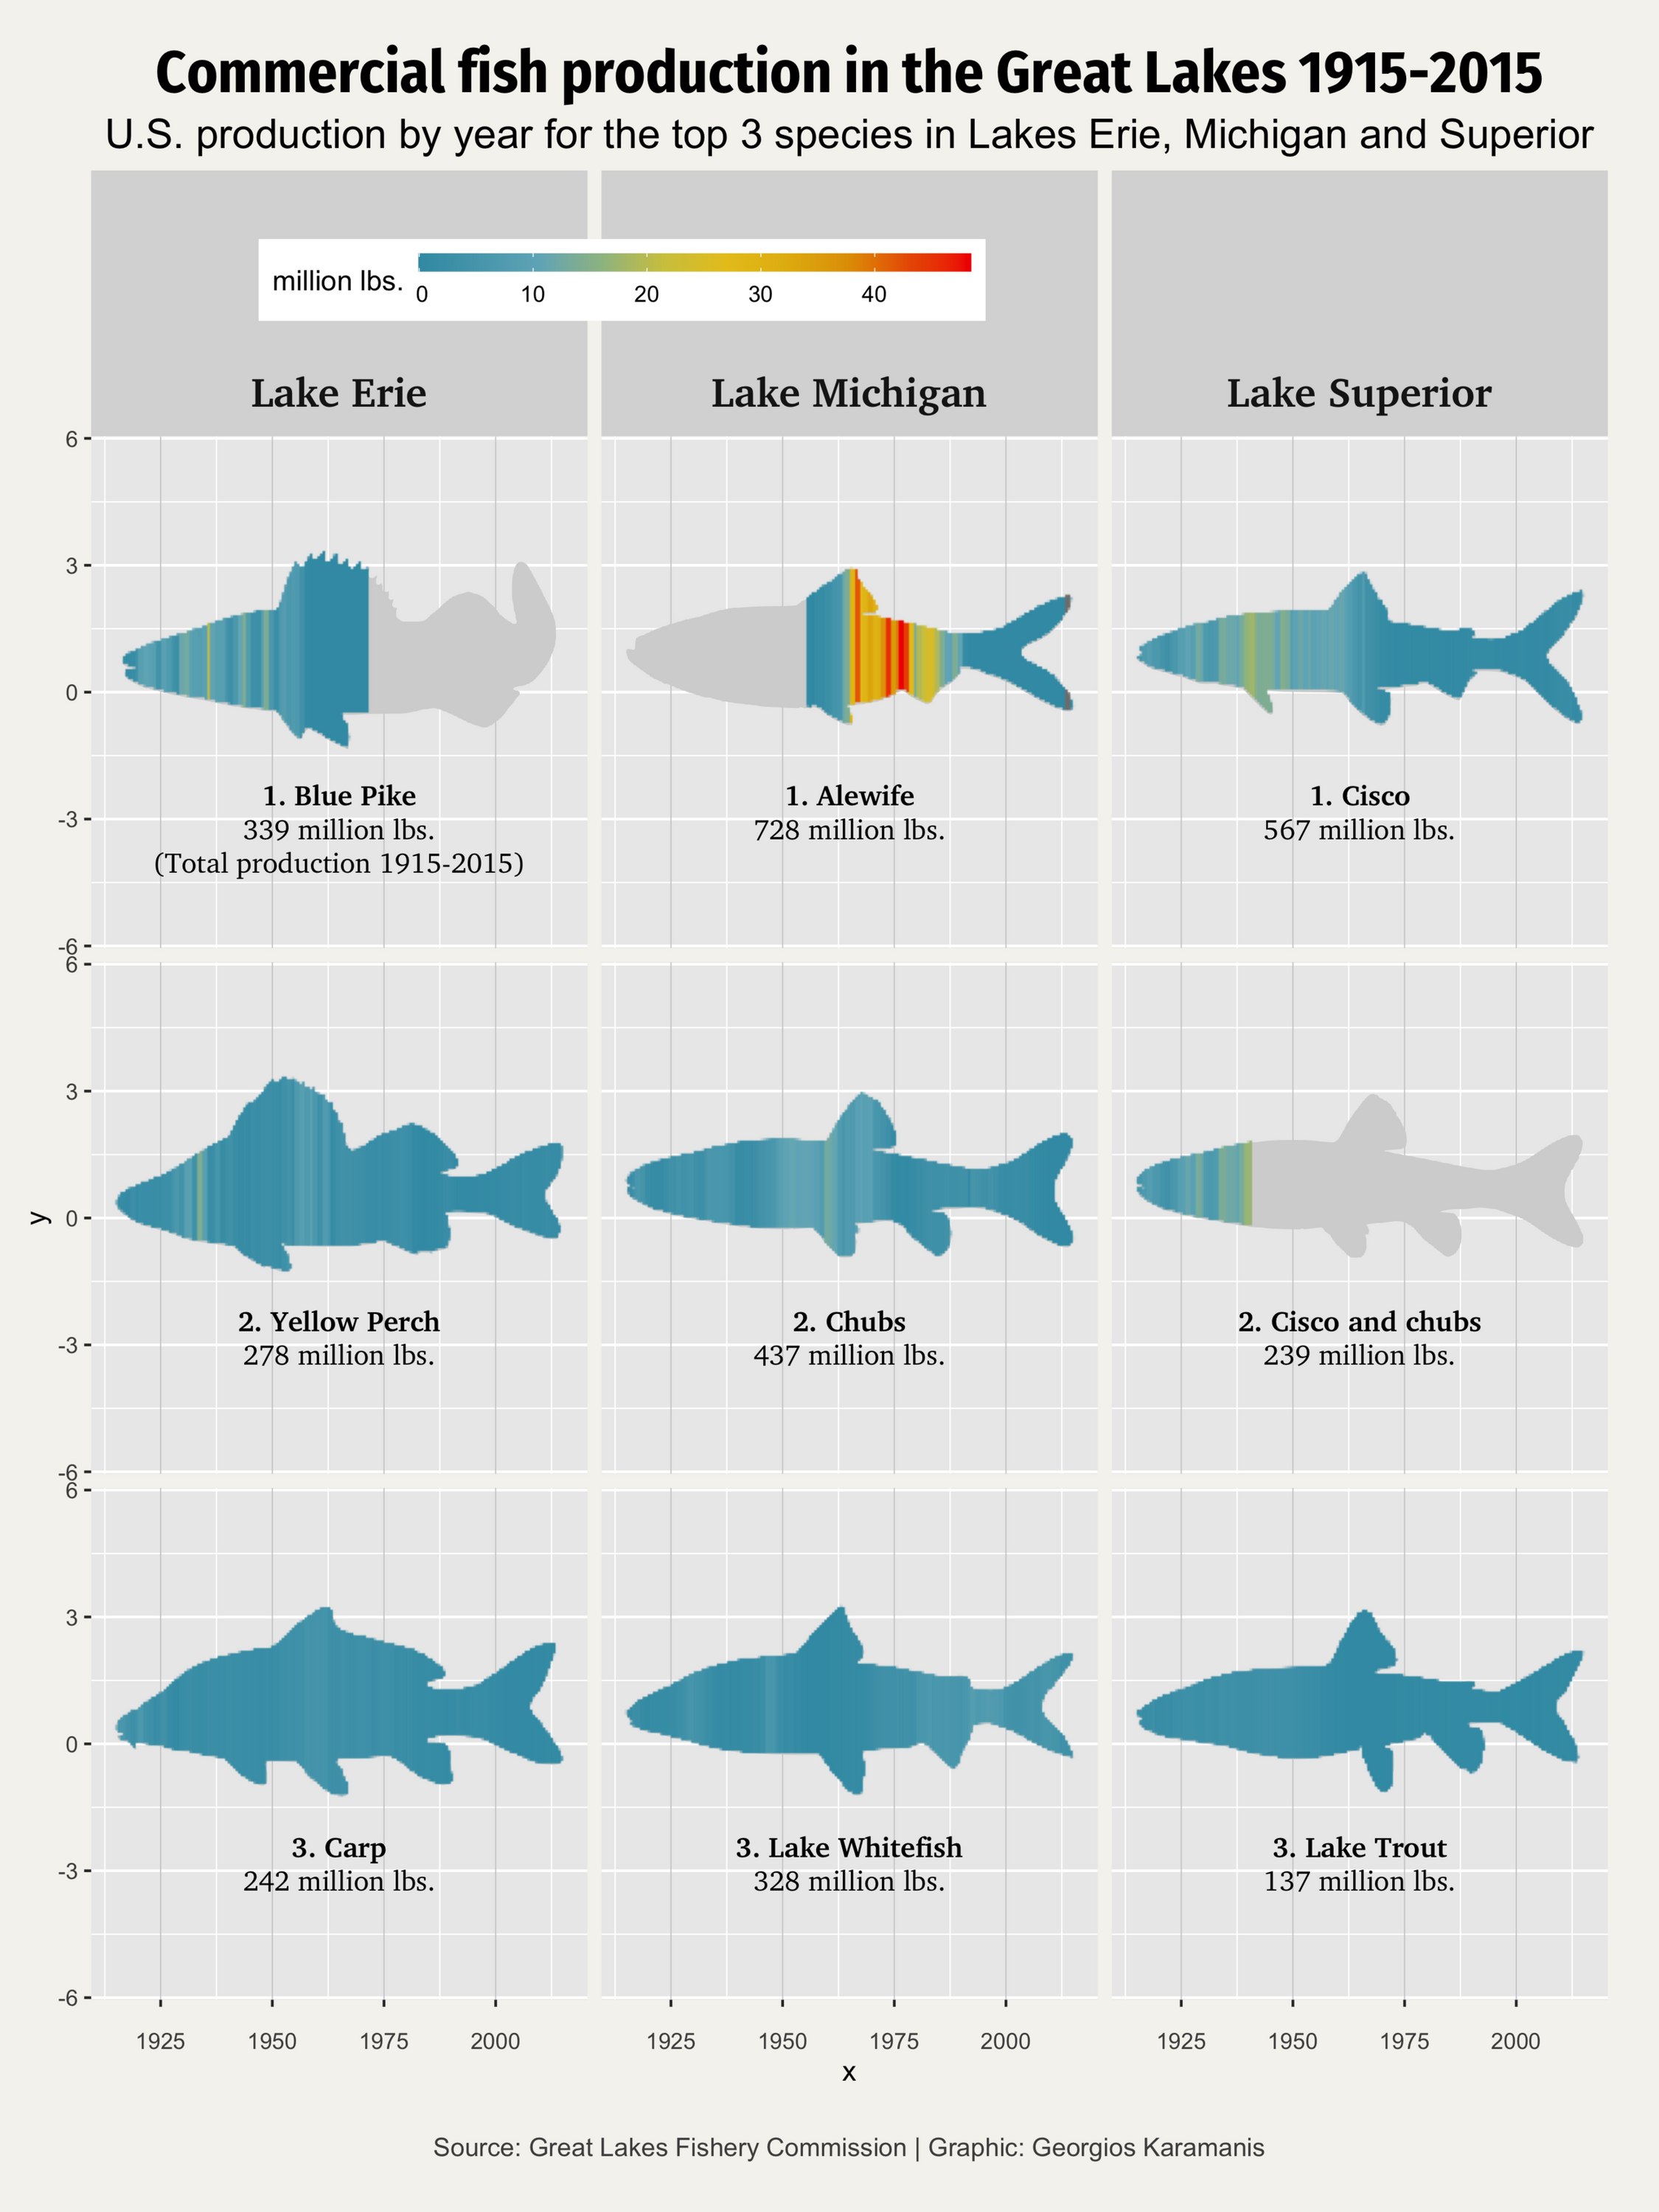
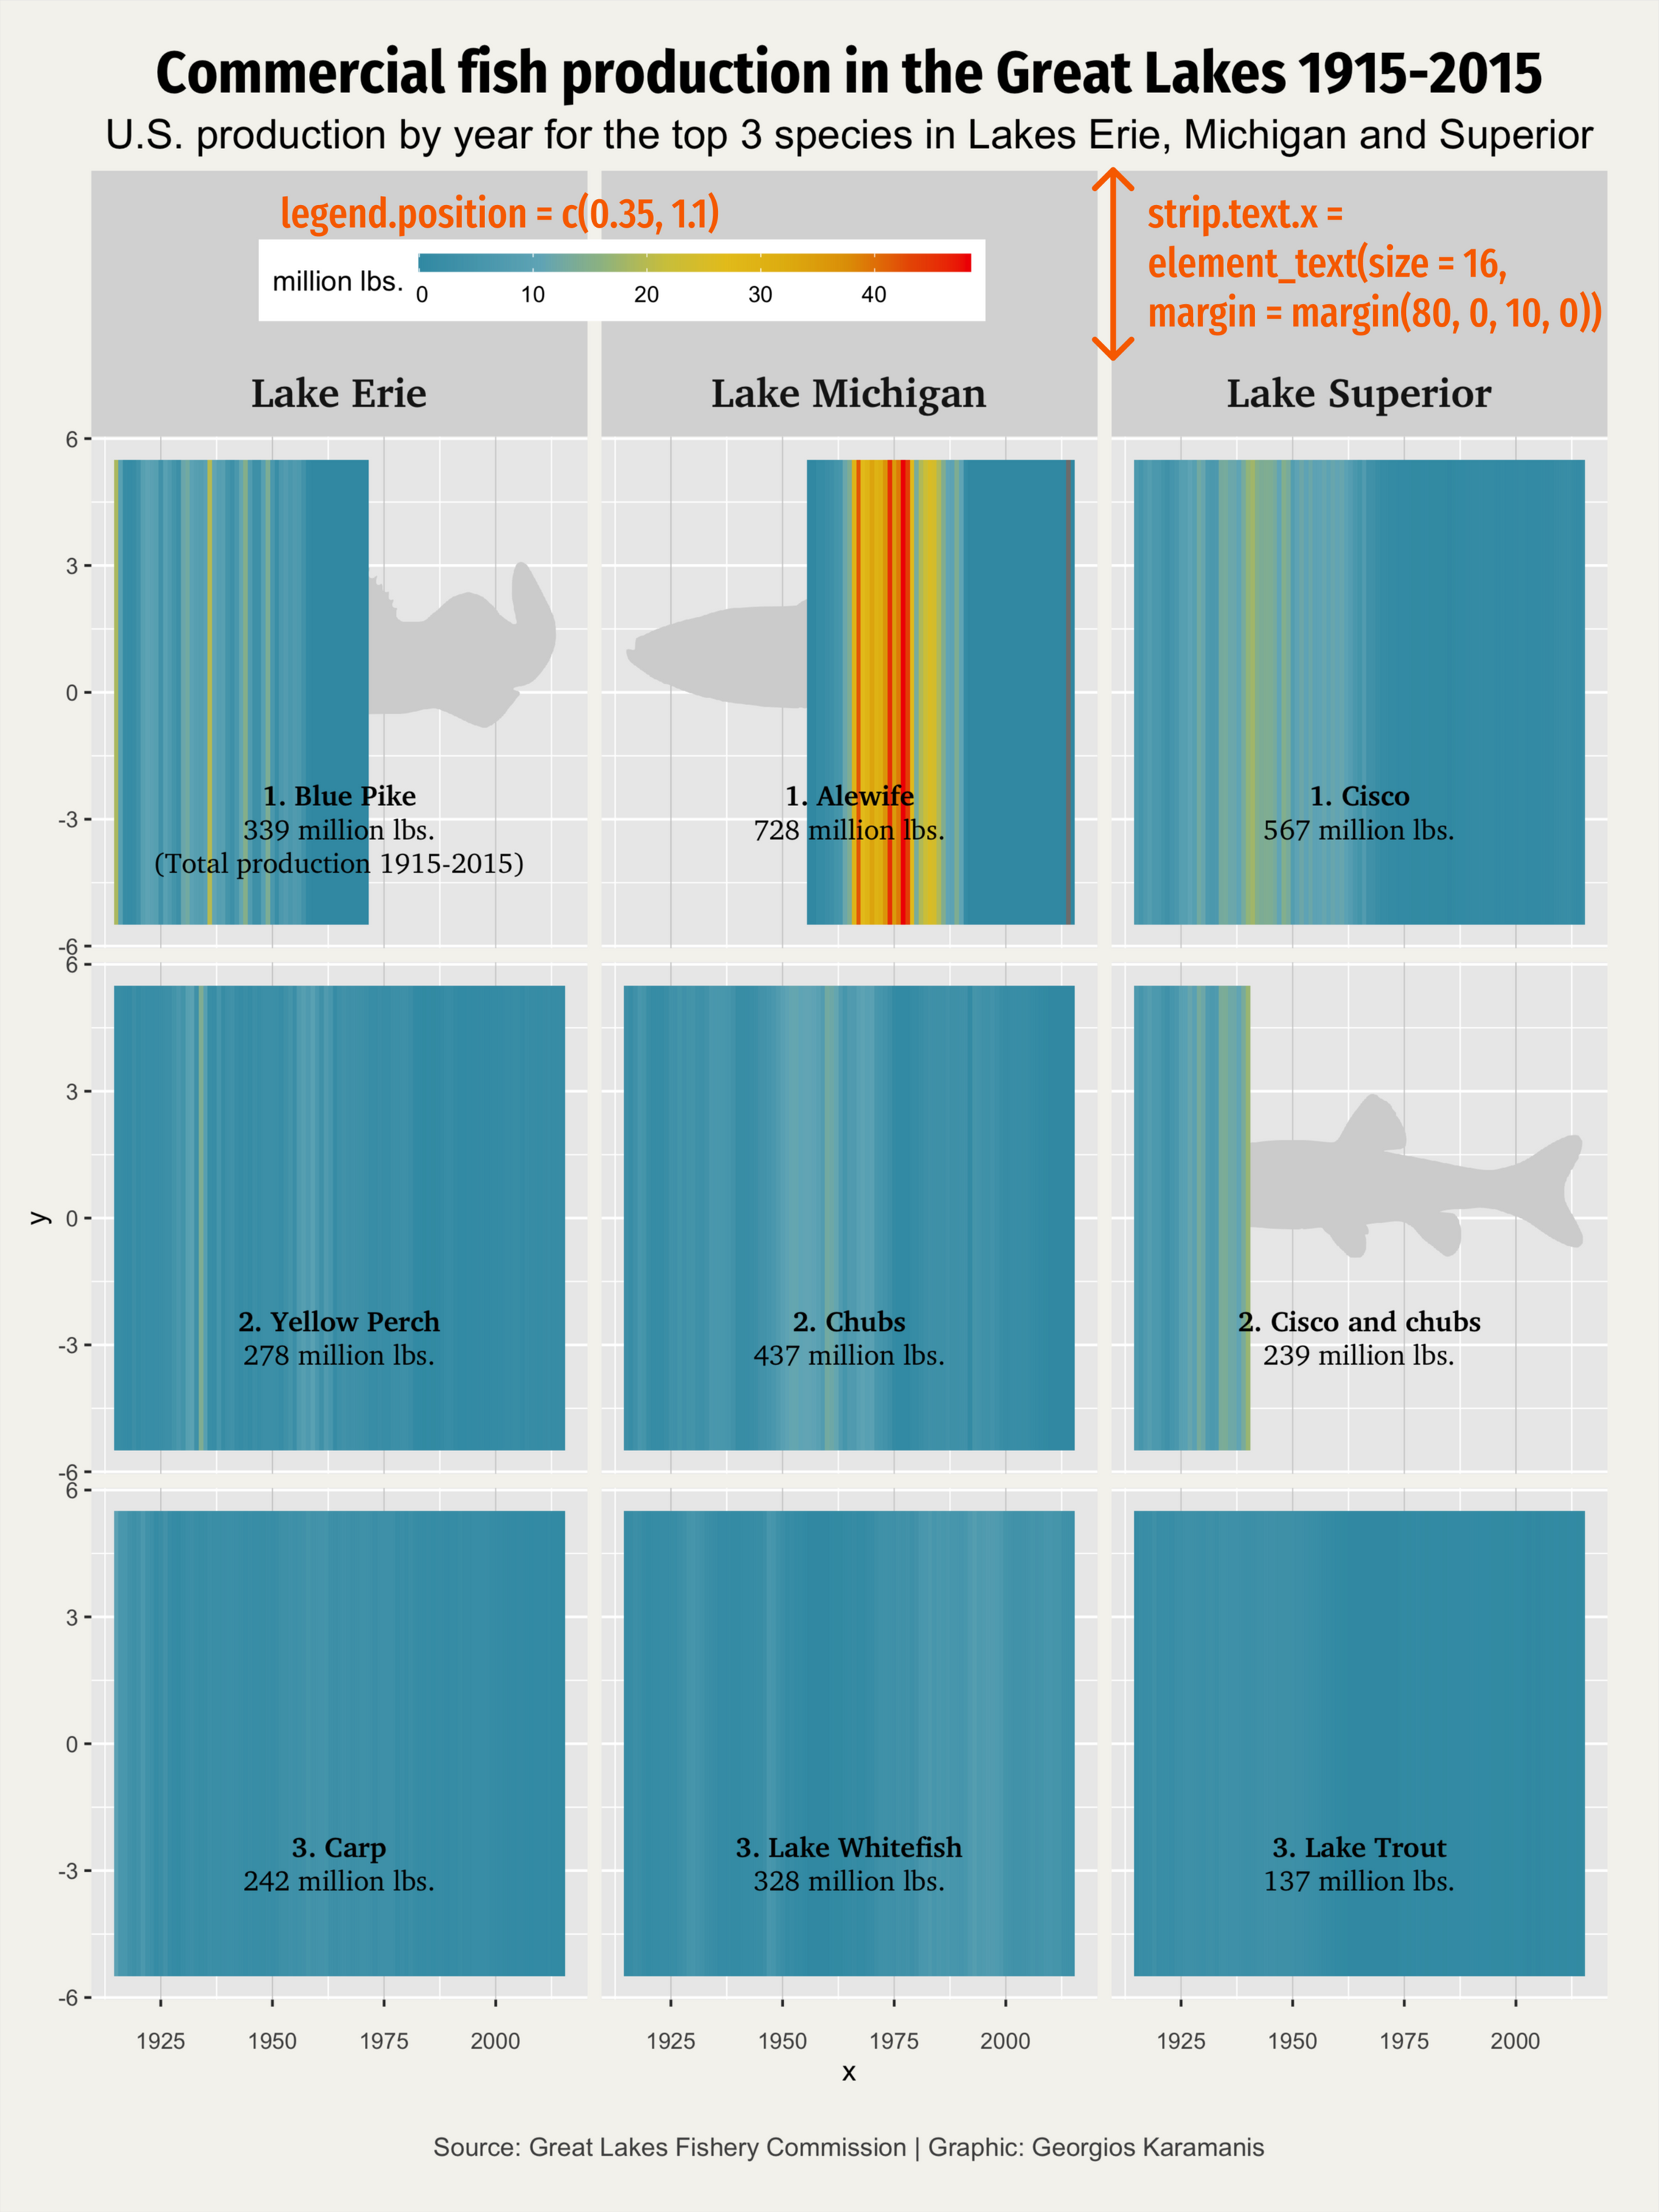
Here is the main plot without the fish. It is basically a warming stripes chart with 3x3 facets, the three lakes and the three top species for each lake.
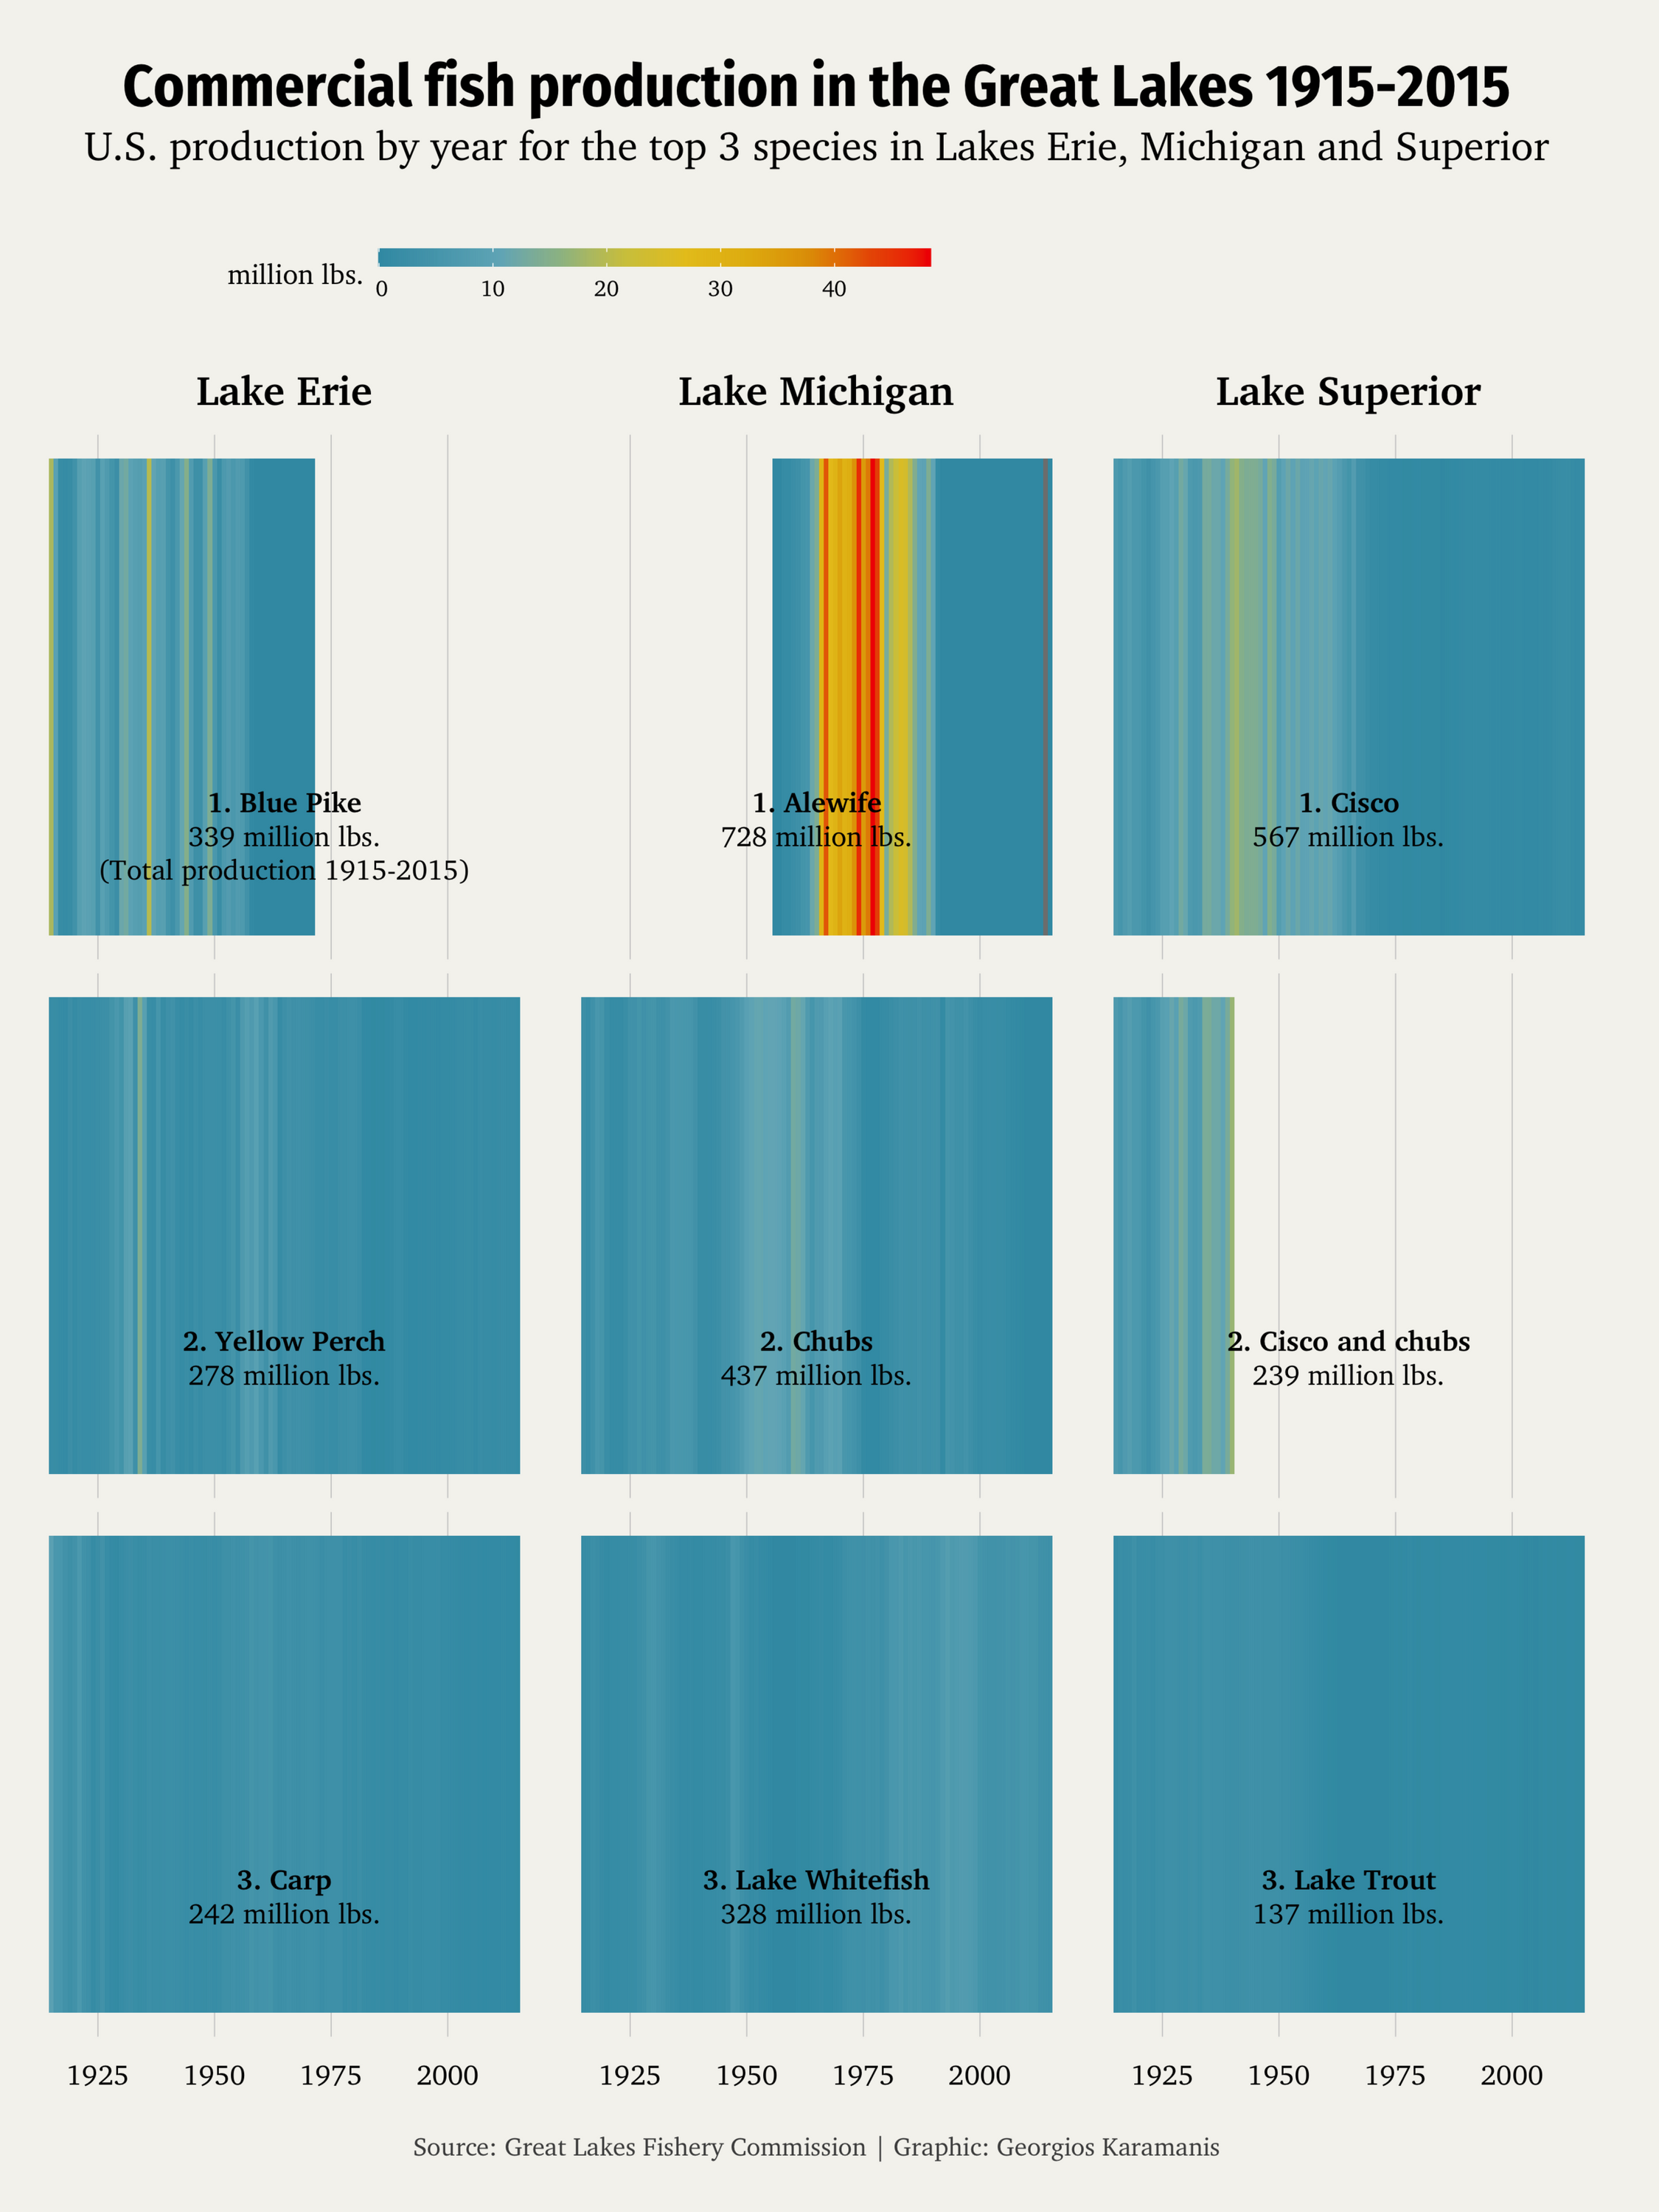
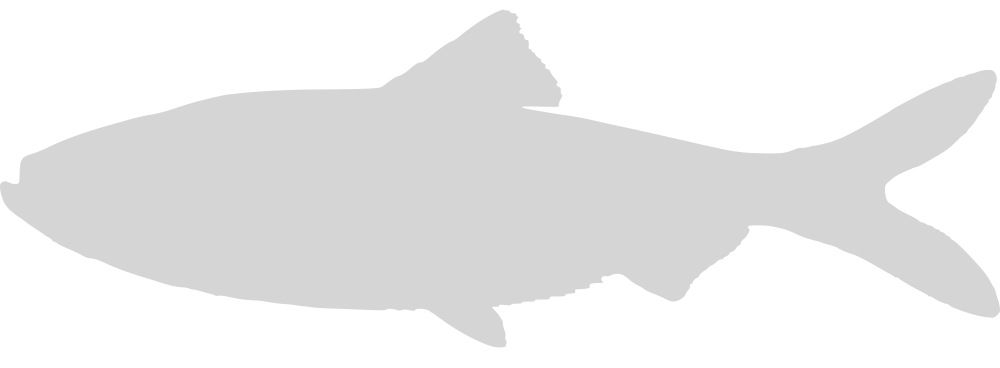
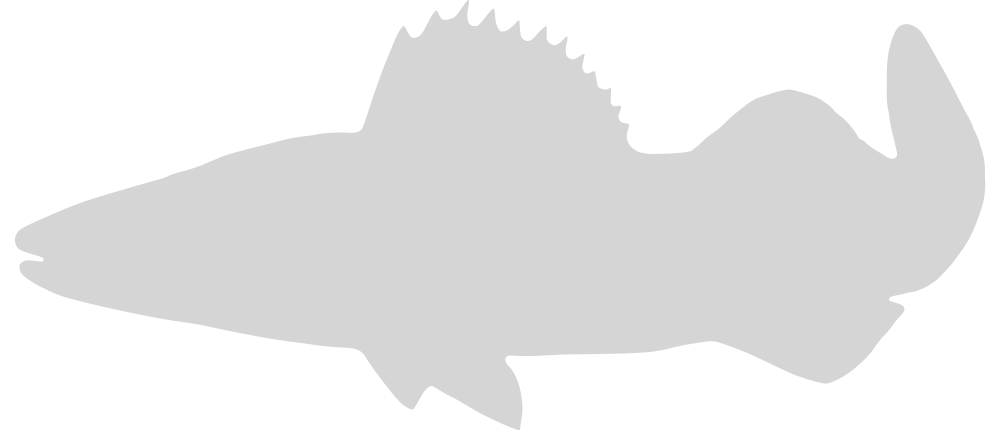
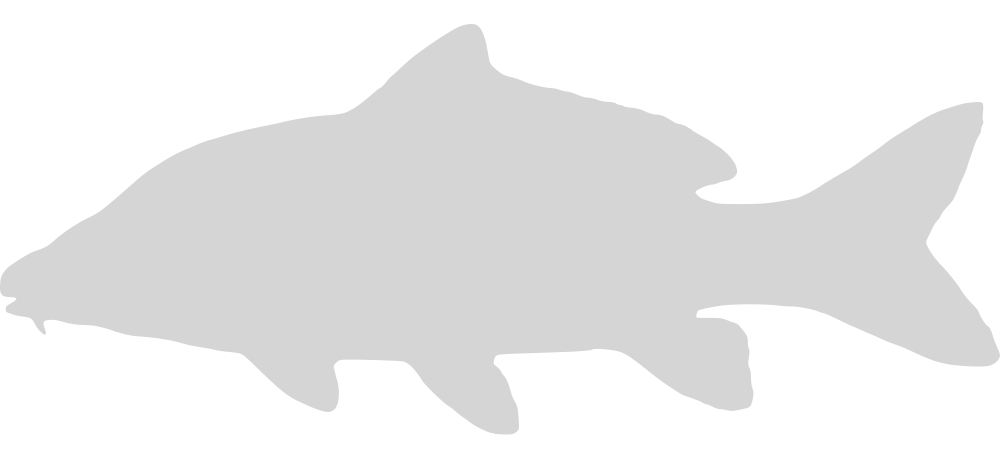
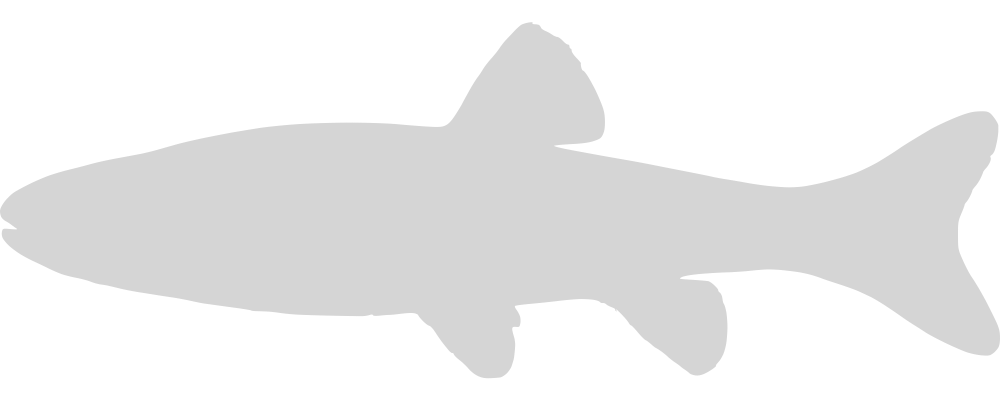
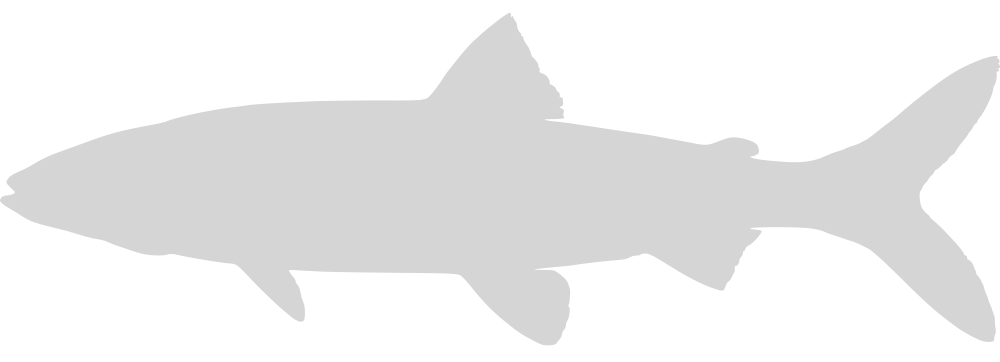
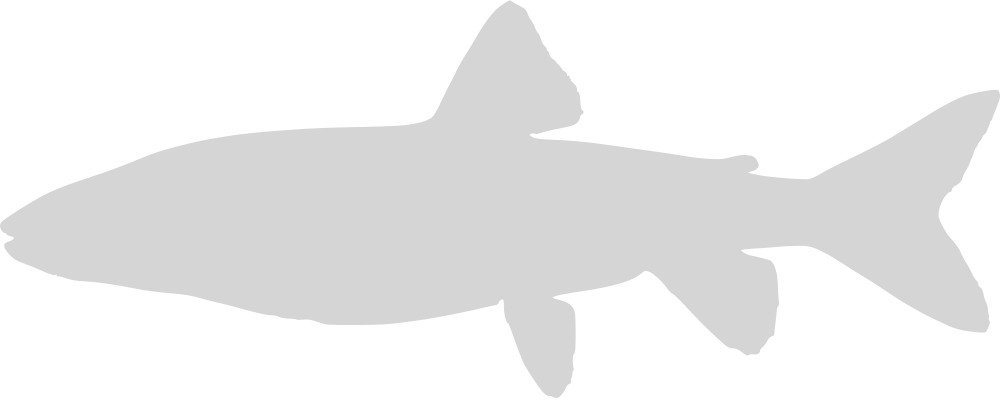
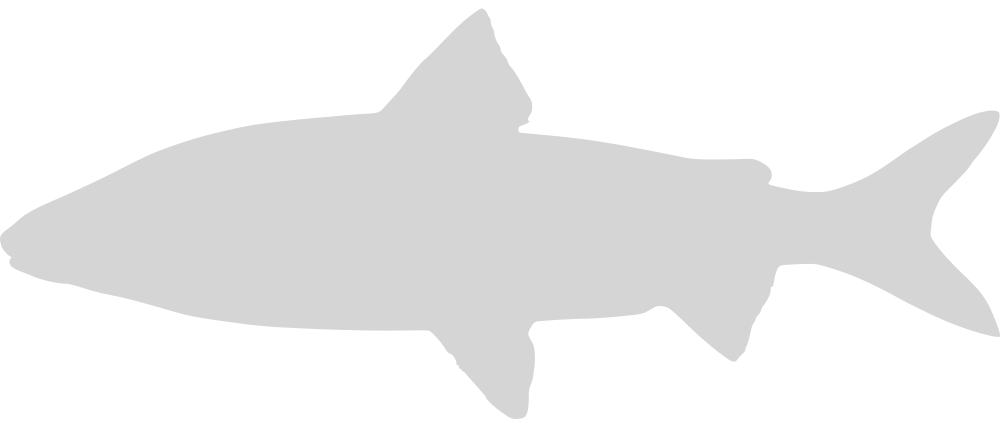
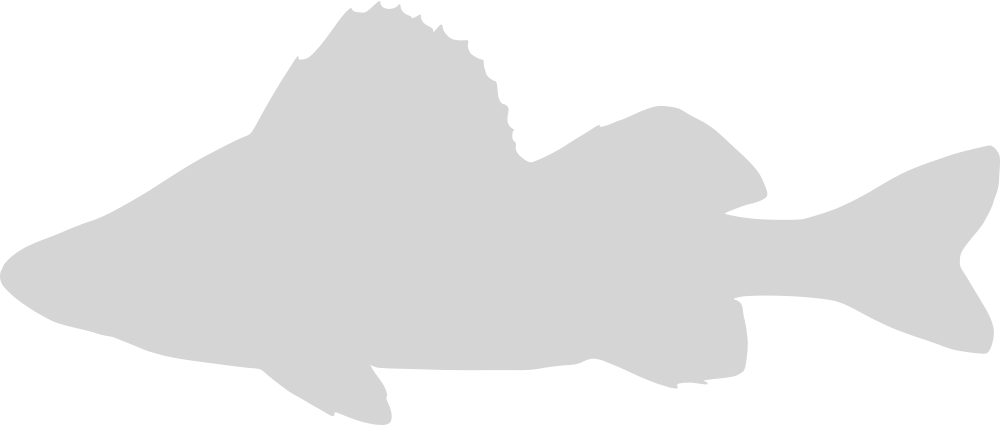
I then used with_blend() from the ggfx package to make “cutouts” of the charts so that they would look like fish. The fish silhouettes were created from illustrations with an image editing app. There were some data missing for three of the fish species, so I added the silhouettes as the bottom layer in all facets to better show the missing parts but, mostly, to have nice fish shapes everywhere.


#block-yui_3_17_2_1_1623907958870_64275 .sqs-gallery-block-grid .sqs-gallery-design-grid { margin-right: -1px; } #block-yui_3_17_2_1_1623907958870_64275 .sqs-gallery-block-grid .sqs-gallery-design-grid-slide .margin-wrapper { margin-right: 1px; margin-bottom: 1px; }
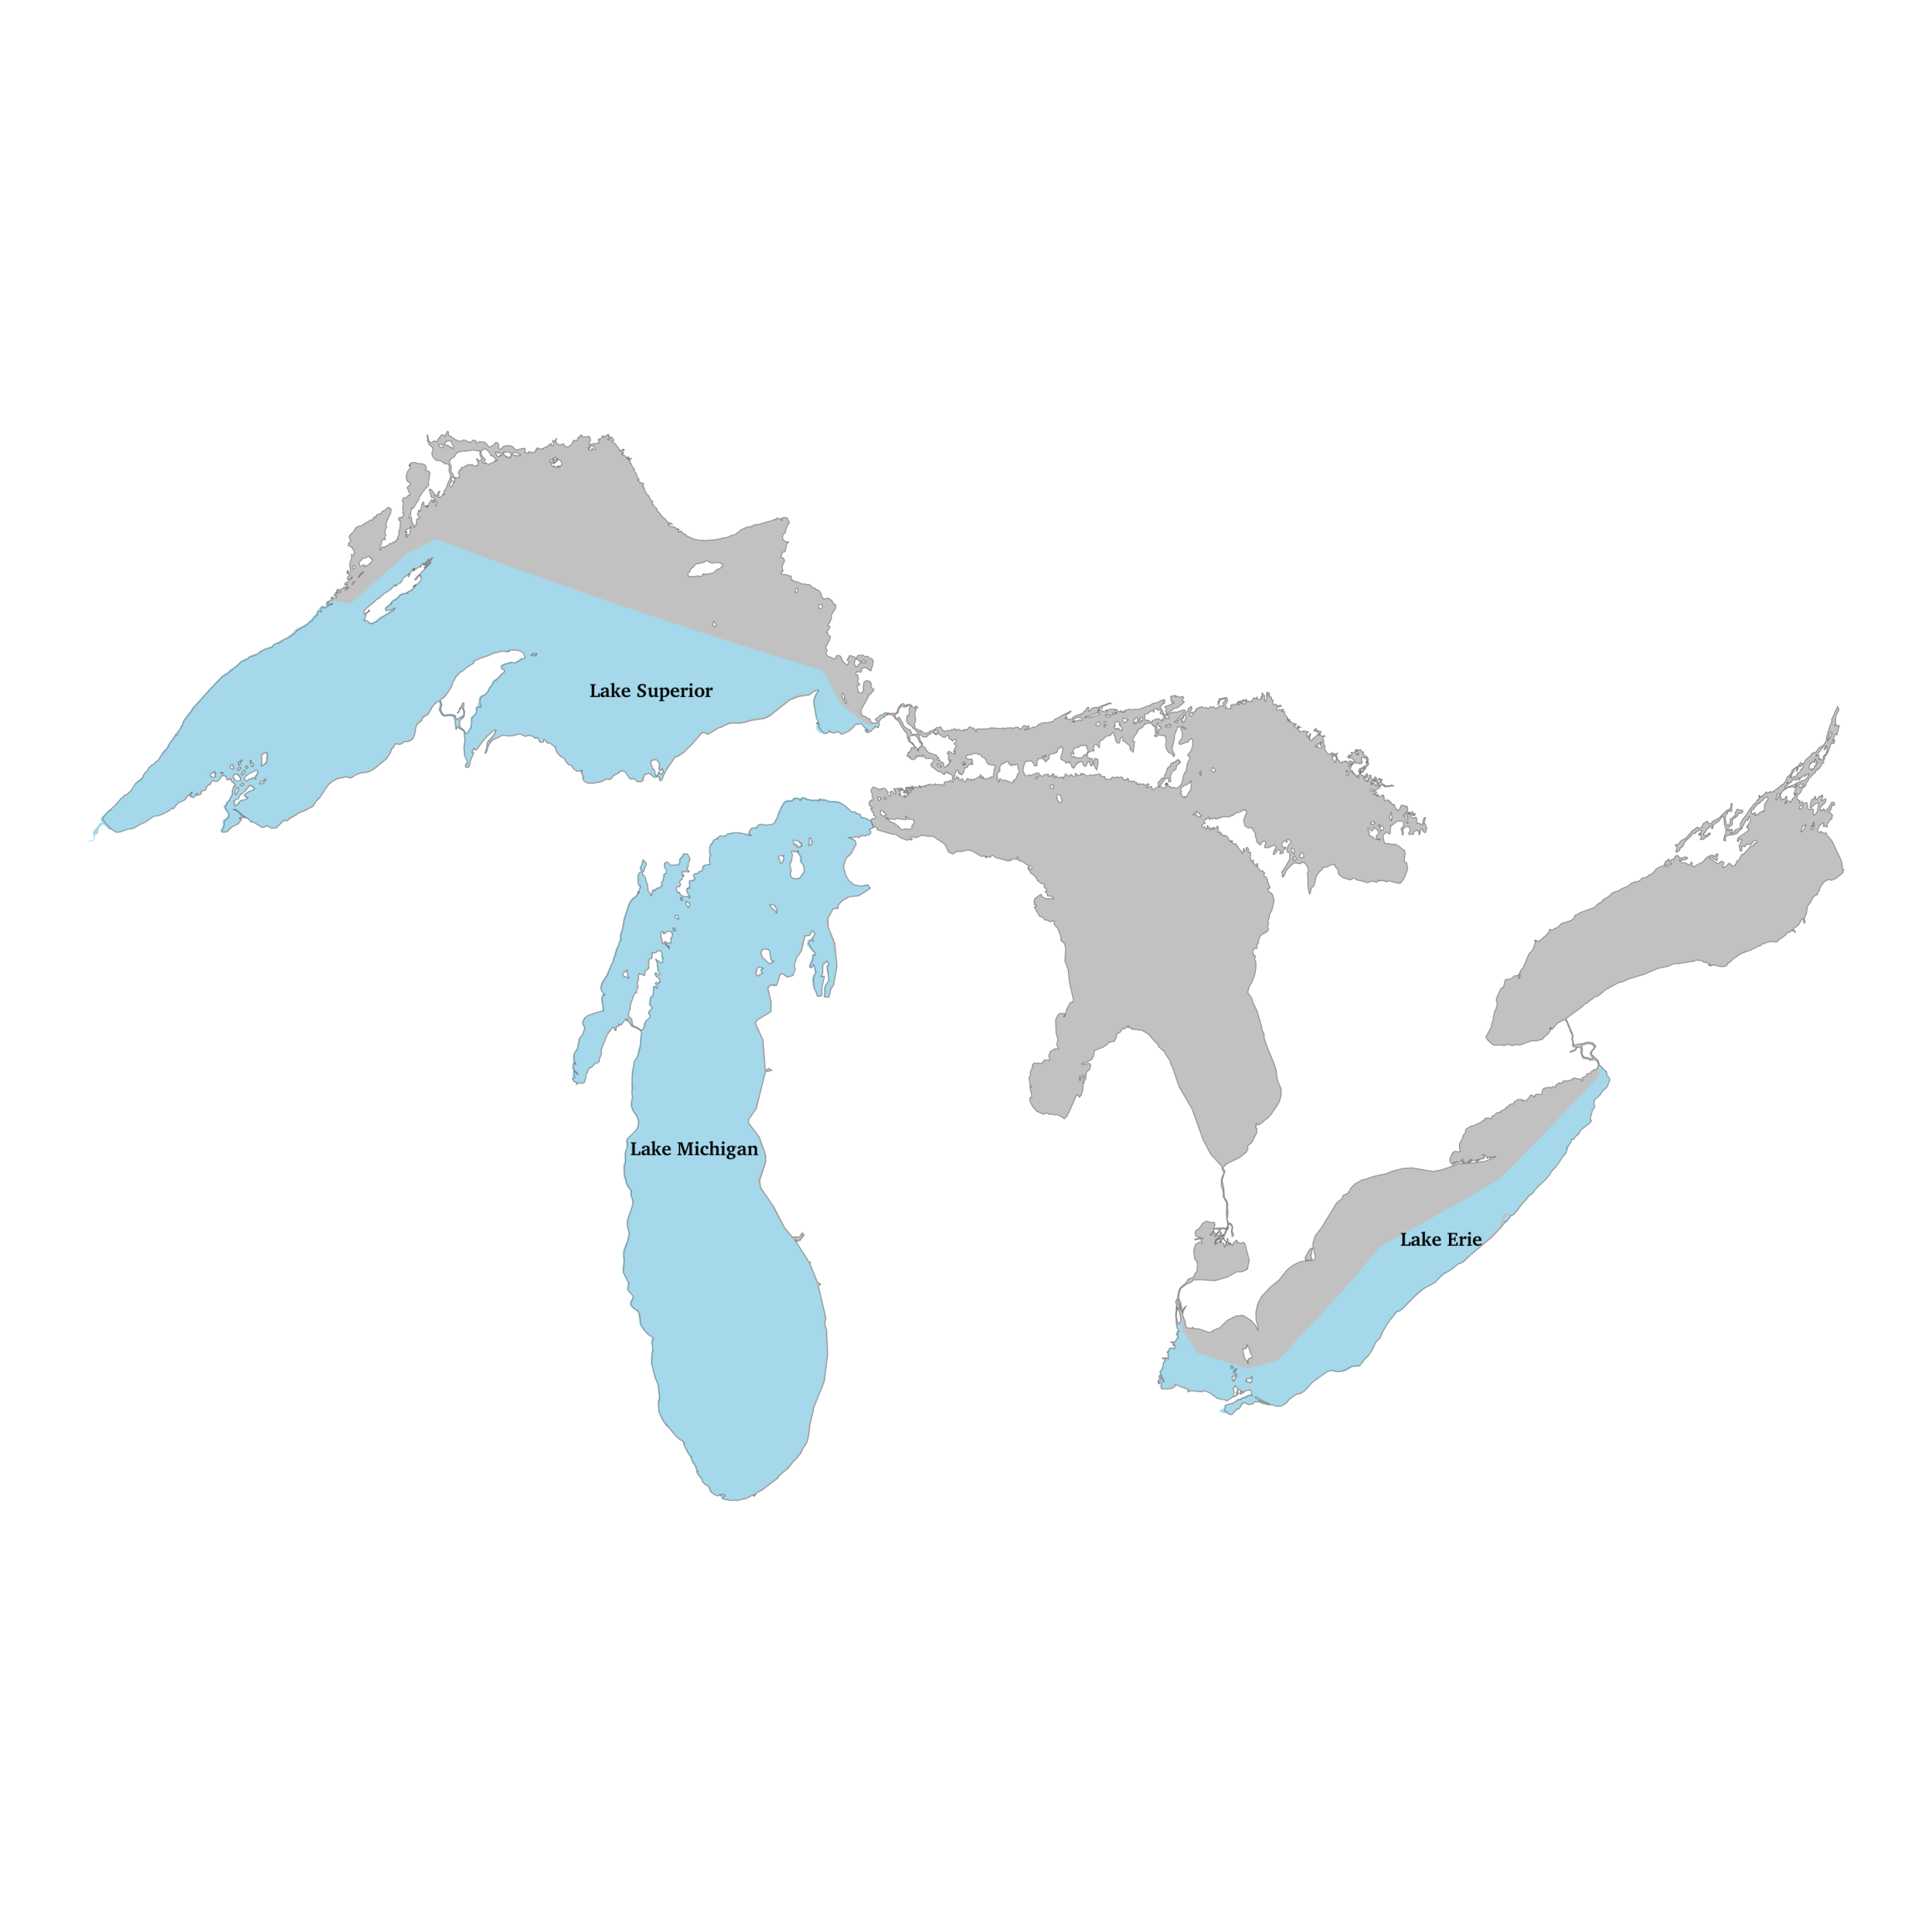
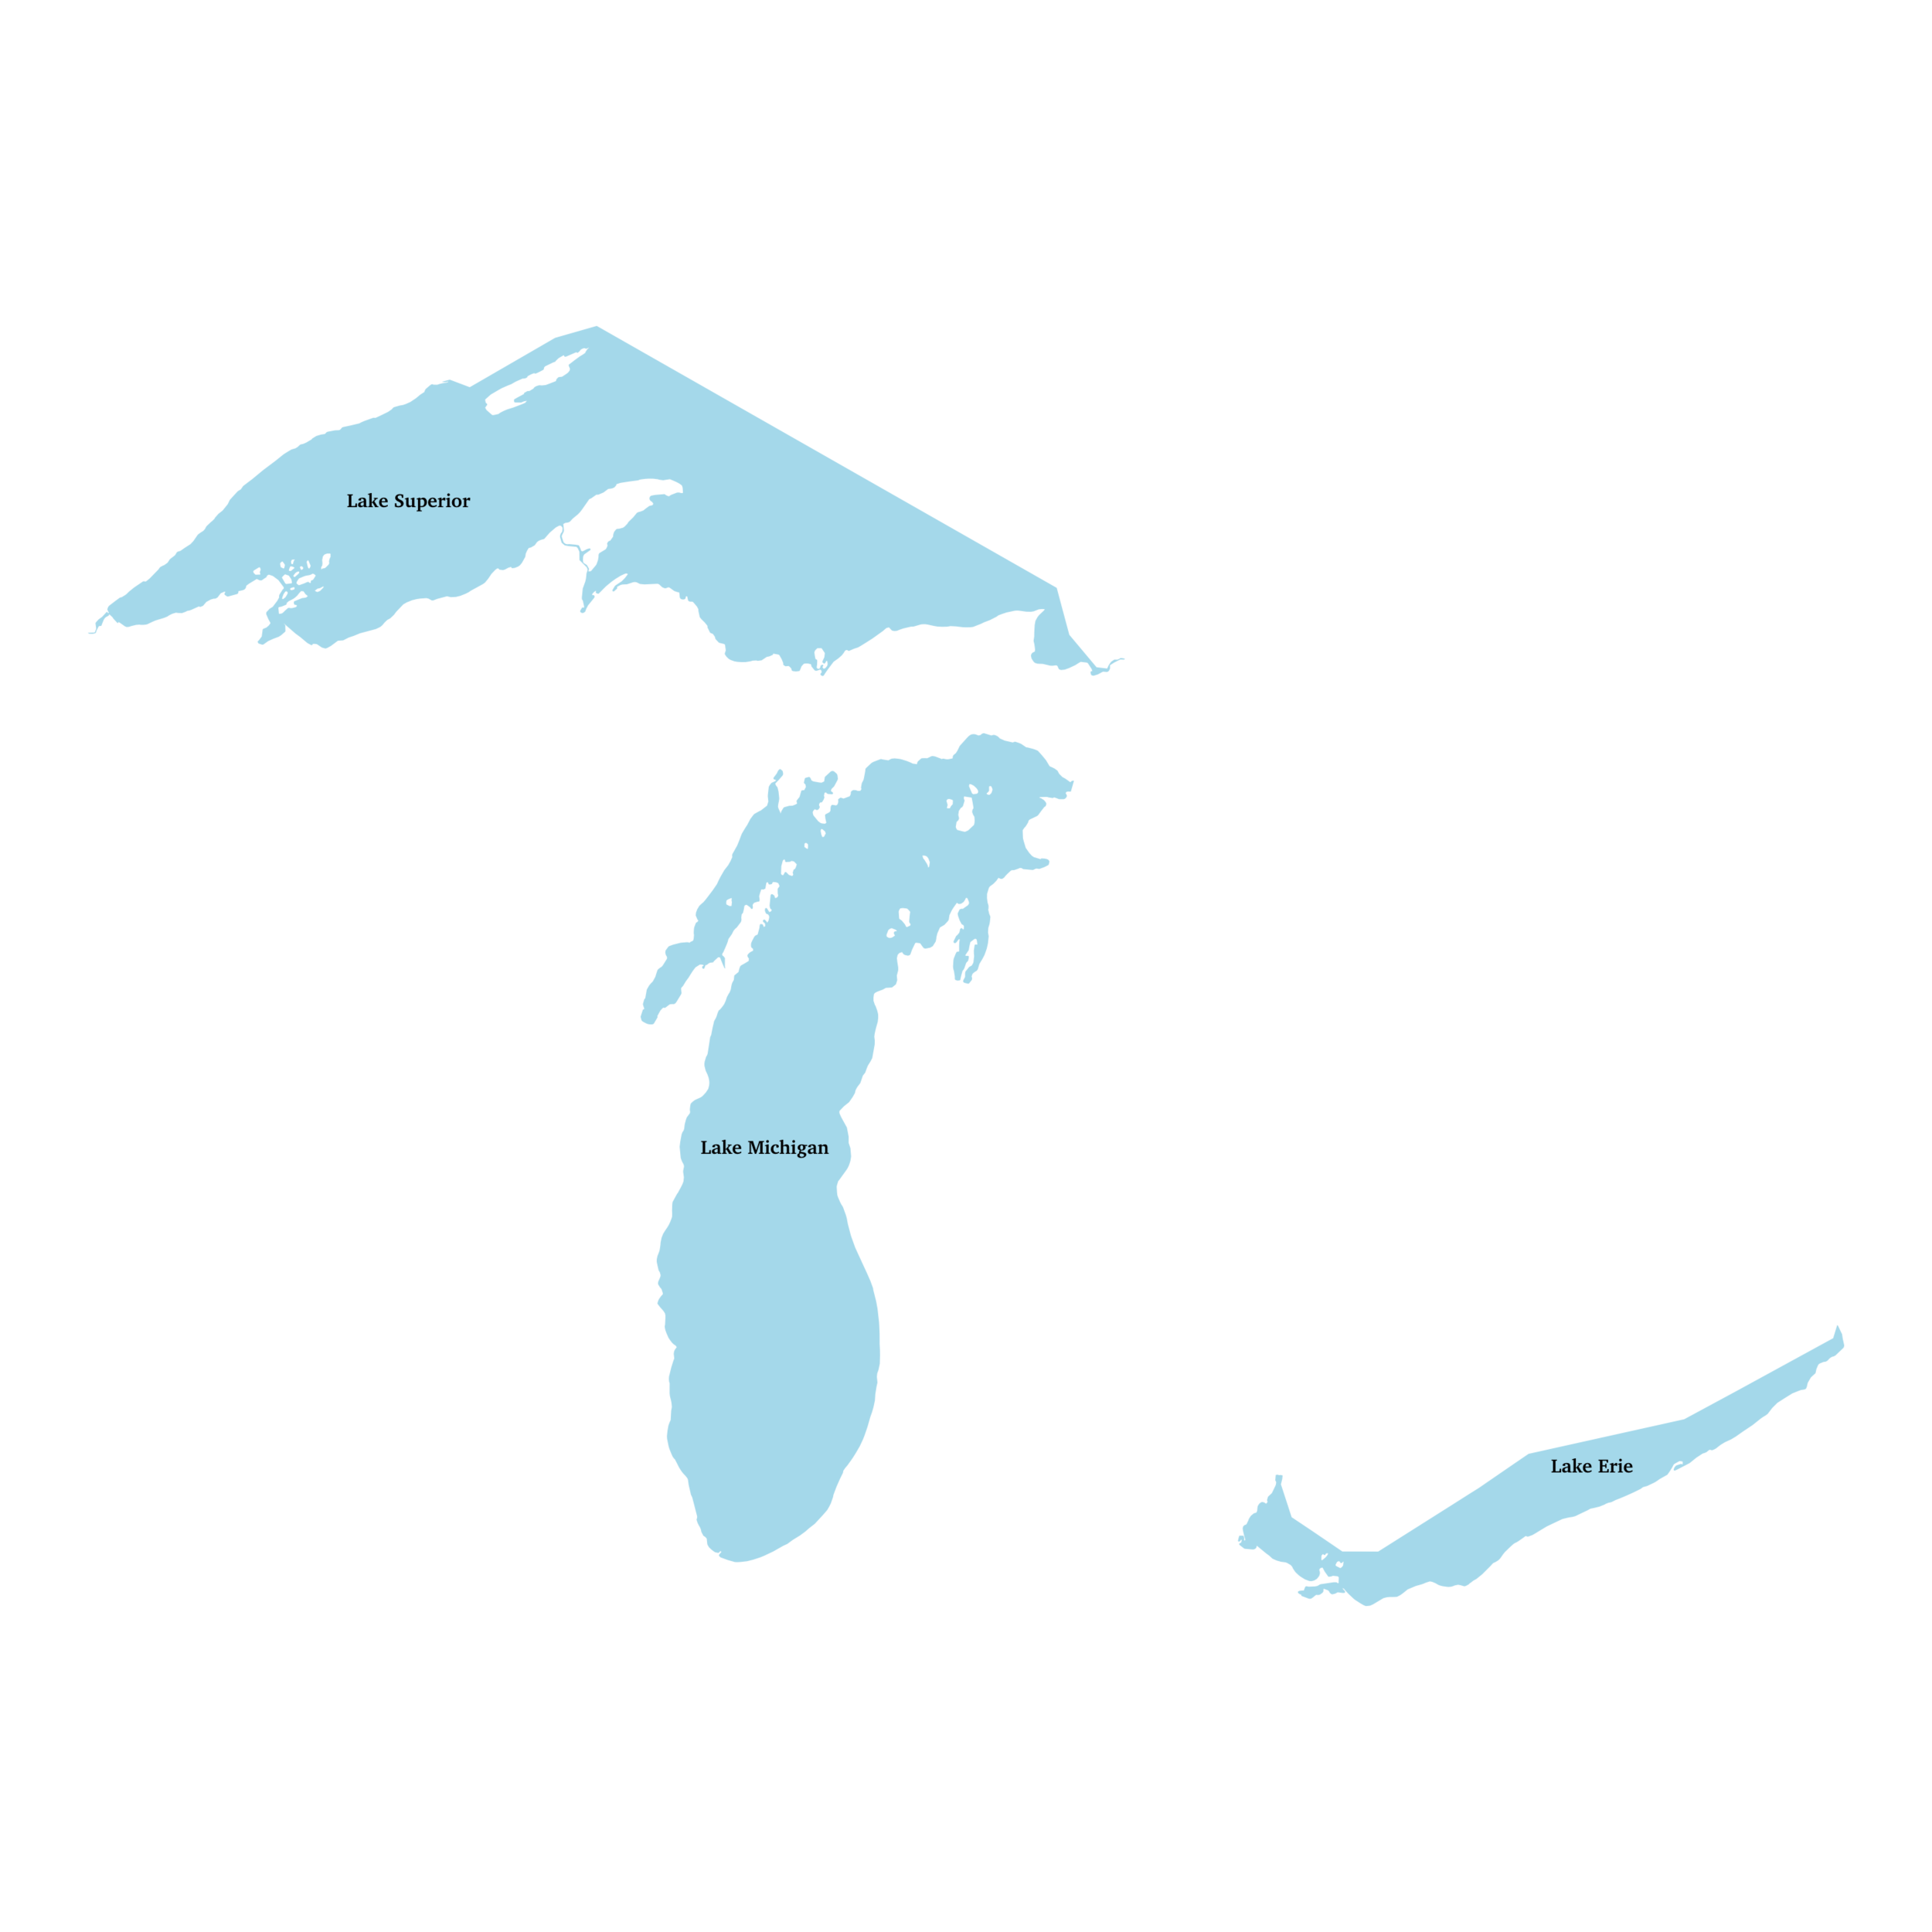
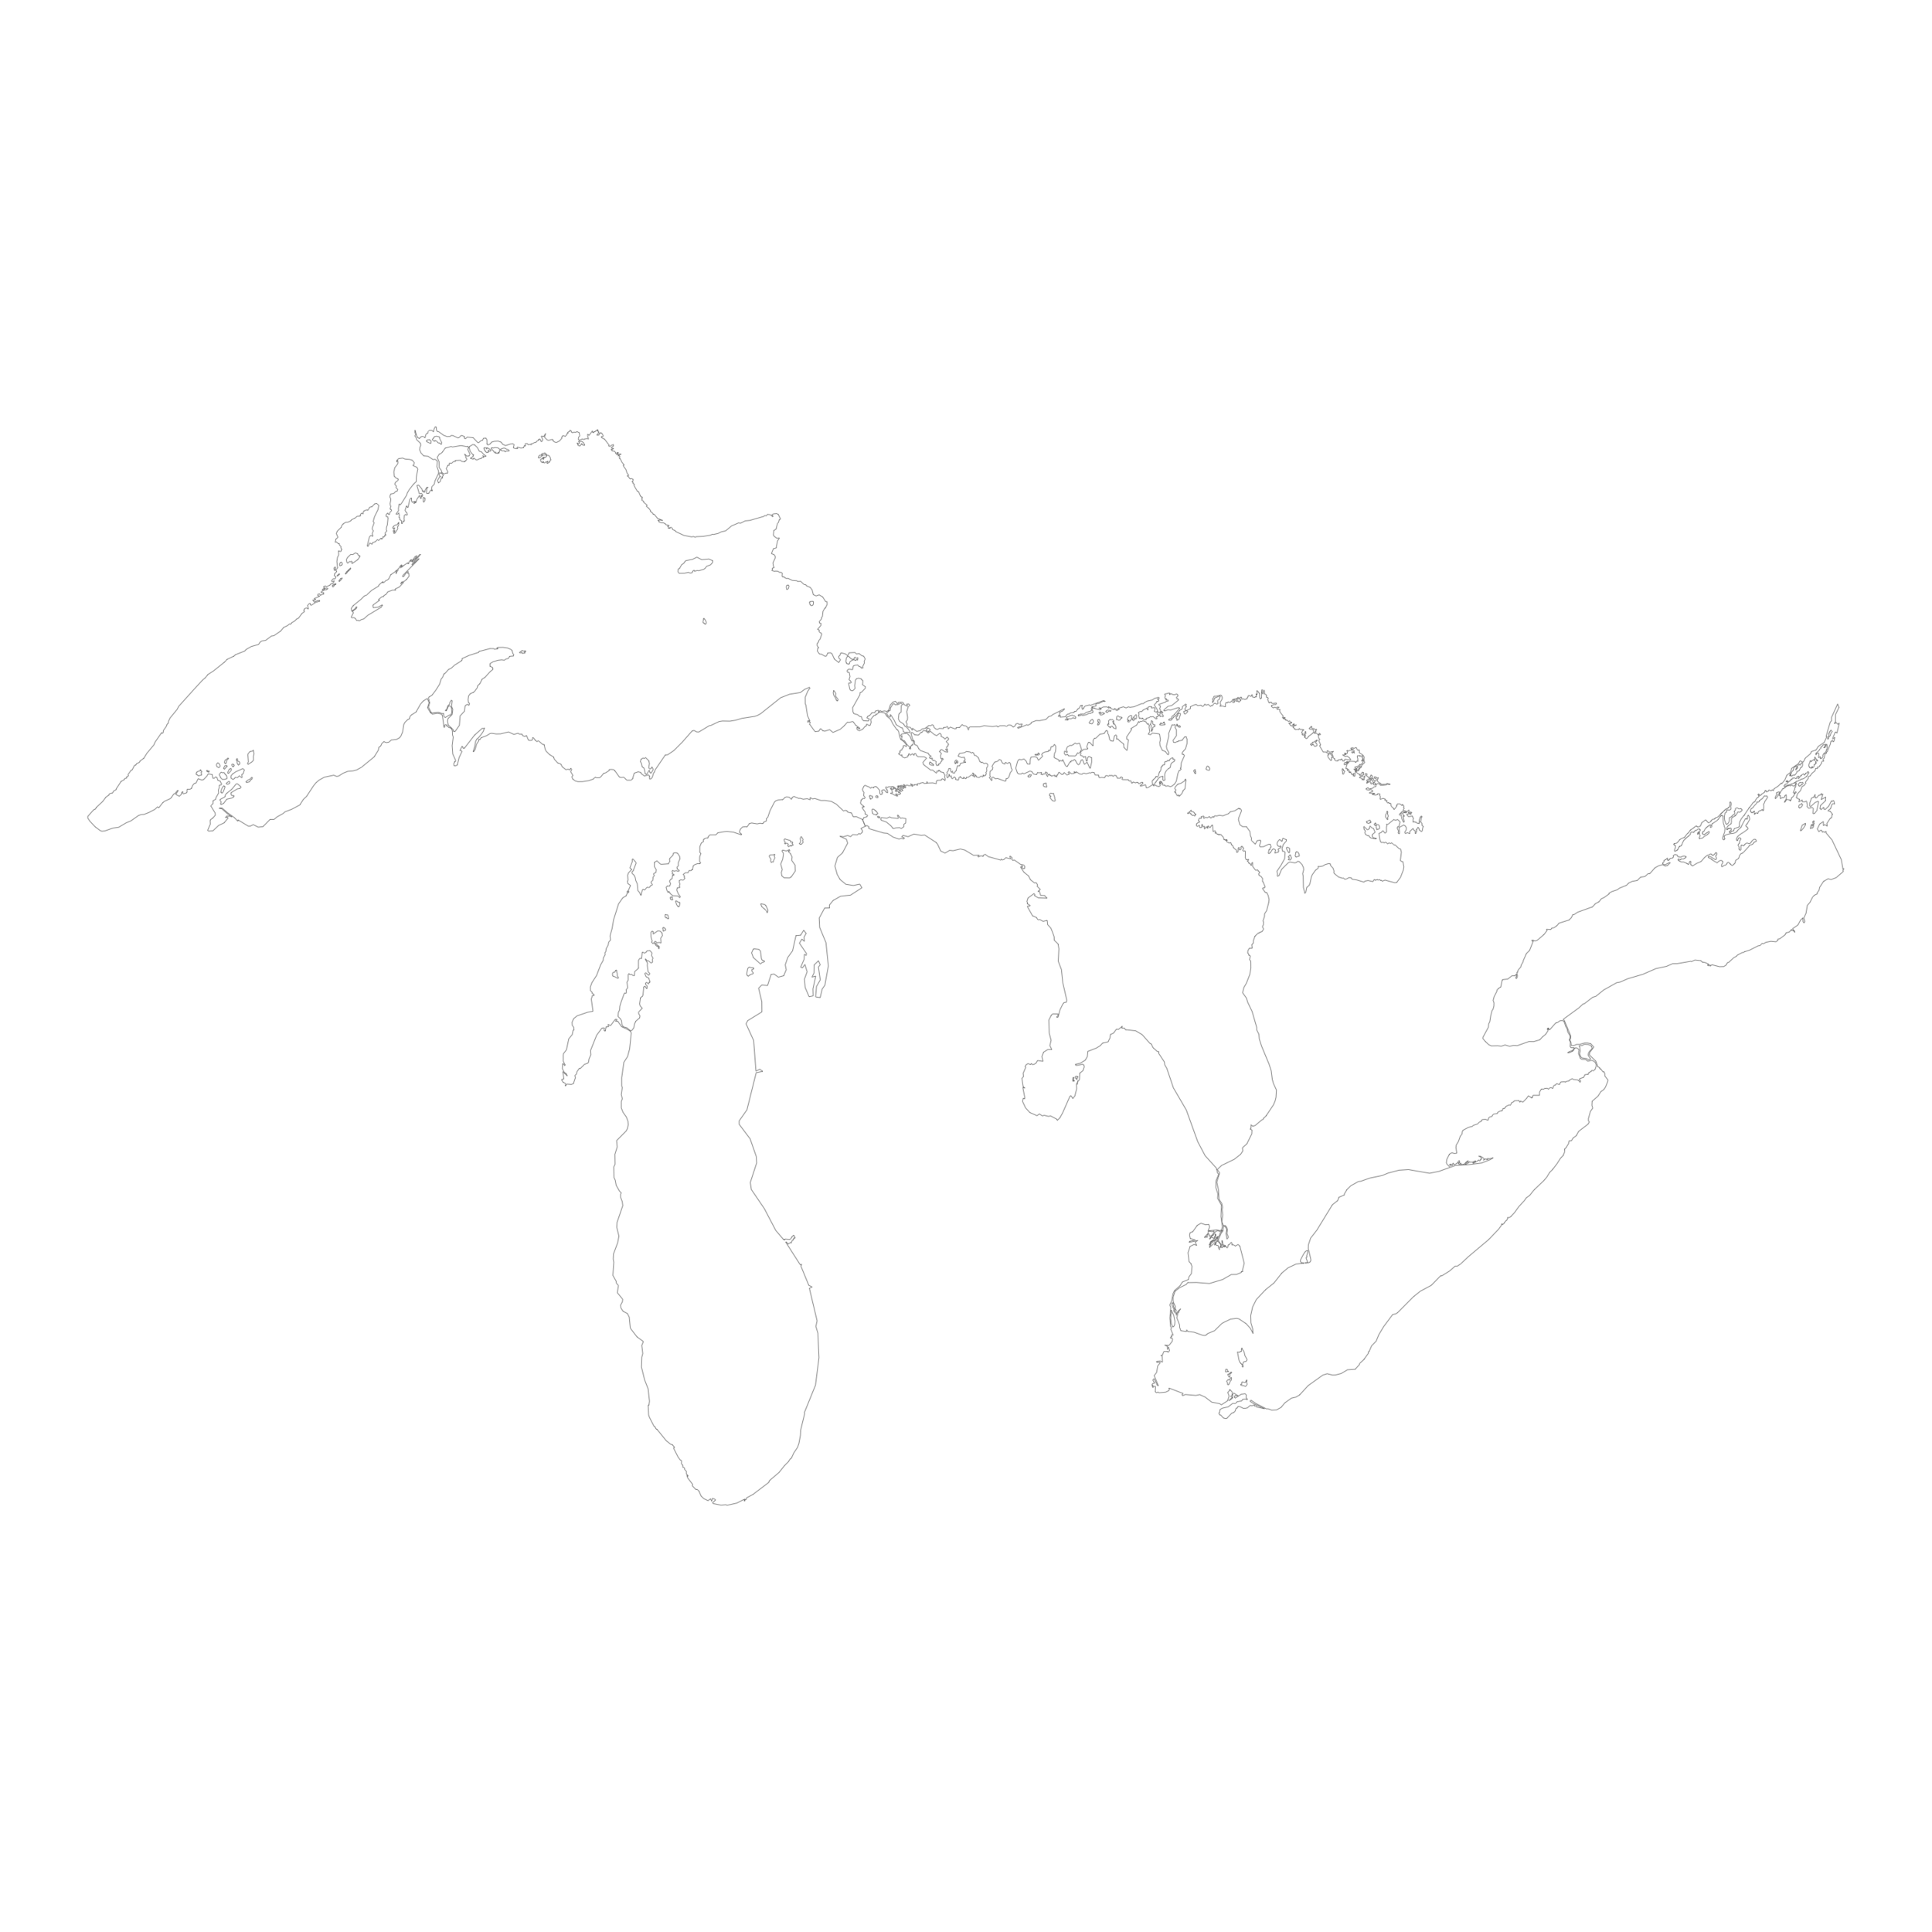
The lakes map is made by two shapefiles, one with all of the Great Lakes and one with just the U.S. parts of the three lakes that the plot was about. Since the two shapefiles were slightly different, I used the first one two times, once as the bottom (gray) and once as the top layer (outline), in order to hide the small differences. The correct way to do this would be to combine the shapefiles and do some masking or cropping but the map is so small that I chose the lazy way.
[View fullsize

 ](_lakes-grey.png)
First shapefile, bottom layer
[View fullsize

 ](_lakes-blue.png)
Second shapefile, middle layer
[View fullsize

 ](_lakes-grey-outline.png)
First shapefile, top layer
[View fullsize

](_lakes.png)
All layers combined
#block-yui_3_17_2_1_1623741243729_21906 .sqs-gallery-block-grid .sqs-gallery-design-grid { margin-right: -5px; } #block-yui_3_17_2_1_1623741243729_21906 .sqs-gallery-block-grid .sqs-gallery-design-grid-slide .margin-wrapper { margin-right: 5px; margin-bottom: 5px; }
The next image shows the position of the legend. I was pleasantly surprised to find that legend.position() worked with values over 1, which meant I could place it above the panels. I couldn’t get the margins right though, so I ended up creating some space between the subtitle and the strip text (facet labels) by making the strip text “boxes” really tall,
The actual process of making the plot was of course a lot messier, you can see the “making of” of it on Twitter (link) and the code for the plot on GitHub (link)