2025/06
February 9, 2025
TidyTuesday & The Simpsons & Lady Gaga & IMDB & TV
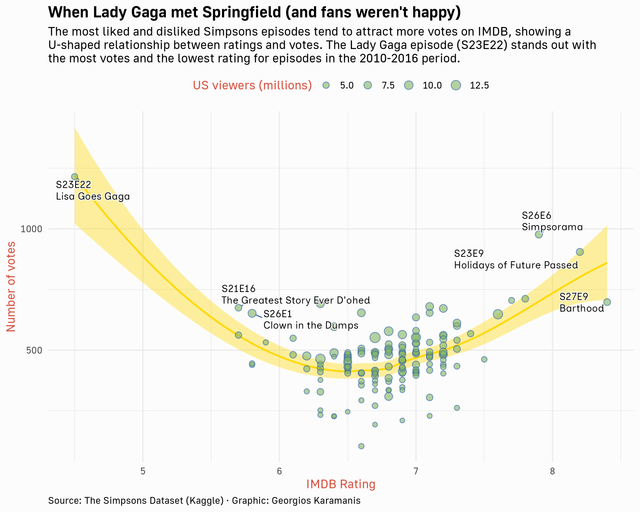 The Simpsons for this week’s #TidyTuesday Code on GitHub
TidyTuesday 2024/35
September 1, 2024
TidyTuesday & Data Visualization & TV & IMDb & Power Rangers
The Simpsons for this week’s #TidyTuesday Code on GitHub
TidyTuesday 2024/35
September 1, 2024
TidyTuesday & Data Visualization & TV & IMDb & Power Rangers
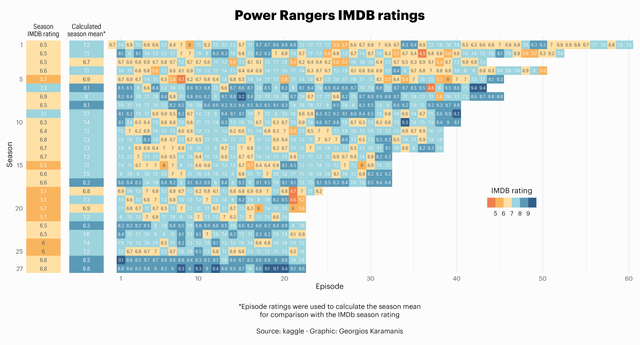 Power Rangers IMDB ratings for this week’s #TidyTuesday Code on GitHub
TidyTuesday 2023/51
December 22, 2023
TV & holidays & IMDB & TidyTuesday & Data Visualization
Power Rangers IMDB ratings for this week’s #TidyTuesday Code on GitHub
TidyTuesday 2023/51
December 22, 2023
TV & holidays & IMDB & TidyTuesday & Data Visualization
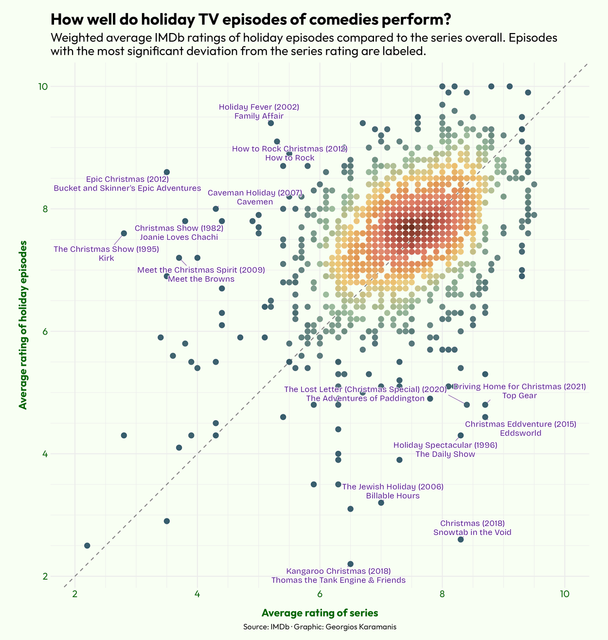 Holiday TV episode ratings for this week’s #TidyTuesday. In general, holiday episodes of comedies seem to be rated similarly to or slightly higher
TidyTuesday 2023/48
December 3, 2023
Doctor Who & TV & TidyTuesday & network & biofabric & Data Visualization
Holiday TV episode ratings for this week’s #TidyTuesday. In general, holiday episodes of comedies seem to be rated similarly to or slightly higher
TidyTuesday 2023/48
December 3, 2023
Doctor Who & TV & TidyTuesday & network & biofabric & Data Visualization
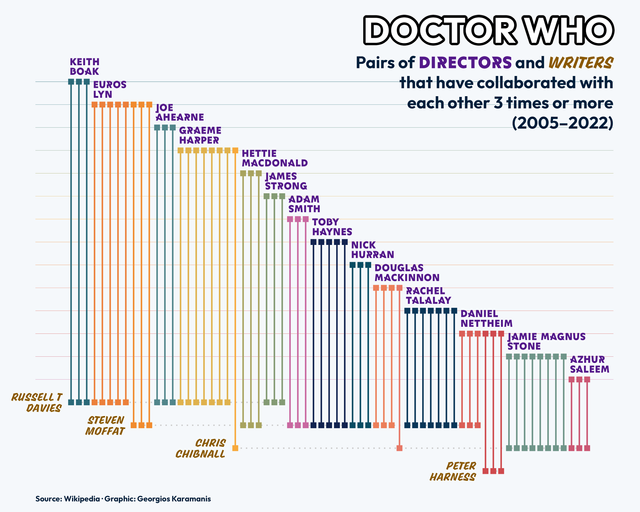 For this week’s #TidyTuesday I made a BioFabric network plot with {ggraph}
TidyTuesday 2023/32
August 13, 2023
TV & TidyTuesday & Data Visualization
For this week’s #TidyTuesday I made a BioFabric network plot with {ggraph}
TidyTuesday 2023/32
August 13, 2023
TV & TidyTuesday & Data Visualization
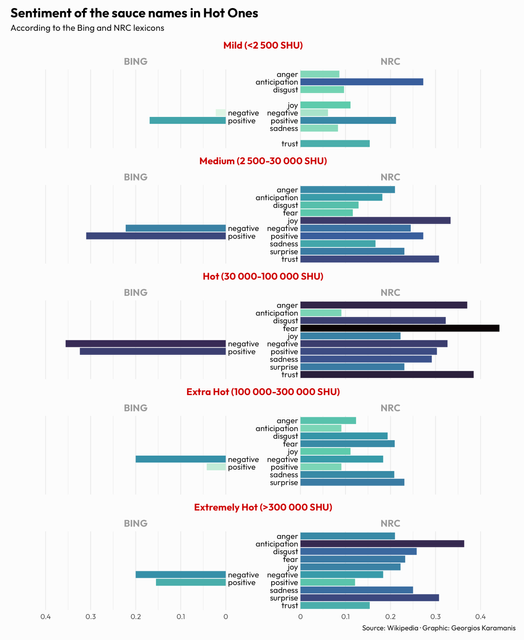 Sentiment of sauce names in Hot Ones for this week’s #TidyTuesday Code on GitHub
MapPromptMonday 2023/4
January 28, 2023
TV & map & Europe & Map & Data Visualization
Sentiment of sauce names in Hot Ones for this week’s #TidyTuesday Code on GitHub
MapPromptMonday 2023/4
January 28, 2023
TV & map & Europe & Map & Data Visualization
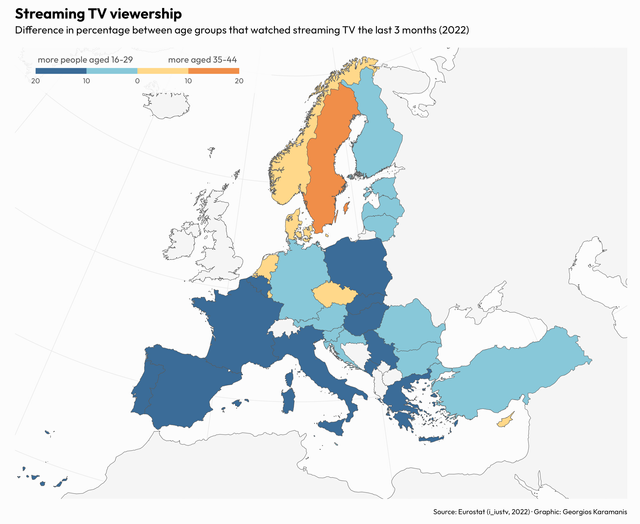 For this week’s #MapPromptMonday I made a map comparing the streaming TV viewership between two age groups in EU countries. Code on GitHub
TidyTuesday 2023/4
January 26, 2023
Alone & TV & waffle & Data Visualization
For this week’s #MapPromptMonday I made a map comparing the streaming TV viewership between two age groups in EU countries. Code on GitHub
TidyTuesday 2023/4
January 26, 2023
Alone & TV & waffle & Data Visualization
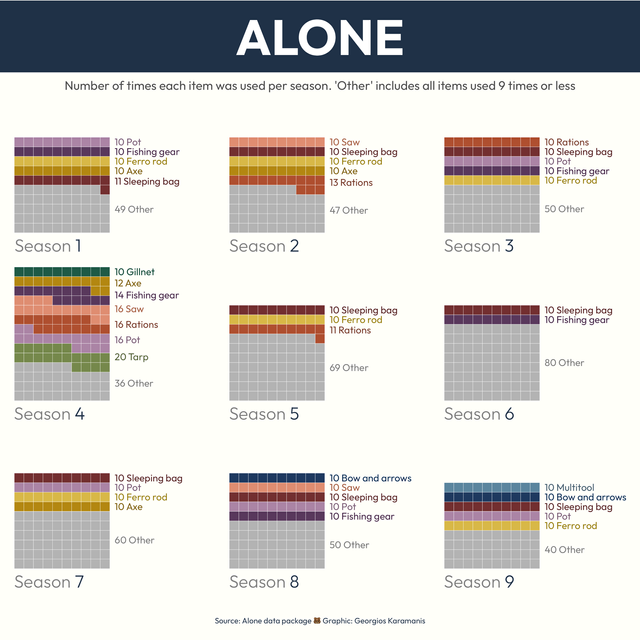 For this week’s #TidyTuesday I made a waffle chart highlighting the most popular items brought by “Alone” participants by season. Code on Github
TidyTuesday 2022/43
October 27, 2022
R & British Bake Off & anchor chart & TV & Data Visualization
For this week’s #TidyTuesday I made a waffle chart highlighting the most popular items brought by “Alone” participants by season. Code on Github
TidyTuesday 2022/43
October 27, 2022
R & British Bake Off & anchor chart & TV & Data Visualization
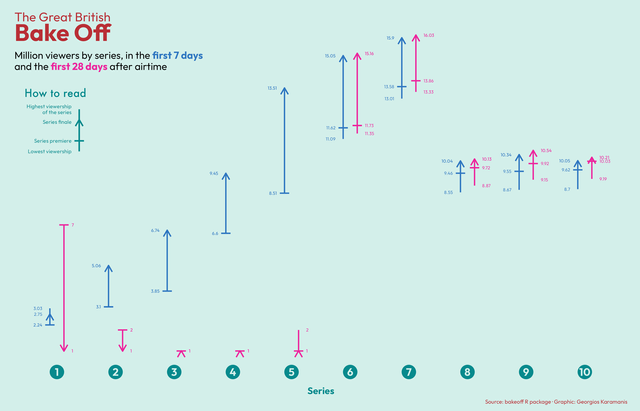 For this week’s #TidyTuesday I made an… anchor chart (as seen in this post). Code on GitHub
TidyTuesday 2022/42
October 23, 2022
TV & Stranger Things & R & TidyTuesday & Data Visualization
For this week’s #TidyTuesday I made an… anchor chart (as seen in this post). Code on GitHub
TidyTuesday 2022/42
October 23, 2022
TV & Stranger Things & R & TidyTuesday & Data Visualization
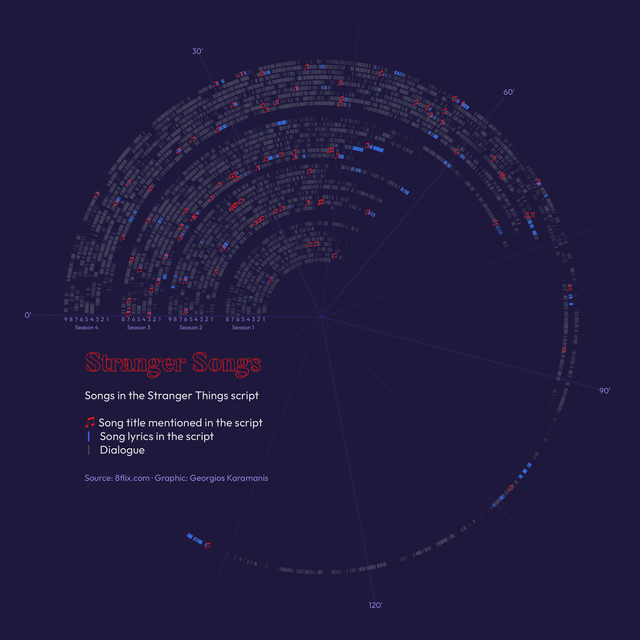 For this week’s #TidyTuesday I plotted the songs of Stranger Things Code on GitHub
TidyTuesday 2021/38
September 26, 2021
plot & Emmys & TV & Data Visualization
For this week’s #TidyTuesday I plotted the songs of Stranger Things Code on GitHub
TidyTuesday 2021/38
September 26, 2021
plot & Emmys & TV & Data Visualization
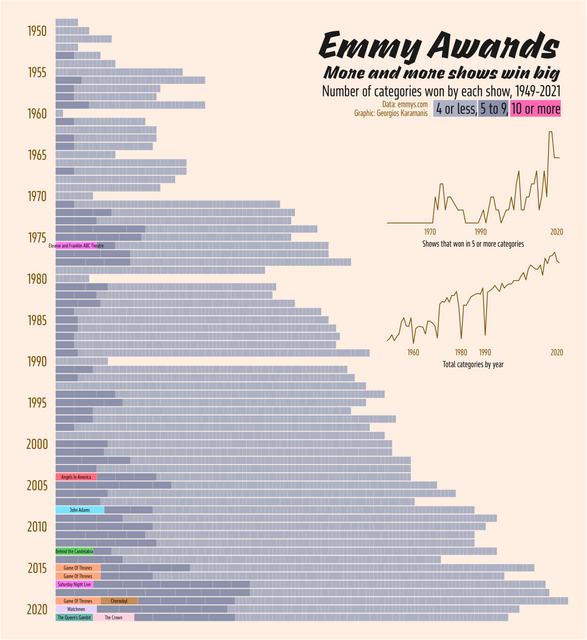 Big Emmy award winners for this week’s #TidyTuesday. The dataset seemed to have missing categories for many years so I merged it with a Kaggle