TidyTuesday 2025/36
September 7, 2025
TidyTuesday & R & Australia & frogs & map
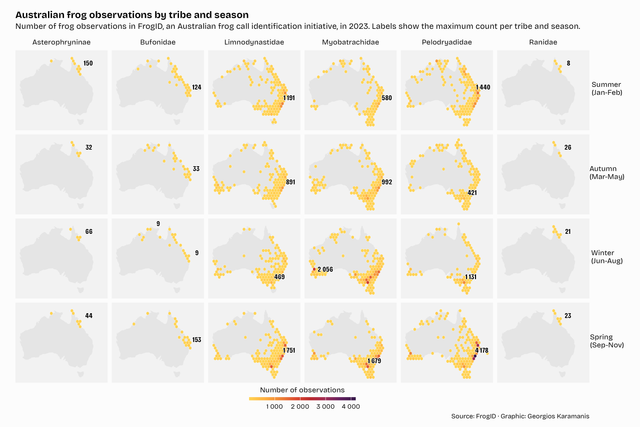 For this week’s #TidyTuesday, hex grid maps showing seasonal shifts in frog observations across Australia Code on GitHub
TidyTuesday 2025/34
August 24, 2025
TidyTuesday & R & map & Munro & Scotland
For this week’s #TidyTuesday, hex grid maps showing seasonal shifts in frog observations across Australia Code on GitHub
TidyTuesday 2025/34
August 24, 2025
TidyTuesday & R & map & Munro & Scotland
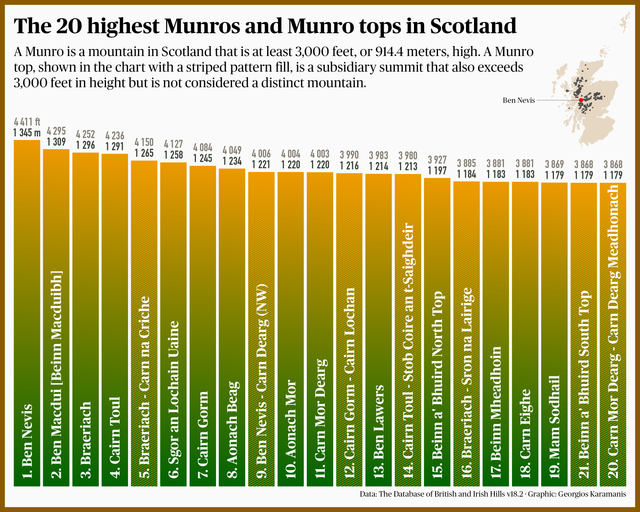 Explore Scotland’s tallest Munros and Munro tops with this week’s #TidyTuesday Code on GitHub
TidyTuesday 2025/33
August 17, 2025
TidyTuesday & Shiny & R & Data Visualization & map & world & climate
Explore Scotland’s tallest Munros and Munro tops with this week’s #TidyTuesday Code on GitHub
TidyTuesday 2025/33
August 17, 2025
TidyTuesday & Shiny & R & Data Visualization & map & world & climate
 Explore extreme weather attribution studies with a Shiny app for this week’s #TidyTuesday App at shinyapps.io Code on GitHub
TidyTuesday 2025/21
May 25, 2025
TidyTuesday & Australia & beaches & water quality & weather & map
Explore extreme weather attribution studies with a Shiny app for this week’s #TidyTuesday App at shinyapps.io Code on GitHub
TidyTuesday 2025/21
May 25, 2025
TidyTuesday & Australia & beaches & water quality & weather & map
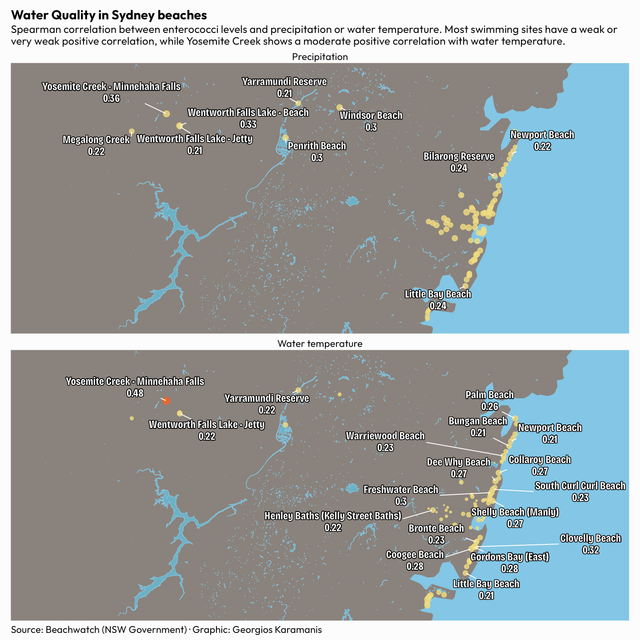 Water Quality in Sydney beaches for this week’s #TidyTuesday Code on GitHub
TidyTuesday 2025/20
May 18, 2025
TidyTuesday & map & volcano & Vesuvius & Italy
Water Quality in Sydney beaches for this week’s #TidyTuesday Code on GitHub
TidyTuesday 2025/20
May 18, 2025
TidyTuesday & map & volcano & Vesuvius & Italy
 Vesuvius seismic activity for this week’s #TidyTuesday Code on GitHub
TidyTuesday 2025/19
May 11, 2025
TidyTuesday & grants & NSF & US & map & parties & science
Vesuvius seismic activity for this week’s #TidyTuesday Code on GitHub
TidyTuesday 2025/19
May 11, 2025
TidyTuesday & grants & NSF & US & map & parties & science
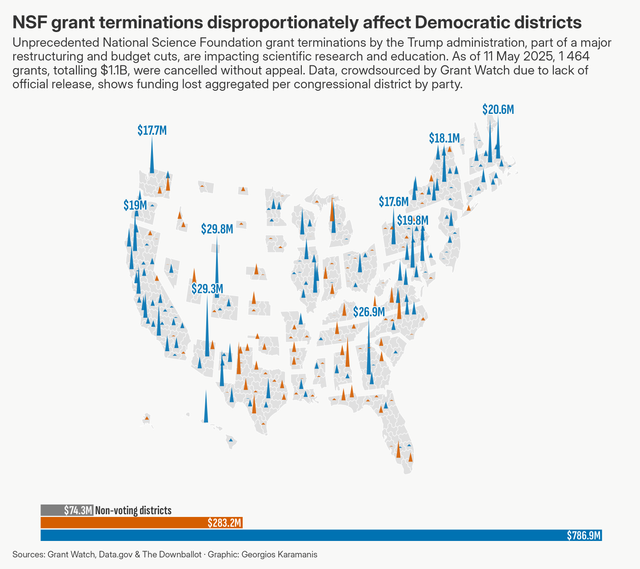 NSF grant cuts for this week’s #TidyTuesday Map by Daniel Donner of The Downballot Code on GitHub
TidyTuesday 2025/15
April 12, 2025
TidyTuesday & data visualization & ED & USA & healthcare & map
NSF grant cuts for this week’s #TidyTuesday Map by Daniel Donner of The Downballot Code on GitHub
TidyTuesday 2025/15
April 12, 2025
TidyTuesday & data visualization & ED & USA & healthcare & map
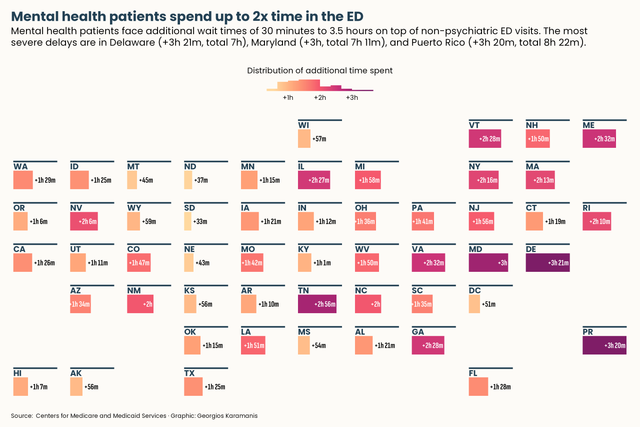 Time spent in ED for this week’s #TidyTuesday. Mental health patients consistently spend more time across all states Code on GitHub
TidyTuesday 2025/08
February 22, 2025
TidyTuesday & US & map & law enforcement & FBI
Time spent in ED for this week’s #TidyTuesday. Mental health patients consistently spend more time across all states Code on GitHub
TidyTuesday 2025/08
February 22, 2025
TidyTuesday & US & map & law enforcement & FBI
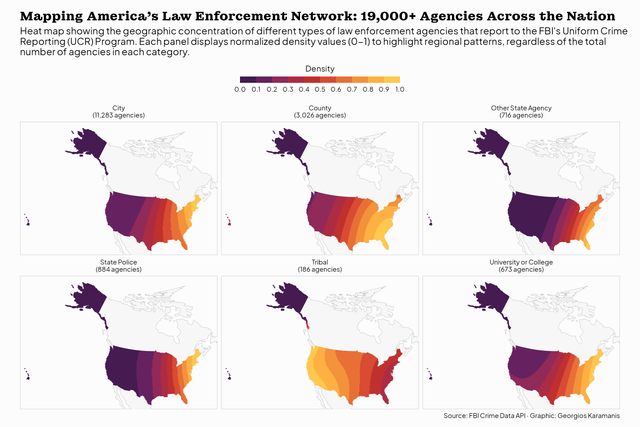 Distribution of different types of US law enforcement agencies for this week’s #TidyTuesday Code on GitHub
30DayMapChallenge 2024
November 30, 2024
30daymapchallenge & map & basketball
Distribution of different types of US law enforcement agencies for this week’s #TidyTuesday Code on GitHub
30DayMapChallenge 2024
November 30, 2024
30daymapchallenge & map & basketball
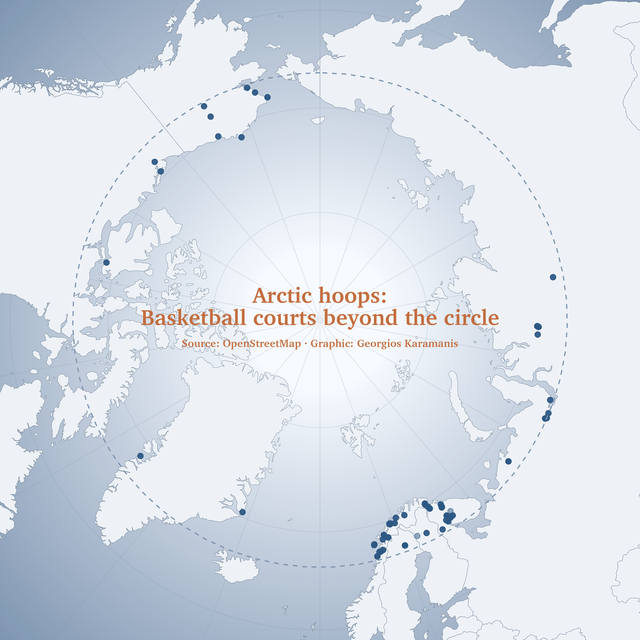 This year’s personal theme has been basketball
TidyTuesday 2024/48
November 29, 2024
data visualization & map & Ukraine & USA & TidyTuesday
This year’s personal theme has been basketball
TidyTuesday 2024/48
November 29, 2024
data visualization & map & Ukraine & USA & TidyTuesday
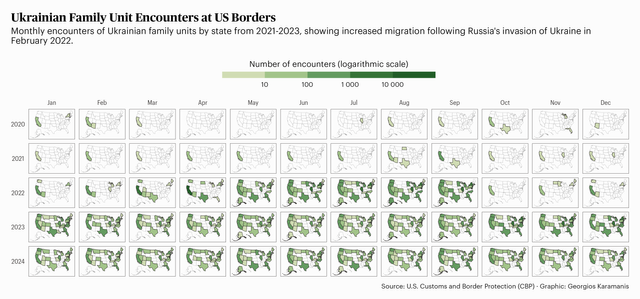 Ukrainian family unit encounters at US borders for this week’s #TidyTuesday Code on GitHub
TidyTuesday 2024/46
November 17, 2024
TidyTuesday & ISO & world & map & letters
Ukrainian family unit encounters at US borders for this week’s #TidyTuesday Code on GitHub
TidyTuesday 2024/46
November 17, 2024
TidyTuesday & ISO & world & map & letters
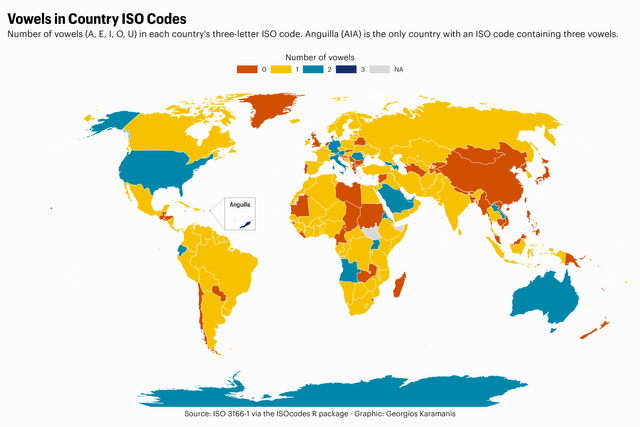 Vowels in ISO country codes for this week’s #TidyTuesday Code on GitHub
TidyTuesday 2024/42
October 15, 2024
TidyTuesday & map & orcas & whales
Vowels in ISO country codes for this week’s #TidyTuesday Code on GitHub
TidyTuesday 2024/42
October 15, 2024
TidyTuesday & map & orcas & whales
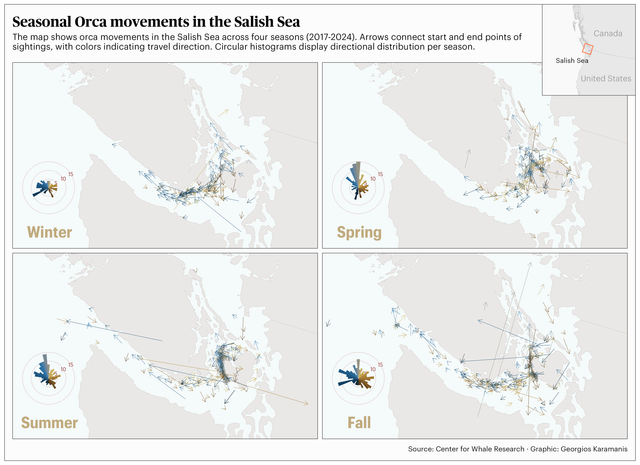 Seasonal Orca movements in the Salish Sea for this week’s #TidyTuesday Code on GitHub
TidyTuesday 2024/41
October 13, 2024
TidyTuesday & US & map & species
Seasonal Orca movements in the Salish Sea for this week’s #TidyTuesday Code on GitHub
TidyTuesday 2024/41
October 13, 2024
TidyTuesday & US & map & species
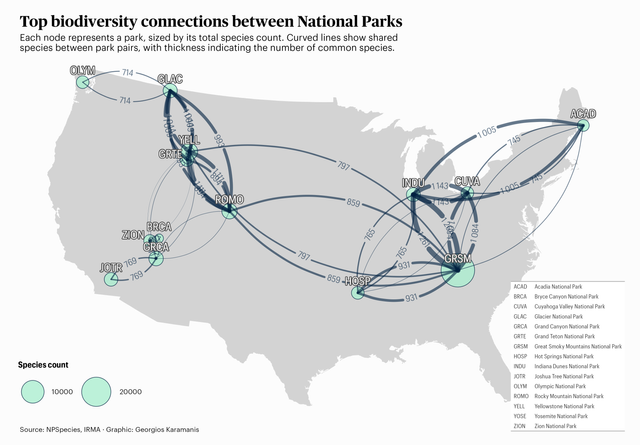 Shared species between US National Parks for this week’s #TidyTuesday Code on GitHub
30DayChartChallenge 2024
April 29, 2024
30DayChartChallenge & Olympic games & women & sports & map & cities & pool & water & AI & injuries & twins & heatmap & metro & Paris & dinosaur & LGBT & Tokyo & Data Visualization
Shared species between US National Parks for this week’s #TidyTuesday Code on GitHub
30DayChartChallenge 2024
April 29, 2024
30DayChartChallenge & Olympic games & women & sports & map & cities & pool & water & AI & injuries & twins & heatmap & metro & Paris & dinosaur & LGBT & Tokyo & Data Visualization
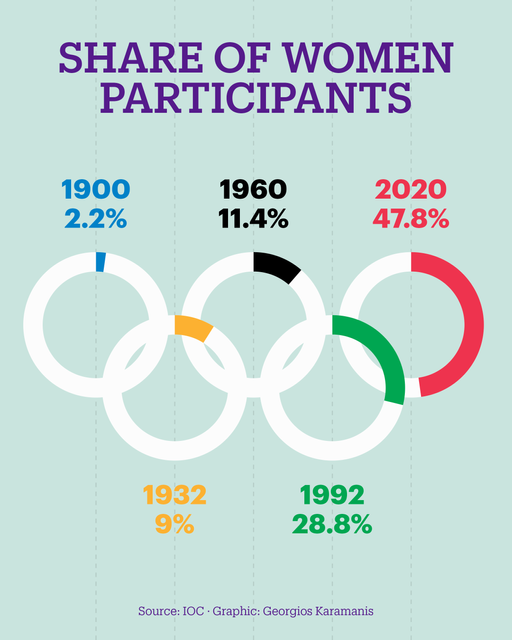 Day 1, part-to-whole Day 2, neo Day 3, makeover Day 4. waffle Day 5, diverging Day 6, OECD Day 7, hazards Day 8, circular Day 9,
TidyTuesday 2024/15
April 8, 2024
map & US & eclipse & TidyTuesday & Data Visualization & Map
Day 1, part-to-whole Day 2, neo Day 3, makeover Day 4. waffle Day 5, diverging Day 6, OECD Day 7, hazards Day 8, circular Day 9,
TidyTuesday 2024/15
April 8, 2024
map & US & eclipse & TidyTuesday & Data Visualization & Map
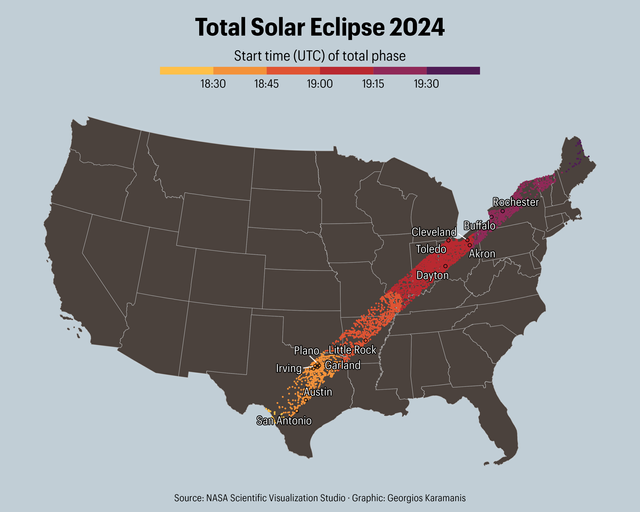 Total eclipse path for this week’s #TidyTuesday Code on GitHub
TidyTuesday 2024/03
January 21, 2024
US & map & TidyTuesday & missing data & Data Visualization & Map
Total eclipse path for this week’s #TidyTuesday Code on GitHub
TidyTuesday 2024/03
January 21, 2024
US & map & TidyTuesday & missing data & Data Visualization & Map
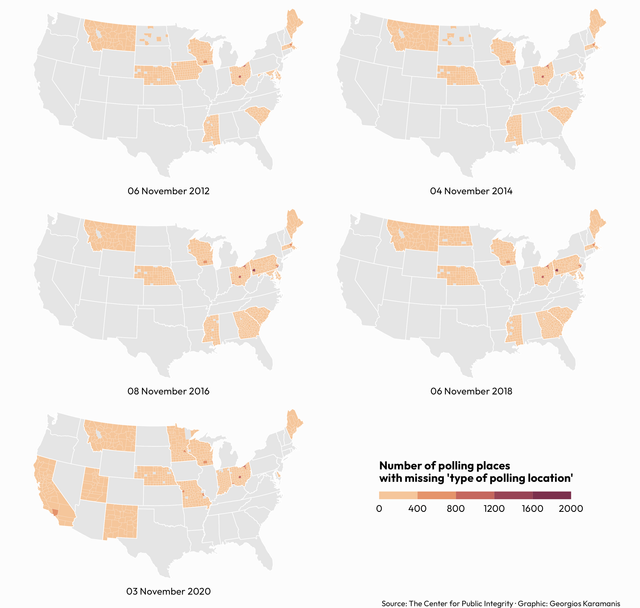 Missing data of US polling places for this week’s #TidyTuesday Code on GitHub
TidyTuesday 2023/49
December 8, 2023
world & map & TidyTuesday & life expectancy & Data Visualization & Map
Missing data of US polling places for this week’s #TidyTuesday Code on GitHub
TidyTuesday 2023/49
December 8, 2023
world & map & TidyTuesday & life expectancy & Data Visualization & Map
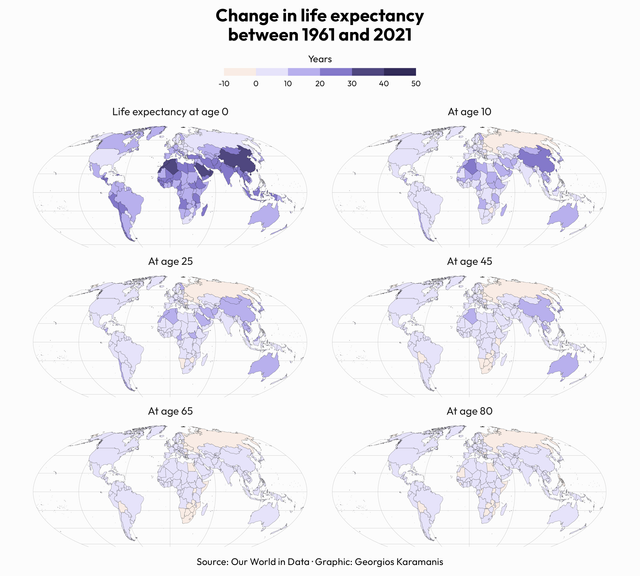 Life expectancy for this week’s #TidyTuesday with data from Our World in Data Code on GitHub
TidyTuesday 2023/47
November 24, 2023
R-Ladies & animation & map & TidyTuesday & Data Visualization & Video
R-Ladies events for this week’s #TidyTuesday. This might be the first animation with {gganimate} I ever share! Code on GitHub Video Block
TidyTuesday 2023/45
November 10, 2023
US & elections & map & Data Visualization & Map
Life expectancy for this week’s #TidyTuesday with data from Our World in Data Code on GitHub
TidyTuesday 2023/47
November 24, 2023
R-Ladies & animation & map & TidyTuesday & Data Visualization & Video
R-Ladies events for this week’s #TidyTuesday. This might be the first animation with {gganimate} I ever share! Code on GitHub Video Block
TidyTuesday 2023/45
November 10, 2023
US & elections & map & Data Visualization & Map
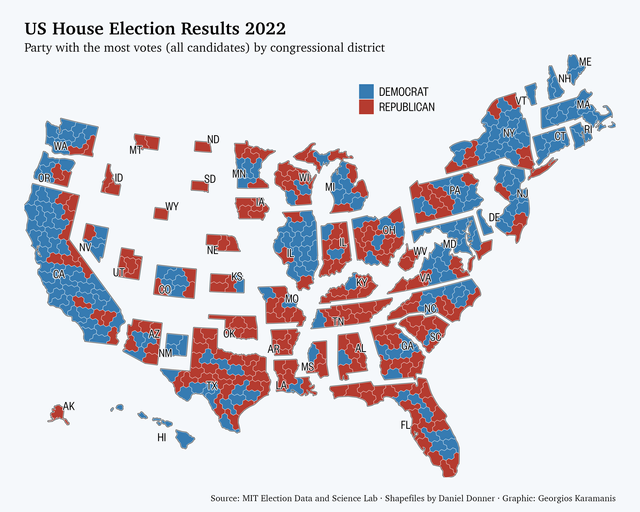 US House elections for this week’s #TidyTuesday. Used v 3.0 of the congressional district hexmap by Daniel Donner available at https://dkel.ec/map
30DayMapChallenge 2023
November 1, 2023
30DayMapChallenge & LGBT & map & world & Data Visualization & Map
US House elections for this week’s #TidyTuesday. Used v 3.0 of the congressional district hexmap by Daniel Donner available at https://dkel.ec/map
30DayMapChallenge 2023
November 1, 2023
30DayMapChallenge & LGBT & map & world & Data Visualization & Map
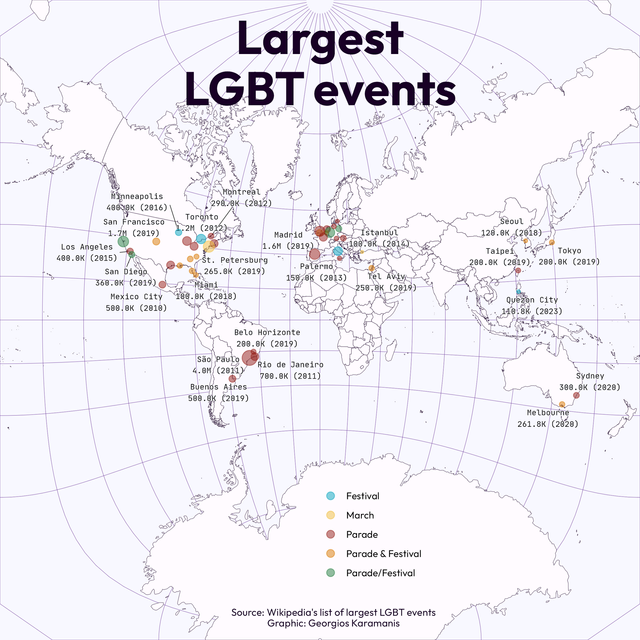 Code on GitHub Day 1, Points Wikipedia’s list of largest #LGBT events. Latest event shown for cities with multiple events. Attendance according to
TidyTuesday 2023/41
October 15, 2023
US & map & TidyTuesday & haunted & halloween & Data Visualization
Code on GitHub Day 1, Points Wikipedia’s list of largest #LGBT events. Latest event shown for cities with multiple events. Attendance according to
TidyTuesday 2023/41
October 15, 2023
US & map & TidyTuesday & haunted & halloween & Data Visualization
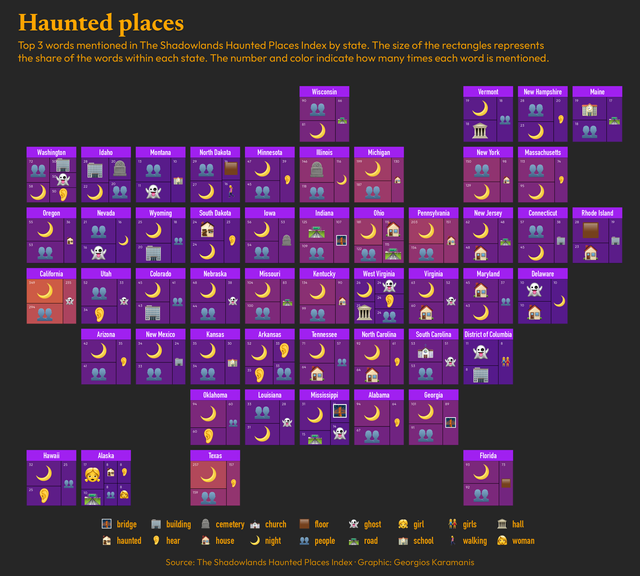 Haunted US places for this week’s #TidyTuesday Code on GitHub
TidyTuesday 2023/37
September 12, 2023
meals & Europe & TidyTuesday & map & Data Visualization
Haunted US places for this week’s #TidyTuesday Code on GitHub
TidyTuesday 2023/37
September 12, 2023
meals & Europe & TidyTuesday & map & Data Visualization
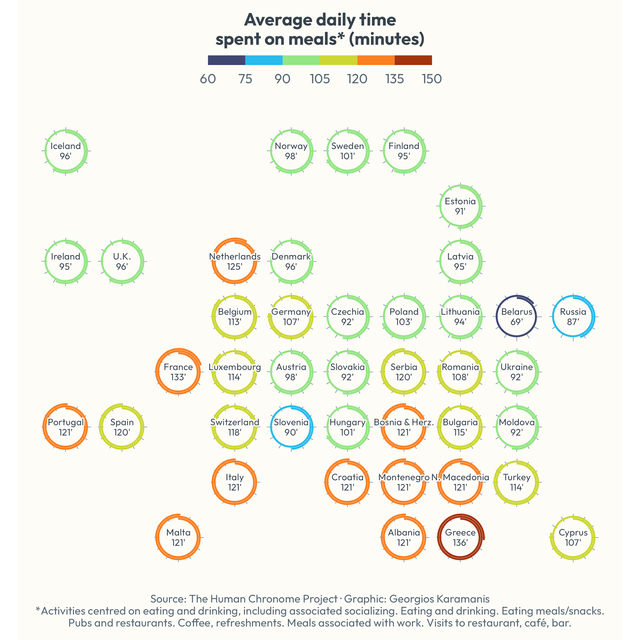 Daily time spent on meals in European countries for this week’s #TidyTuesday Code on GitHub
MapPromptMonday 2023/30
August 14, 2023
Earth & MapPromptMonday & Data Visualization & Map
Daily time spent on meals in European countries for this week’s #TidyTuesday Code on GitHub
MapPromptMonday 2023/30
August 14, 2023
Earth & MapPromptMonday & Data Visualization & Map
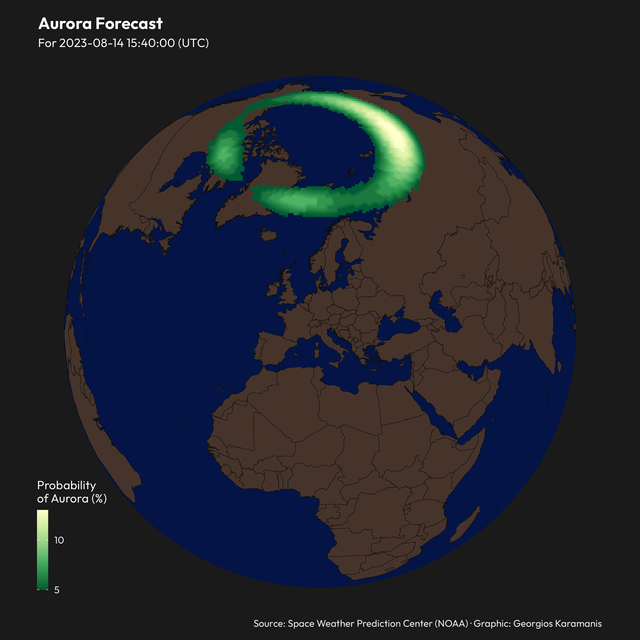 Aurora forecast for the week of July 24-30 of #MapPromptMonday, Natural Wonders Code on GitHub
MapPromptMonday 2023/29
August 6, 2023
chocolate & Europe & map & MapPromptMonday & Data Visualization & Map
Aurora forecast for the week of July 24-30 of #MapPromptMonday, Natural Wonders Code on GitHub
MapPromptMonday 2023/29
August 6, 2023
chocolate & Europe & map & MapPromptMonday & Data Visualization & Map
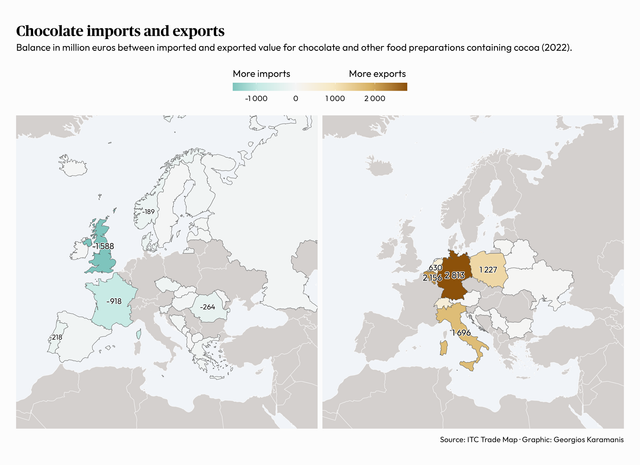 Chocolate trade balance for the week of July 17-23 of #MapPromptMonday, Desserts Code on GitHub
TidyTuesday 2023/31
August 2, 2023
US & states & distance & cities & TidyTuesday & map & Data Visualization & Map
Chocolate trade balance for the week of July 17-23 of #MapPromptMonday, Desserts Code on GitHub
TidyTuesday 2023/31
August 2, 2023
US & states & distance & cities & TidyTuesday & map & Data Visualization & Map
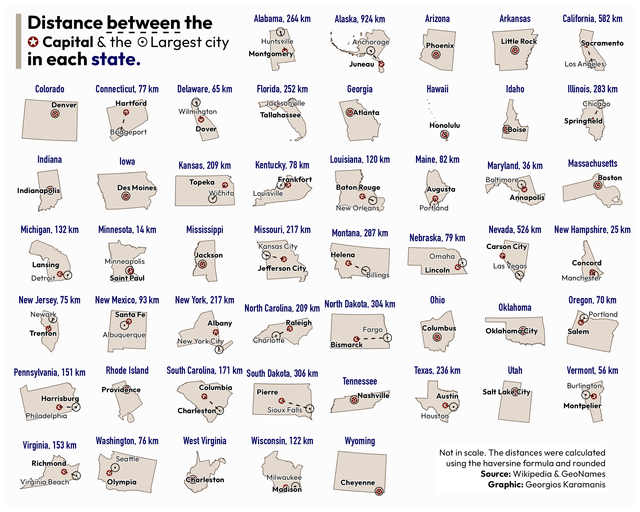 Distance between the capital and the largest city in each state for this week’s #TidyTuesday Code on GitHub
MapPromptMonday 2023/27
July 30, 2023
ice & Europe & MapPromptMonday & Data Visualization & Map
Distance between the capital and the largest city in each state for this week’s #TidyTuesday Code on GitHub
MapPromptMonday 2023/27
July 30, 2023
ice & Europe & MapPromptMonday & Data Visualization & Map
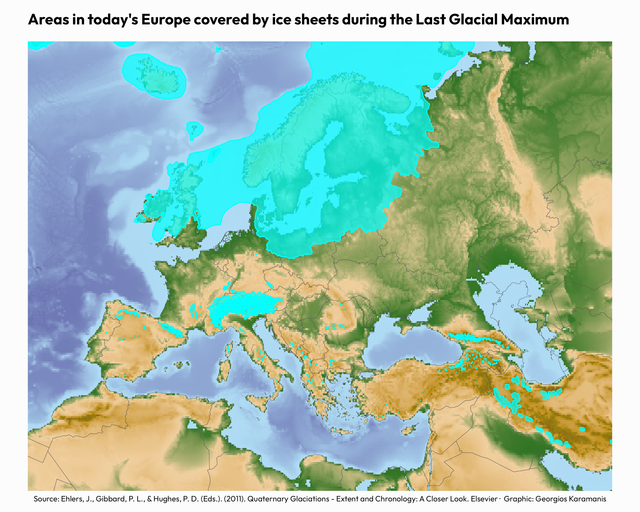 Areas in today’s Europe covered by ice during LGM for the week of 3-10 July of #MapPromptMonday, Snow or Ice Shapefiles for the ice sheets Code on
MapPromptMonday 2023/26
July 23, 2023
cherry & map & europe & MapPromptMonday & Data Visualization & Map
Areas in today’s Europe covered by ice during LGM for the week of 3-10 July of #MapPromptMonday, Snow or Ice Shapefiles for the ice sheets Code on
MapPromptMonday 2023/26
July 23, 2023
cherry & map & europe & MapPromptMonday & Data Visualization & Map
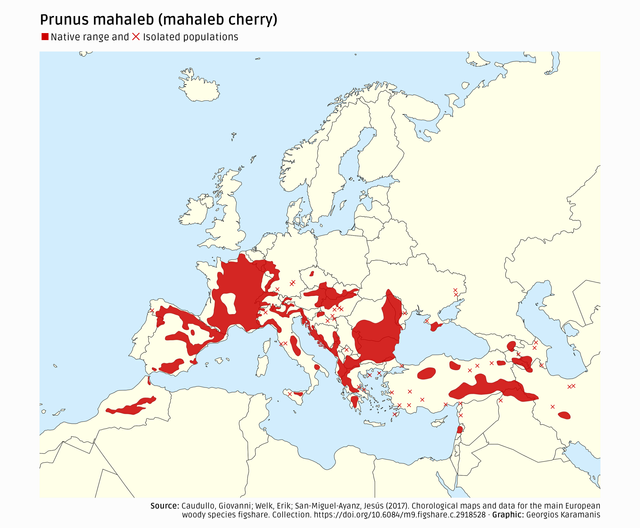 Distribution of the mahaleb cherry for the week of 26 June-2 July of #MapPromptMonday, Plants Code on GitHub
TidyTuesday 2023/27
July 9, 2023
US & map & TidyTuesday & historical markers & Data Visualization & Map
Distribution of the mahaleb cherry for the week of 26 June-2 July of #MapPromptMonday, Plants Code on GitHub
TidyTuesday 2023/27
July 9, 2023
US & map & TidyTuesday & historical markers & Data Visualization & Map
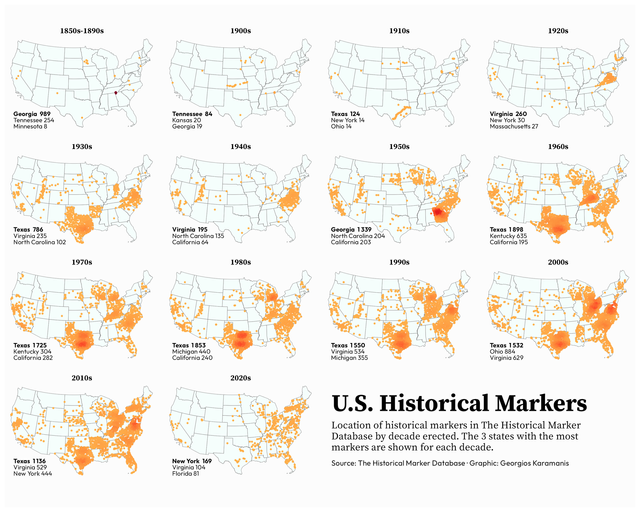 US historical markers for this week’s #TidyTuesday Code on GitHub
MapPromptMonday 2023/25
July 8, 2023
sunset & solstice & Europe & MapPromptMonday & Data Visualization & Map
US historical markers for this week’s #TidyTuesday Code on GitHub
MapPromptMonday 2023/25
July 8, 2023
sunset & solstice & Europe & MapPromptMonday & Data Visualization & Map
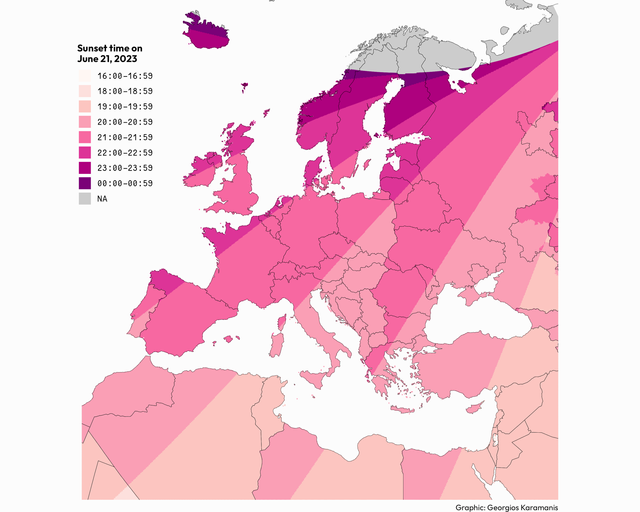 Sunset times on June 21, 2023 for the week of 19-25 June of #MapPromptMonday, Solstice/Seasons Original idea by Brian Brettschneider Code on GitHub
TidyTuesday 2023/26
June 30, 2023
US & beach & places & map & TidyTuesday & Data Visualization
Sunset times on June 21, 2023 for the week of 19-25 June of #MapPromptMonday, Solstice/Seasons Original idea by Brian Brettschneider Code on GitHub
TidyTuesday 2023/26
June 30, 2023
US & beach & places & map & TidyTuesday & Data Visualization
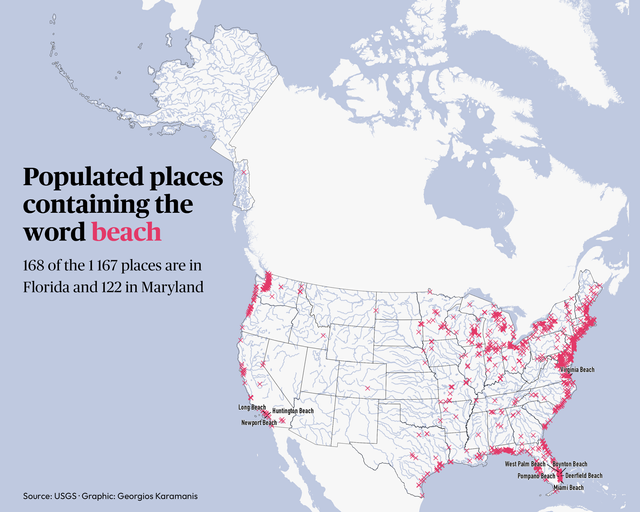 For this week’s #TidyTuesday I plotted the populated places in the US with the word ‘beach’ in their name Code on GitHub
TidyTuesday 2023/25
June 25, 2023
UFO & world & map & TidyTuesday & Data Visualization
For this week’s #TidyTuesday I plotted the populated places in the US with the word ‘beach’ in their name Code on GitHub
TidyTuesday 2023/25
June 25, 2023
UFO & world & map & TidyTuesday & Data Visualization
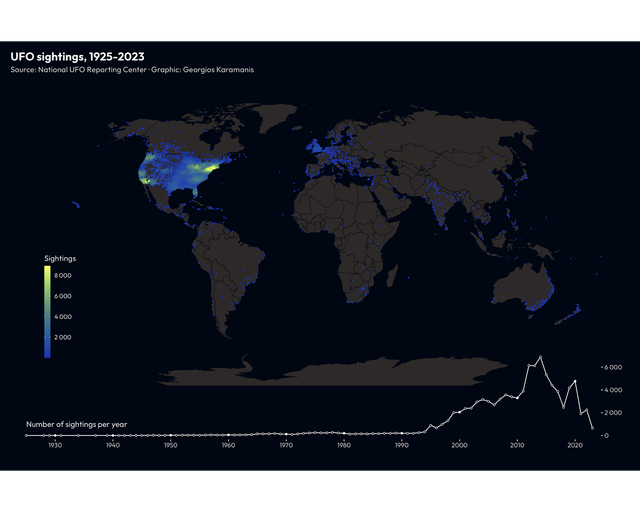 Reported UFO sightings for this week’s #TidyTuesday Code on GitHub
MapPromptMonday 2023/24
June 17, 2023
sea & ice & Arctic & MapPromptMonday & Data Visualization & Map
Reported UFO sightings for this week’s #TidyTuesday Code on GitHub
MapPromptMonday 2023/24
June 17, 2023
sea & ice & Arctic & MapPromptMonday & Data Visualization & Map
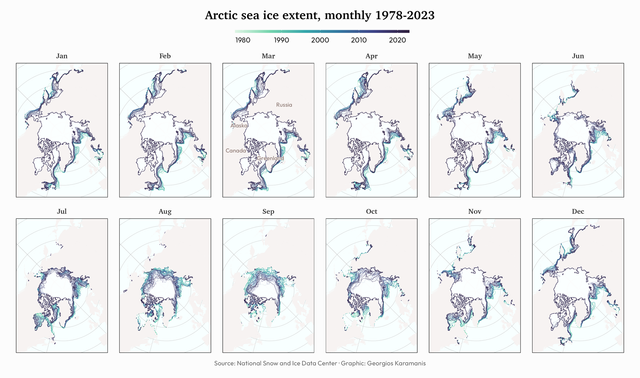 Arctic sea ice extent for this week’s #MapPromptMonday, Arctic or Antarctic Code on GitHub
TidyTuesday 2023/23
June 11, 2023
Europe & energy & electricity & map & TidyTuesday & Data Visualization
Arctic sea ice extent for this week’s #MapPromptMonday, Arctic or Antarctic Code on GitHub
TidyTuesday 2023/23
June 11, 2023
Europe & energy & electricity & map & TidyTuesday & Data Visualization
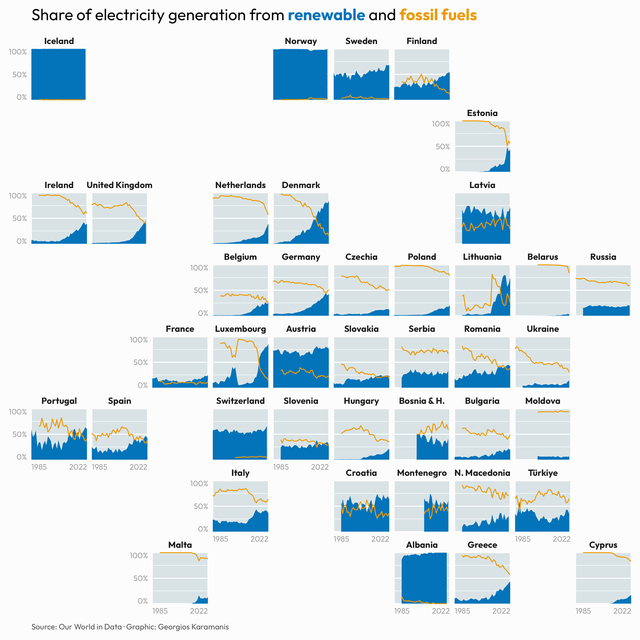 Share of electricity generation in Europe for this week’s #TidyTuesday Code on GitHub
MapPromptMonday 2023/23
June 8, 2023
Europe & police & phone number & MapPromptMonday & map & Data Visualization & Map
Share of electricity generation in Europe for this week’s #TidyTuesday Code on GitHub
MapPromptMonday 2023/23
June 8, 2023
Europe & police & phone number & MapPromptMonday & map & Data Visualization & Map
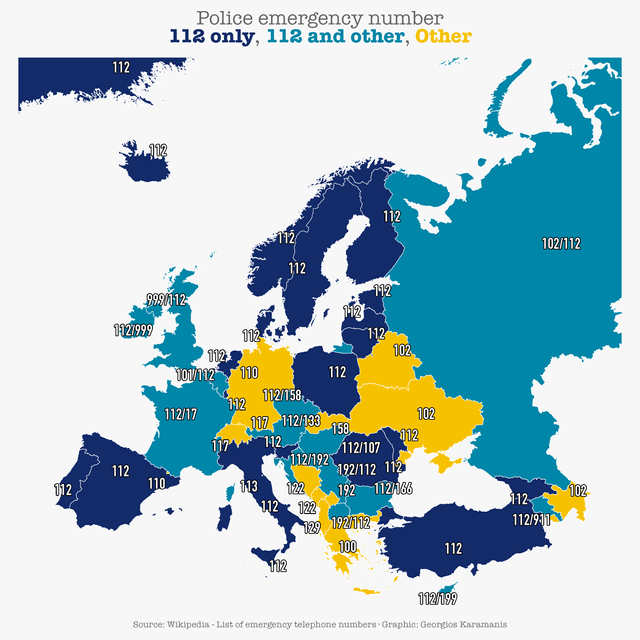 Europe’s police emergency numbers for this week’s #MapPromptMonday, Safety Code on GitHub Source is Wikipedia’s List of emergency telephone numbers
MapPromptMonday 2023/22
June 4, 2023
water & sea & Europe & MapPromptMonday & climate & Data Visualization & Map
Europe’s police emergency numbers for this week’s #MapPromptMonday, Safety Code on GitHub Source is Wikipedia’s List of emergency telephone numbers
MapPromptMonday 2023/22
June 4, 2023
water & sea & Europe & MapPromptMonday & climate & Data Visualization & Map
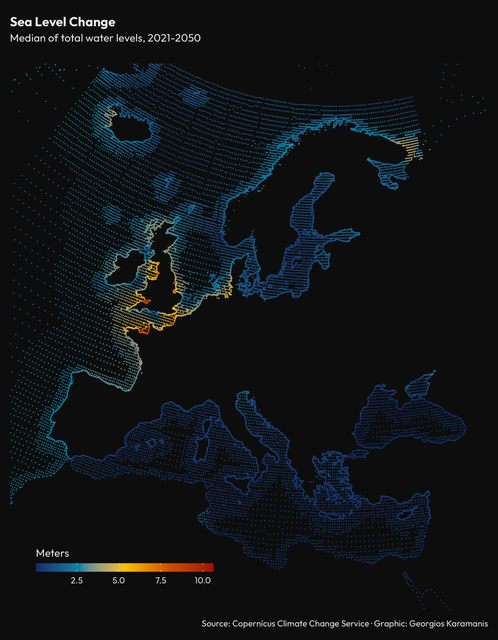 Sea level change for this week’s #MapPromptMonday, Cimate Change Vulnerability Code on GitHub Data source
MapPromptMonday 2023/21
May 29, 2023
Europe & map & MapPromptMonday & art & triangulation & Data Visualization & Map
Sea level change for this week’s #MapPromptMonday, Cimate Change Vulnerability Code on GitHub Data source
MapPromptMonday 2023/21
May 29, 2023
Europe & map & MapPromptMonday & art & triangulation & Data Visualization & Map
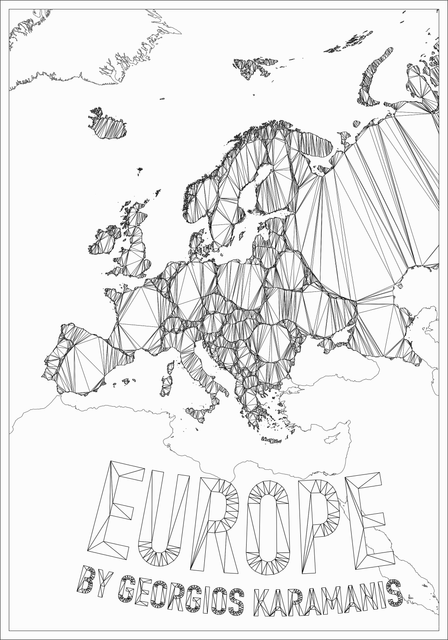 Europe with constrained triangulation for last week’s #MapPromptMonday, Book Cover Code on GitHub
MapPromptMonday 2023/20
May 28, 2023
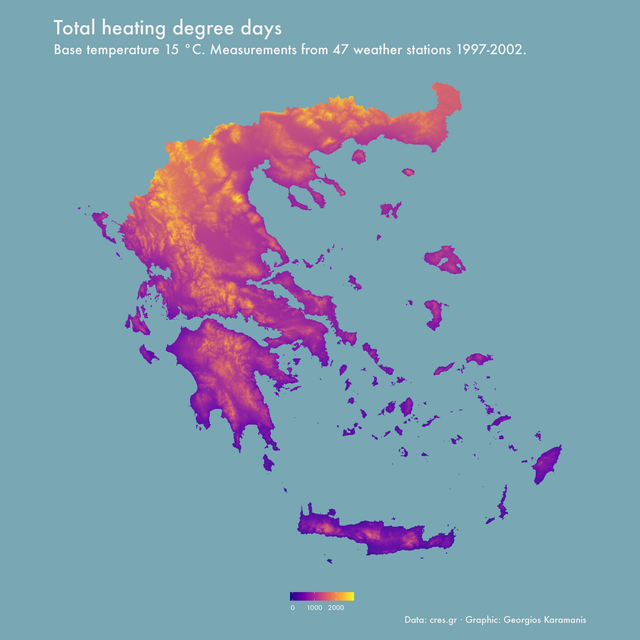
Europe & degree days & MapPromptMonday & map & Data Visualization & Map
Europe with constrained triangulation for last week’s #MapPromptMonday, Book Cover Code on GitHub
MapPromptMonday 2023/20
May 28, 2023
Europe & degree days & MapPromptMonday & map & Data Visualization & Map
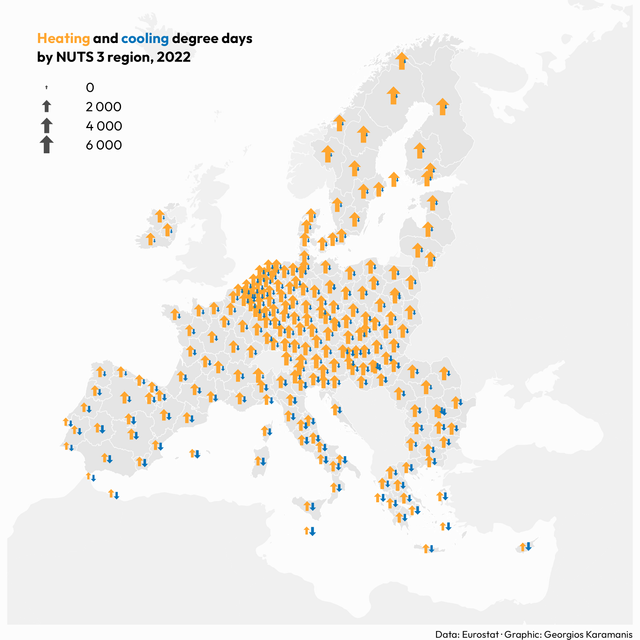 Week of May 15-21 of #MapPromptMonday, Proportional Symbols Code on GitHub
MapPromptMonday 2023/19
May 19, 2023
globe & map & MapPromptMonday & Thessaloniki & Uppsala & cities & Data Visualization & Map
Week of May 15-21 of #MapPromptMonday, Proportional Symbols Code on GitHub
MapPromptMonday 2023/19
May 19, 2023
globe & map & MapPromptMonday & Thessaloniki & Uppsala & cities & Data Visualization & Map
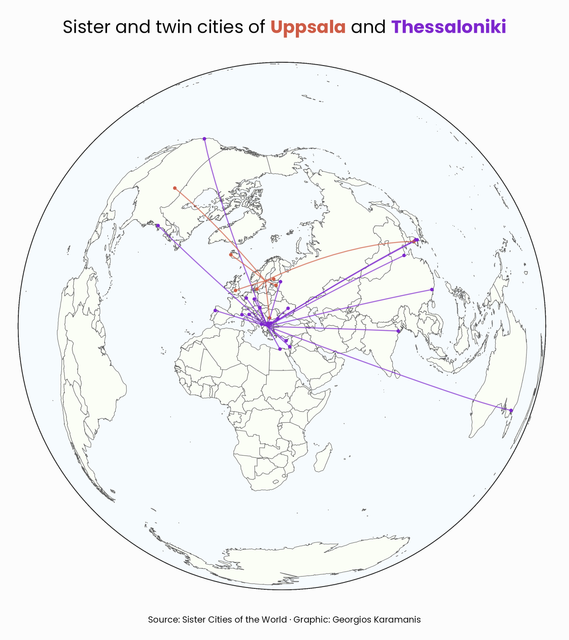 Week 8-14 May of #MapPromptMonday, Home Sister and twin cities of Thessaloniki and Uppsala, the two cities I call home Code on GitHub
MapPromptMonday 2023/18
May 13, 2023
map & urbanisation & Europe & Africa & MapPromptMonday & Data Visualization & Map
Week 8-14 May of #MapPromptMonday, Home Sister and twin cities of Thessaloniki and Uppsala, the two cities I call home Code on GitHub
MapPromptMonday 2023/18
May 13, 2023
map & urbanisation & Europe & Africa & MapPromptMonday & Data Visualization & Map
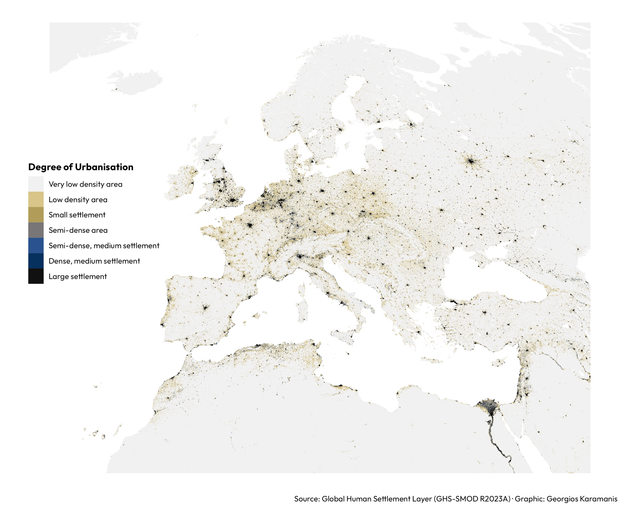 Degree of urbanisation in Europe and North Africa for the week 1-7 May of #MapPromptMonday, Urban vs. Rural Code on GitHub
TidyTuesday 2023/19
May 12, 2023
US & map & childcare & TidyTuesday & Map & Data Visualization
Degree of urbanisation in Europe and North Africa for the week 1-7 May of #MapPromptMonday, Urban vs. Rural Code on GitHub
TidyTuesday 2023/19
May 12, 2023
US & map & childcare & TidyTuesday & Map & Data Visualization
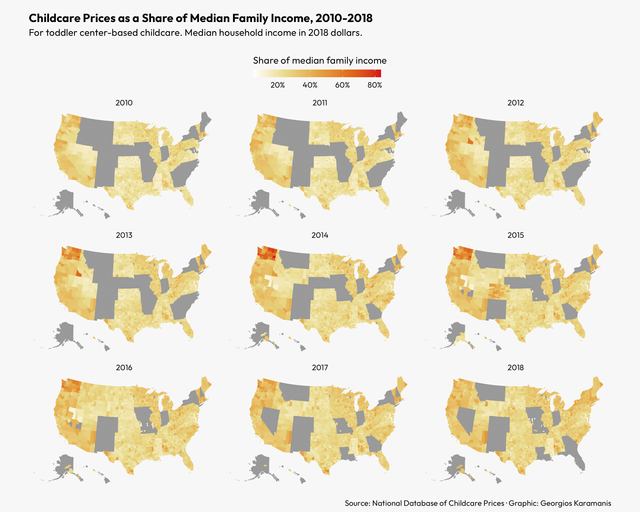 Childcare Prices for this week’s #TidyTuesday Code on GitHub
MapPromptMonday 2023/17
May 10, 2023
disease & surgery & health & Europe & MapPromptMonday & map & Map & Data Visualization
Childcare Prices for this week’s #TidyTuesday Code on GitHub
MapPromptMonday 2023/17
May 10, 2023
disease & surgery & health & Europe & MapPromptMonday & map & Map & Data Visualization
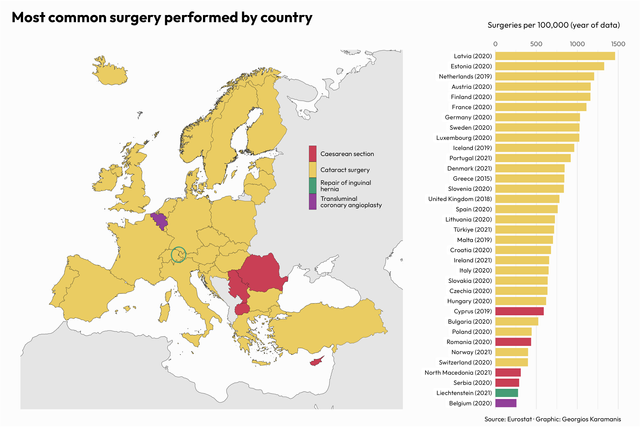 For the week 24-30 Apr of #MapPromptMonday, Disease, I looked at the most common surgeries in European countries Code on GitHub
MapPromptMonday 2023/16
May 7, 2023
drought & Europe & MapPromptMonday & Data Visualization & Map
For the week 24-30 Apr of #MapPromptMonday, Disease, I looked at the most common surgeries in European countries Code on GitHub
MapPromptMonday 2023/16
May 7, 2023
drought & Europe & MapPromptMonday & Data Visualization & Map
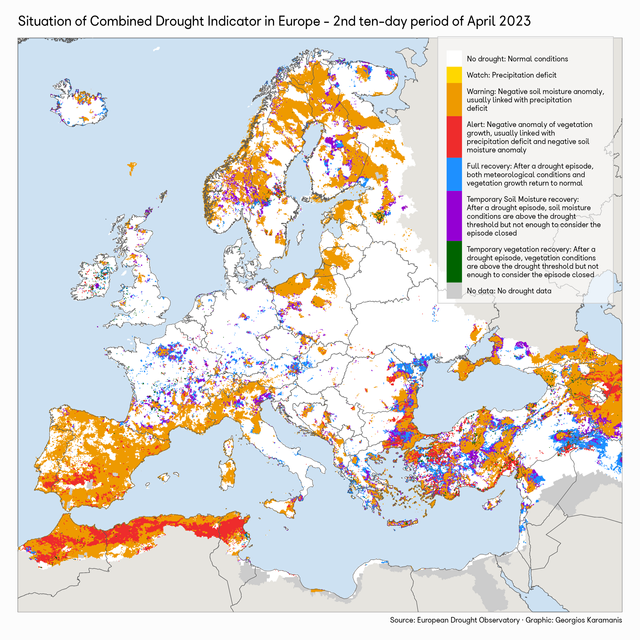 For the week 17-24 April of #MapPromptMonday, Environment, I recreated the drought map by Copernicus EMS Code on GitHub
TidyTuesday 2023/16
April 23, 2023
crops & Middle East & map & TidyTuesday & Data Visualization
For the week 17-24 April of #MapPromptMonday, Environment, I recreated the drought map by Copernicus EMS Code on GitHub
TidyTuesday 2023/16
April 23, 2023
crops & Middle East & map & TidyTuesday & Data Visualization
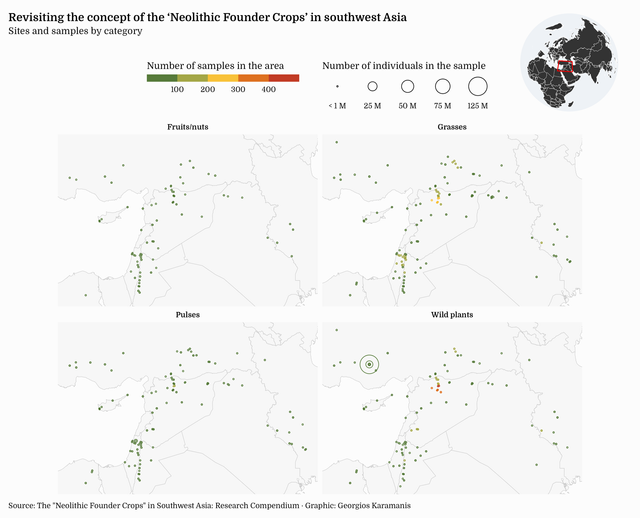 Neolithic Founder Crops for this week’s #TidyTuesday. Had started with a similar map when I saw Nicola’s plot and decided to steal the idea of a
MapPromptMonday 2023/15
April 21, 2023
Europe & MapPromptMonday & topographic & height & Data Visualization & Map
Neolithic Founder Crops for this week’s #TidyTuesday. Had started with a similar map when I saw Nicola’s plot and decided to steal the idea of a
MapPromptMonday 2023/15
April 21, 2023
Europe & MapPromptMonday & topographic & height & Data Visualization & Map
 Submission to last week’s #MapPromptMonday, Topography Code on GitHub
MapPromptMonday 2023/14
April 17, 2023
map & MapPromptMonday & photos & Olivia & Map & Data Visualization
Submission to last week’s #MapPromptMonday, Topography Code on GitHub
MapPromptMonday 2023/14
April 17, 2023
map & MapPromptMonday & photos & Olivia & Map & Data Visualization
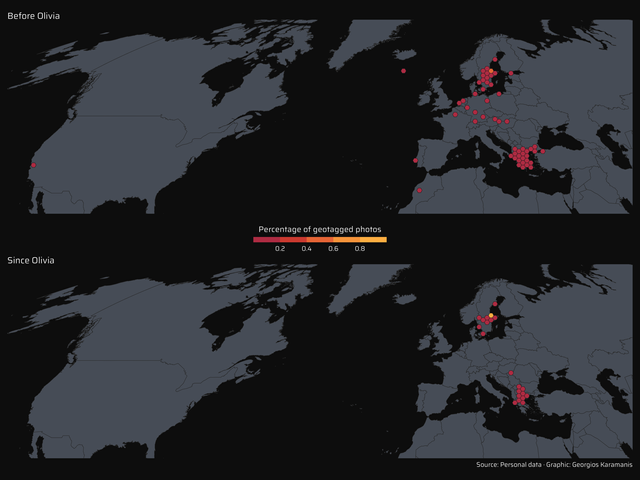 A personal project for #MapPromptMonday, week of April 3-9, Bucket List. Location of geotagged photos before and after the birth of my daughter Code
MapPromptMonday 2023/13
April 9, 2023
map & MapPromptMonday & Europe & disaster & Map & Data Visualization
A personal project for #MapPromptMonday, week of April 3-9, Bucket List. Location of geotagged photos before and after the birth of my daughter Code
MapPromptMonday 2023/13
April 9, 2023
map & MapPromptMonday & Europe & disaster & Map & Data Visualization
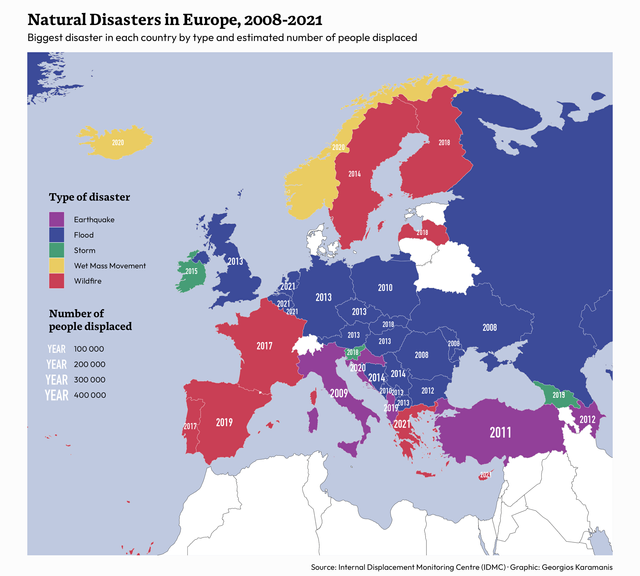 For last week’s #MapPromptMonday, Recent Environmental Disaster, I made this map of the biggest (by number of people displaced) disaster in each
TidyTuesday 2023/13
April 1, 2023
world & timezones & time & Data Visualization & Map
For last week’s #MapPromptMonday, Recent Environmental Disaster, I made this map of the biggest (by number of people displaced) disaster in each
TidyTuesday 2023/13
April 1, 2023
world & timezones & time & Data Visualization & Map
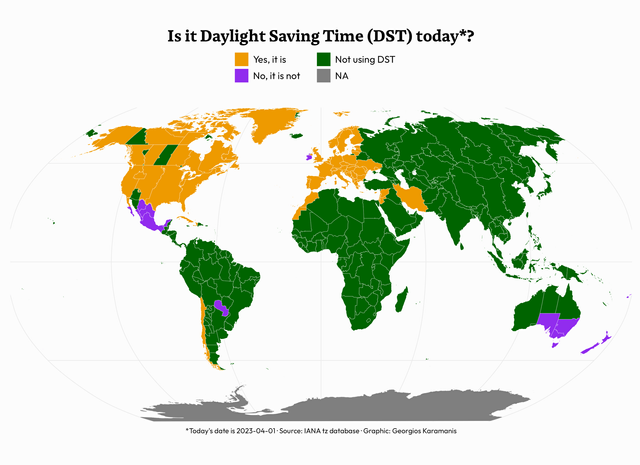 “Is it Daylight Saving Time today?” for this week’s #TidyTuesday Code on GitHub
MapPromptMonday 2023/12
March 24, 2023
map & Earth & temperature & globe & Data Visualization & Map
“Is it Daylight Saving Time today?” for this week’s #TidyTuesday Code on GitHub
MapPromptMonday 2023/12
March 24, 2023
map & Earth & temperature & globe & Data Visualization & Map
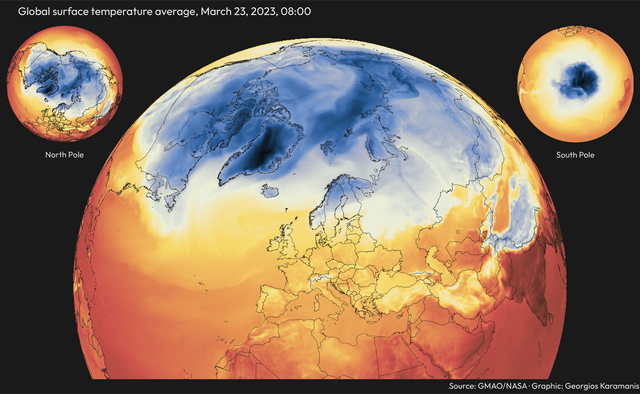 For this week’s #MapPromptMonday, Inspired By…, I used ggplot2 to recreate Wanmei’s great visual. Downloading the data was super easy thanks to
MapPromptMonday 2023/11
March 19, 2023
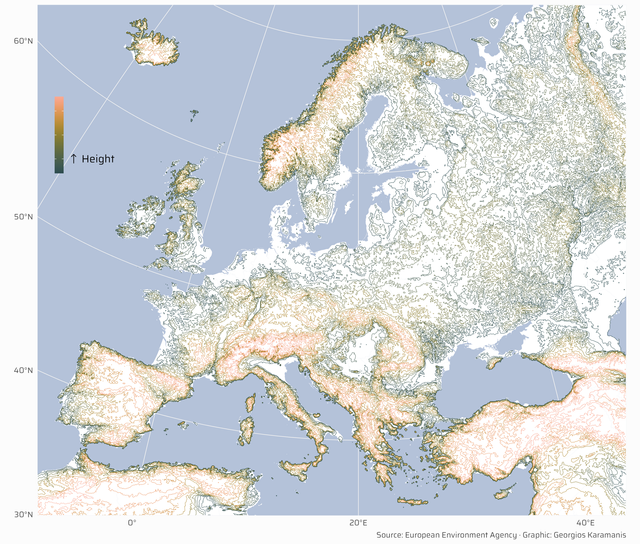
Europe & map & elevation & relief & Map & Data Visualization
For this week’s #MapPromptMonday, Inspired By…, I used ggplot2 to recreate Wanmei’s great visual. Downloading the data was super easy thanks to
MapPromptMonday 2023/11
March 19, 2023
Europe & map & elevation & relief & Map & Data Visualization
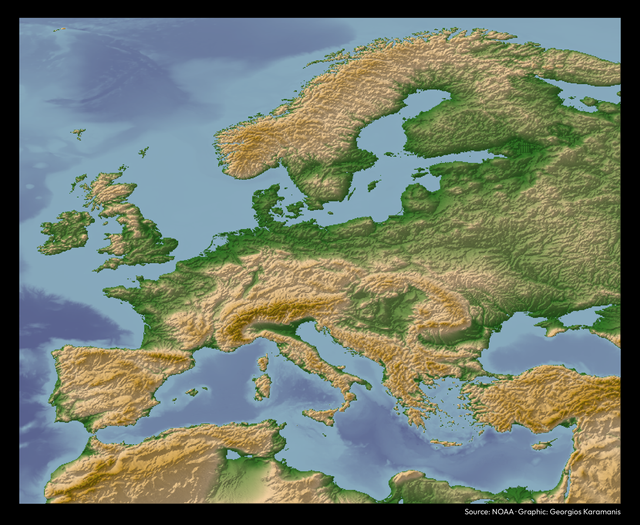 For this week’s #MapPromptMonday, Earth imagery, I made an elevation map of Europe with a shaded relief using Elio’s technique. Code on GitHub
TidyTuesday 2023/10
March 12, 2023
numbats & Australia & map & Data Visualization & Map
For this week’s #MapPromptMonday, Earth imagery, I made an elevation map of Europe with a shaded relief using Elio’s technique. Code on GitHub
TidyTuesday 2023/10
March 12, 2023
numbats & Australia & map & Data Visualization & Map
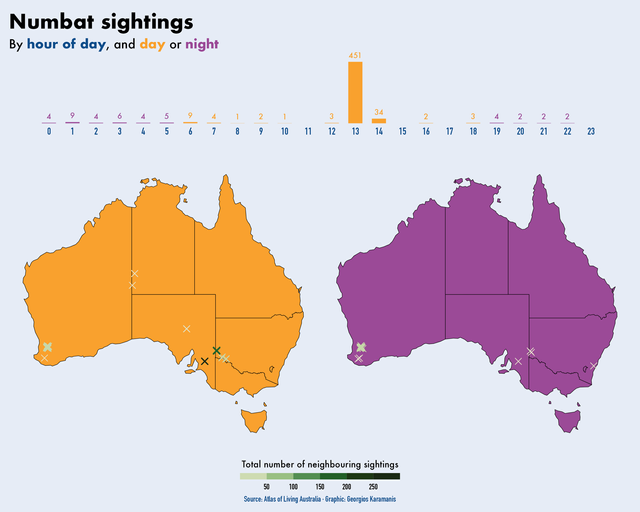 Numbat sightings for this week’s #TidyTuesday Code on GitHub
MapPromptMonday 2023/10
March 11, 2023
pets & cats & dogs & Europe & map & Data Visualization & Map
Numbat sightings for this week’s #TidyTuesday Code on GitHub
MapPromptMonday 2023/10
March 11, 2023
pets & cats & dogs & Europe & map & Data Visualization & Map
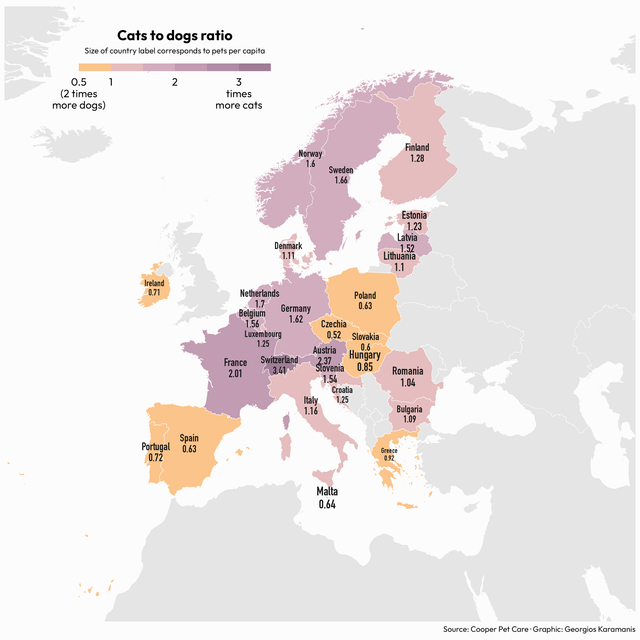 I didn’t have a favorite animal for this week #MapPromptMonday, so I asked my daughter about hers 🙂 So, here is the ratio of cats to dogs in
MapPromptMonday 2023/9
March 3, 2023
map & Europe & yew & tree & Data Visualization & Map
I didn’t have a favorite animal for this week #MapPromptMonday, so I asked my daughter about hers 🙂 So, here is the ratio of cats to dogs in
MapPromptMonday 2023/9
March 3, 2023
map & Europe & yew & tree & Data Visualization & Map
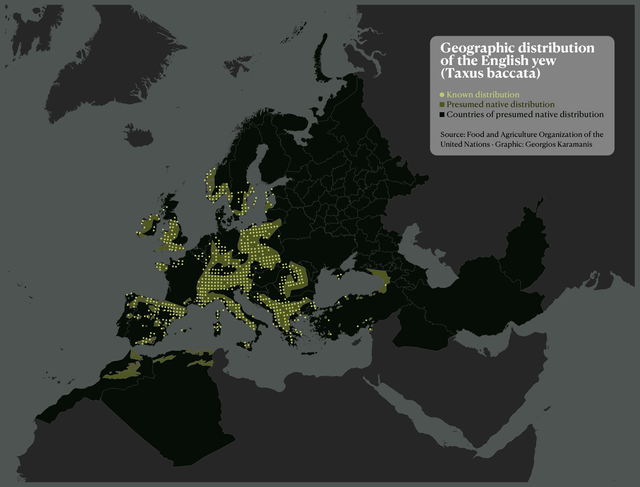 For this week #MapPromptMonday (NGO Data) I remade a map from a FAO report. Code on GitHub
MapPromptMonday 2023/8
February 23, 2023
map & train & Europe & b&w & Map & Data Visualization
For this week #MapPromptMonday (NGO Data) I remade a map from a FAO report. Code on GitHub
MapPromptMonday 2023/8
February 23, 2023
map & train & Europe & b&w & Map & Data Visualization
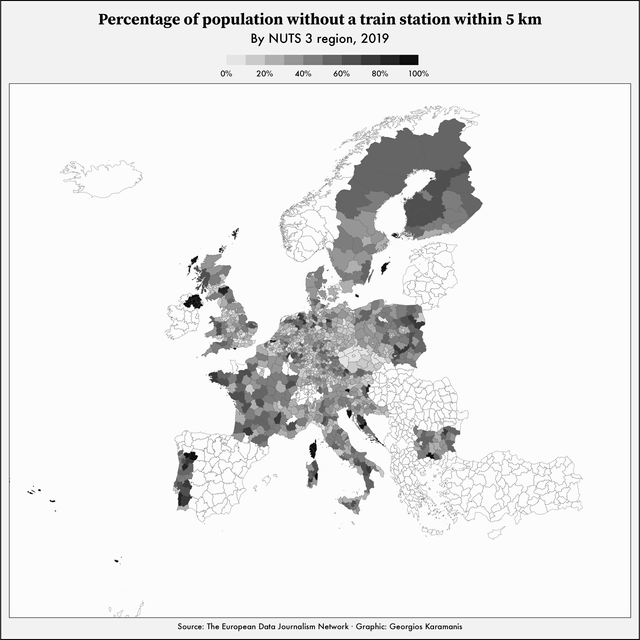 For this week #MapPromptMonday (Black & White/Grayscale) I used a dataset by the EDJNet. Code on GitHub
MapPromptMonday 2023/7
February 16, 2023
map & Europe & sunshine & precipitation & bivariate & Map & Data Visualization
For this week #MapPromptMonday (Black & White/Grayscale) I used a dataset by the EDJNet. Code on GitHub
MapPromptMonday 2023/7
February 16, 2023
map & Europe & sunshine & precipitation & bivariate & Map & Data Visualization
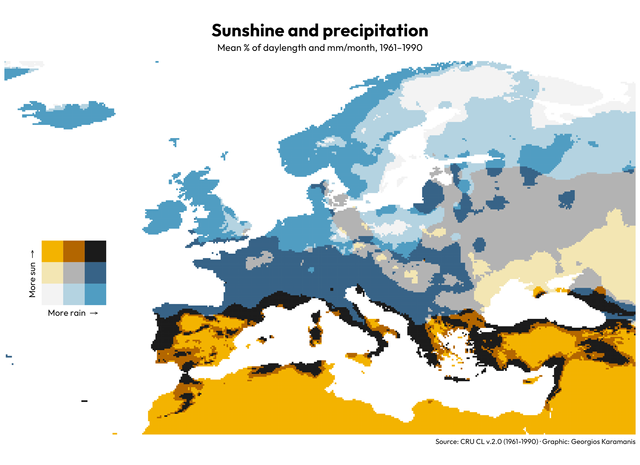 Mean sunshine and precipitation between 1961 and 1990 for this week’s #MapPromptMonday (Bivariate map) Idea and colors by Colin Angus Code on GitHub
MapPromptMonday 2023/6
February 6, 2023
Earth & climate & temperature & map & Data Visualization & Map
Mean sunshine and precipitation between 1961 and 1990 for this week’s #MapPromptMonday (Bivariate map) Idea and colors by Colin Angus Code on GitHub
MapPromptMonday 2023/6
February 6, 2023
Earth & climate & temperature & map & Data Visualization & Map
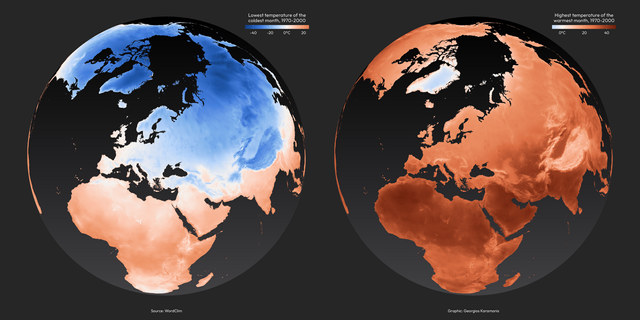 Lowest and highest temperatures between 1970 and 2000 for this week’s #MapPromptMonday (Climate/Weather) code on GitHub
MapPromptMonday 2023/5
February 4, 2023
Europe & Sweden & Immigration & Map & Data Visualization
Lowest and highest temperatures between 1970 and 2000 for this week’s #MapPromptMonday (Climate/Weather) code on GitHub
MapPromptMonday 2023/5
February 4, 2023
Europe & Sweden & Immigration & Map & Data Visualization
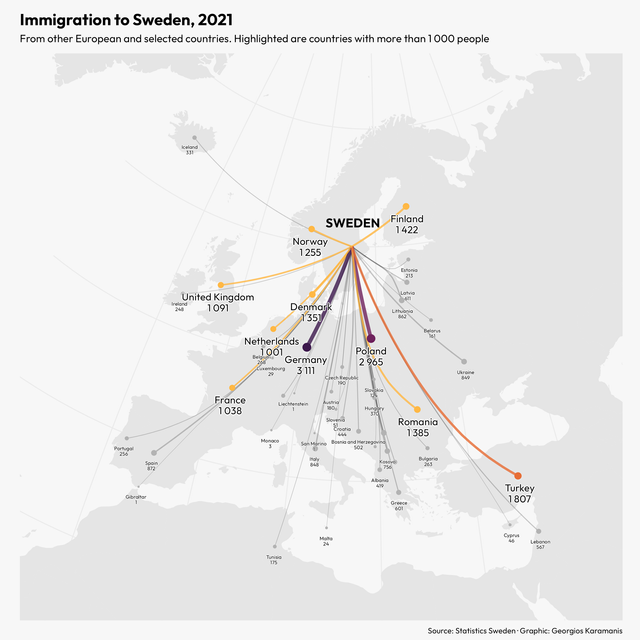 Immigration to Sweden for this week’s #MapPromptMonday (Flow Map) Code on GitHub
MapPromptMonday 2023/4
January 28, 2023
TV & map & Europe & Map & Data Visualization
Immigration to Sweden for this week’s #MapPromptMonday (Flow Map) Code on GitHub
MapPromptMonday 2023/4
January 28, 2023
TV & map & Europe & Map & Data Visualization
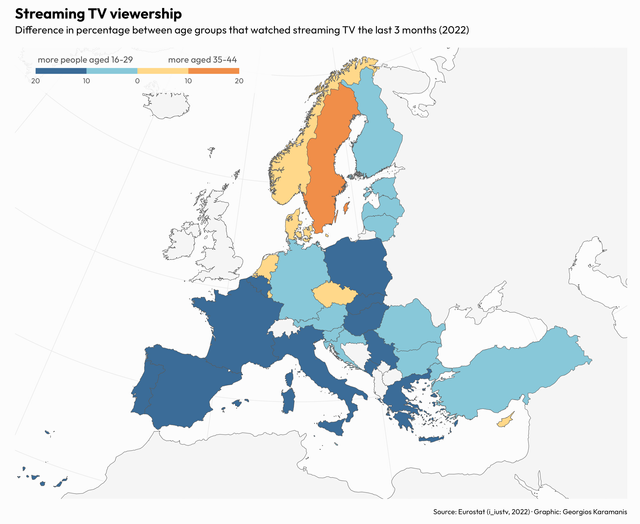 For this week’s #MapPromptMonday I made a map comparing the streaming TV viewership between two age groups in EU countries. Code on GitHub
MapPromptMonday 2023/3
January 21, 2023
map & MapPromptMonday & livestock & colorblind-friendly & Data Visualization & Map
For this week’s #MapPromptMonday I made a map comparing the streaming TV viewership between two age groups in EU countries. Code on GitHub
MapPromptMonday 2023/3
January 21, 2023
map & MapPromptMonday & livestock & colorblind-friendly & Data Visualization & Map
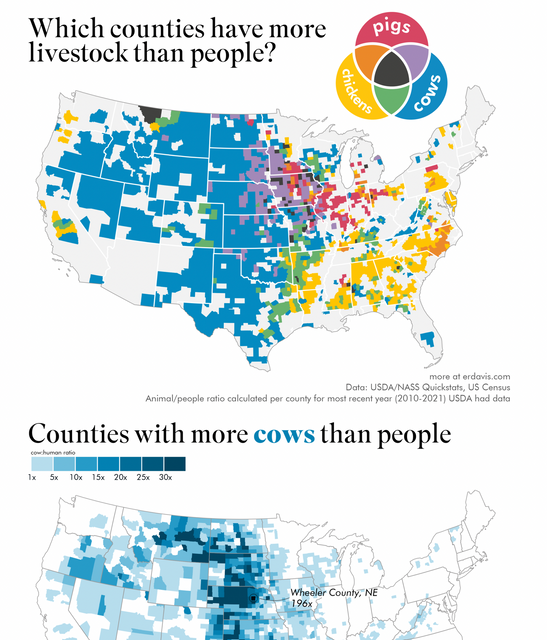
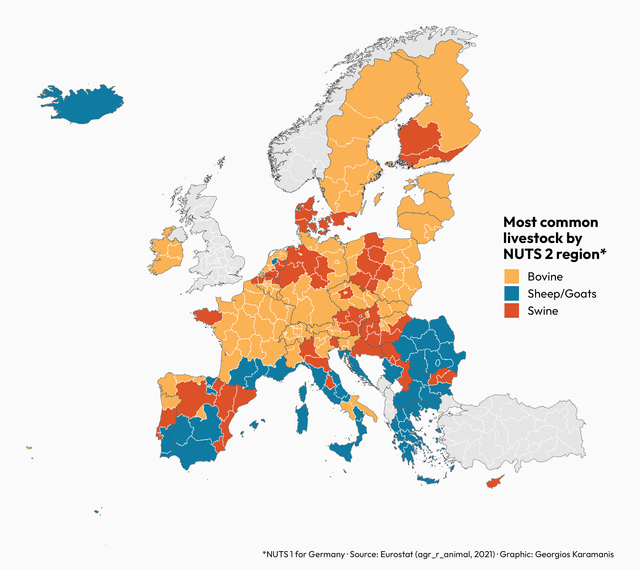 Most common livestock in EU for this week’s #MapPromptMonday. Used the colorblind-friendly palette “Egypt” from MetBrewer Code on GitHub
TidyTuesday and MapPromptMonday 2023/2
January 14, 2023
TidyTuesday & MapPromptMonday & map & US & bird & hot spot & grackle & Data Visualization
Most common livestock in EU for this week’s #MapPromptMonday. Used the colorblind-friendly palette “Egypt” from MetBrewer Code on GitHub
TidyTuesday and MapPromptMonday 2023/2
January 14, 2023
TidyTuesday & MapPromptMonday & map & US & bird & hot spot & grackle & Data Visualization
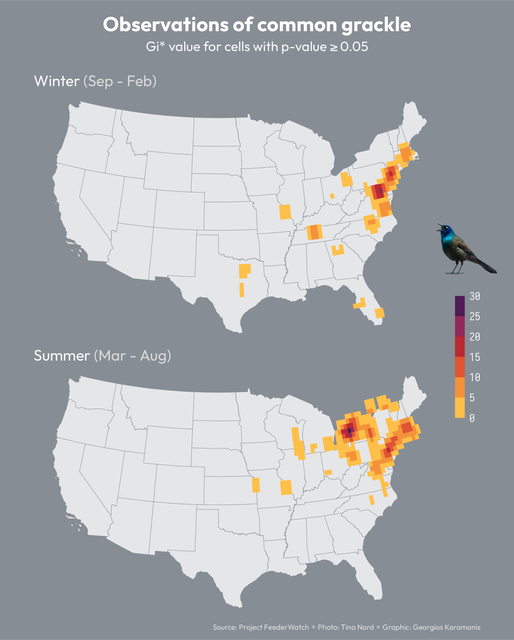 Another cross post for #MapPromptMonday (Hot spot map) and #TidyTuesday (Project FeederWatch). First time doing hot spot analysis, used the
TidyTuesday and MapPromptMonday 2023/1
January 5, 2023
Europe & map & death & Eurostat & Data Visualization & Map
Another cross post for #MapPromptMonday (Hot spot map) and #TidyTuesday (Project FeederWatch). First time doing hot spot analysis, used the
TidyTuesday and MapPromptMonday 2023/1
January 5, 2023
Europe & map & death & Eurostat & Data Visualization & Map
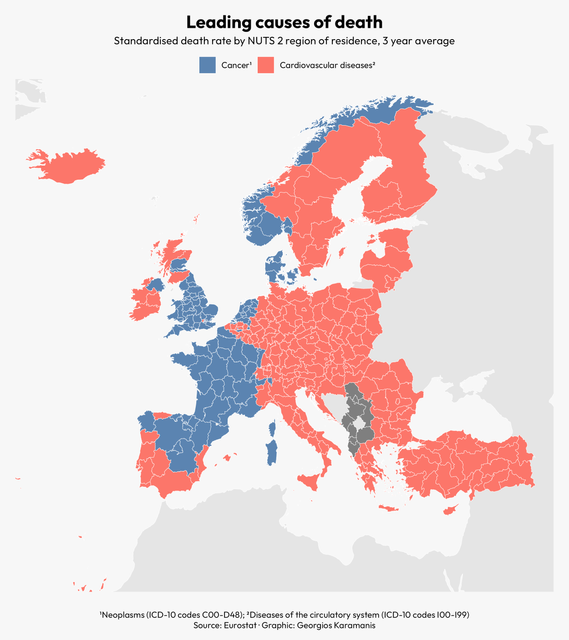 Cross post for #MapPromptMonday and #TidyTuesday. Leading cause of death by European NUTS 2 regions, trying out the eurostat R package for getting
TidyTuesday 2022/51
December 23, 2022
R & US & map & weather & wind & Data Visualization
Cross post for #MapPromptMonday and #TidyTuesday. Leading cause of death by European NUTS 2 regions, trying out the eurostat R package for getting
TidyTuesday 2022/51
December 23, 2022
R & US & map & weather & wind & Data Visualization
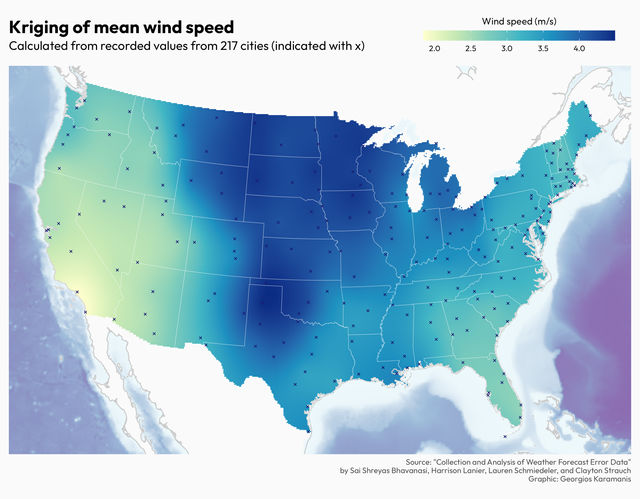 Mean wind speed for this week’s #TidyTuesday. First time using kriging interpolaration, inspired by the plots in the poster at the source of the
TidyTuesday 2022/49
December 9, 2022
R & Manhattan & New York & map & elevators & buildings & Data Visualization
Mean wind speed for this week’s #TidyTuesday. First time using kriging interpolaration, inspired by the plots in the poster at the source of the
TidyTuesday 2022/49
December 9, 2022
R & Manhattan & New York & map & elevators & buildings & Data Visualization
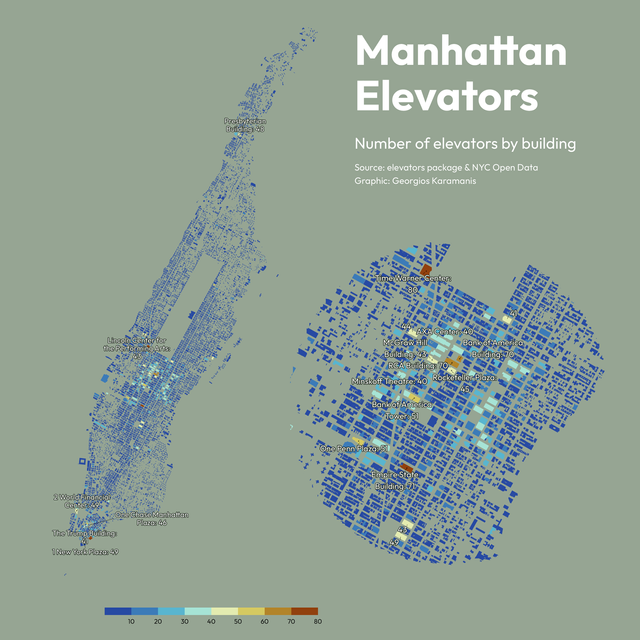 Number of elevators by building for this week’s #TidyTuesday, combining the elevator dataset with the building footprints spatial file from NYC Open
TidyTuesday 2022/47
November 27, 2022
R & Great Britain & map & museum & Data Visualization
Number of elevators by building for this week’s #TidyTuesday, combining the elevator dataset with the building footprints spatial file from NYC Open
TidyTuesday 2022/47
November 27, 2022
R & Great Britain & map & museum & Data Visualization
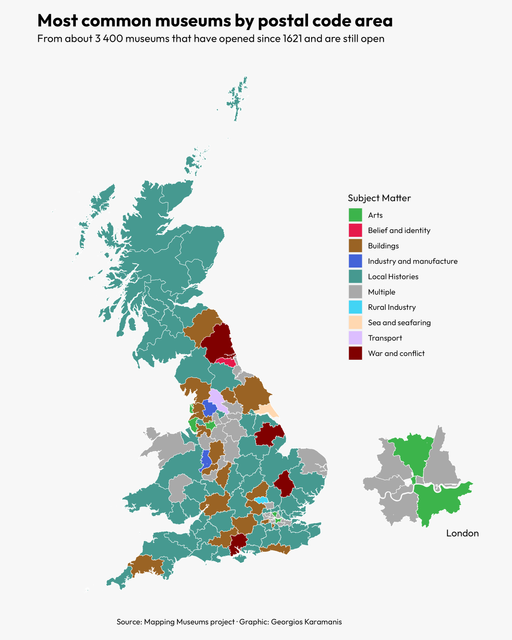 Most common types of museums for this week’s #TidyTuesday Code on GitHub
TidyTuesday 2022/39
September 28, 2022
artists & map & US & R & TidyTuesday & Data Visualization
Most common types of museums for this week’s #TidyTuesday Code on GitHub
TidyTuesday 2022/39
September 28, 2022
artists & map & US & R & TidyTuesday & Data Visualization
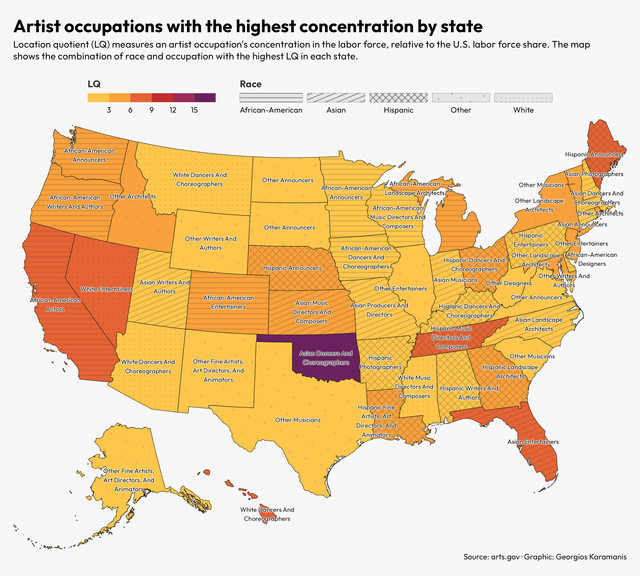 For this week’s #TidyTuesday I created a map of the combination of race and artist occupation with the highest concentration by state code on GitHub
TidyTuesday 2022/38
September 24, 2022
wastewater treatment plants & R & map & Mediterranean sea & Data Visualization
For this week’s #TidyTuesday I created a map of the combination of race and artist occupation with the highest concentration by state code on GitHub
TidyTuesday 2022/38
September 24, 2022
wastewater treatment plants & R & map & Mediterranean sea & Data Visualization
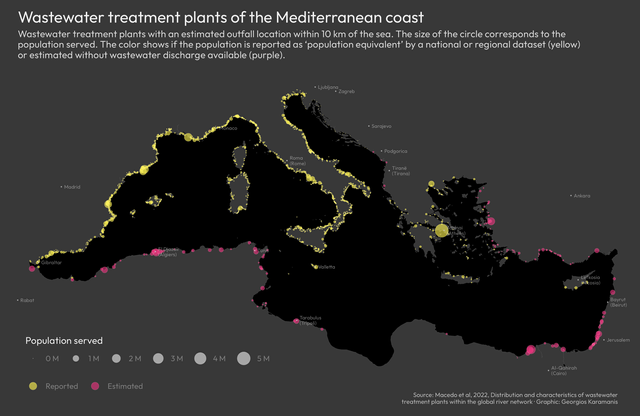 For this week’s #TidyTuesday I created a map of the wastewater treatment plants around the Mediterranean code on GitHub
TidyTuesday 2022/37
September 16, 2022
Bigfoot & bear & US & map & R & Data Visualization
For this week’s #TidyTuesday I created a map of the wastewater treatment plants around the Mediterranean code on GitHub
TidyTuesday 2022/37
September 16, 2022
Bigfoot & bear & US & map & R & Data Visualization
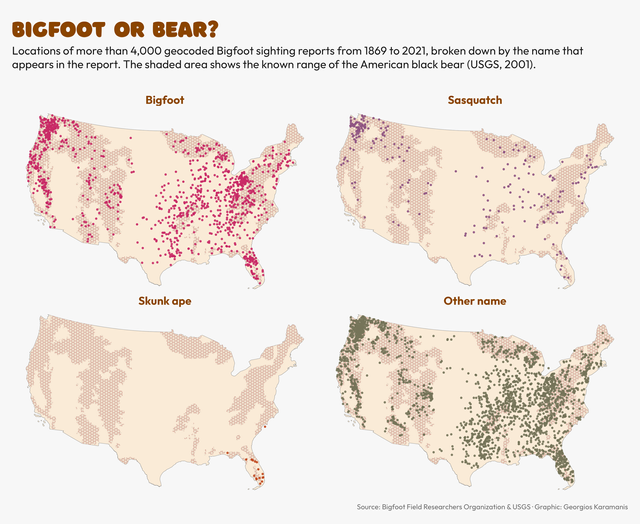 Bigfoot or bear for this week’s #TidyTuesday code on GitHub
TidyTuesday 2022/31
August 7, 2022
R & frogs & heatmap & map & Data Visualization
Bigfoot or bear for this week’s #TidyTuesday code on GitHub
TidyTuesday 2022/31
August 7, 2022
R & frogs & heatmap & map & Data Visualization
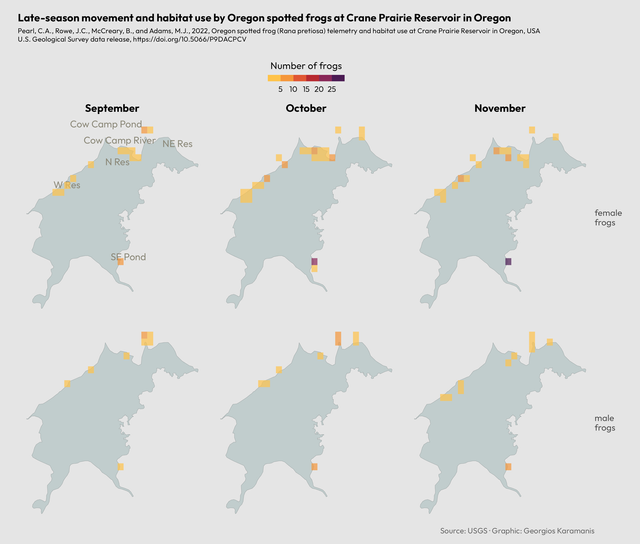 For this week’s #TidyTuesday I made a simple heatmap of frog observations by month and sex code on GitHub
TidyTuesday 2022/27
July 7, 2022
San Francisco & map & rent & Data Visualization
For this week’s #TidyTuesday I made a simple heatmap of frog observations by month and sex code on GitHub
TidyTuesday 2022/27
July 7, 2022
San Francisco & map & rent & Data Visualization
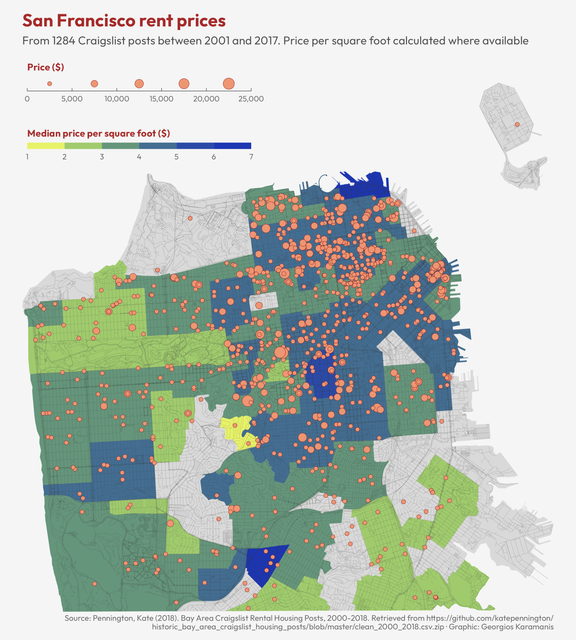 San Francisco rent prices for this week’s #TidyTuesday. Data source: katepennington.org Inspiration and code from Phil Massicotte’s SF trees plot
TidyTuesday 2022/26
July 2, 2022
TidyTuesday & gender & pay gap & map & Data Visualization
San Francisco rent prices for this week’s #TidyTuesday. Data source: katepennington.org Inspiration and code from Phil Massicotte’s SF trees plot
TidyTuesday 2022/26
July 2, 2022
TidyTuesday & gender & pay gap & map & Data Visualization
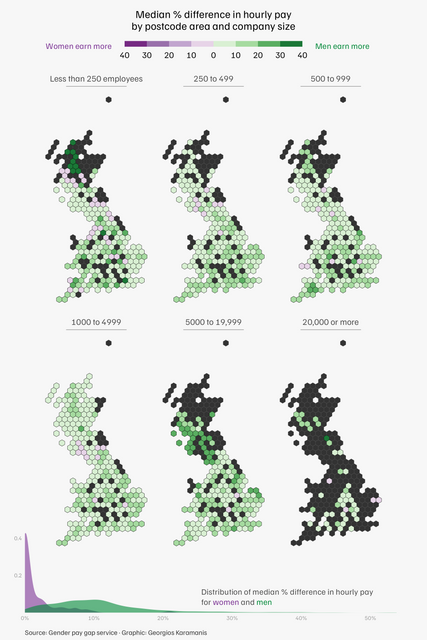 Gender pay gap by company size and postcode area for this week’s #TidyTuesday, using the geogrid package to create a hex grid from a gpkg file. Code
What’s the most common type of livestock in each county - Swedish version
June 24, 2022
animal & livestock & map & Sweden & people & Data Visualization
Gender pay gap by company size and postcode area for this week’s #TidyTuesday, using the geogrid package to create a hex grid from a gpkg file. Code
What’s the most common type of livestock in each county - Swedish version
June 24, 2022
animal & livestock & map & Sweden & people & Data Visualization
 When I saw Erin’s post a couple of days ago, I immediately wanted to do same for Sweden and started searching for data sources. Screenshot from
TidyTuesday 2022/24
June 16, 2022
drought & US & map & R & Data Visualization
When I saw Erin’s post a couple of days ago, I immediately wanted to do same for Sweden and started searching for data sources. Screenshot from
TidyTuesday 2022/24
June 16, 2022
drought & US & map & R & Data Visualization
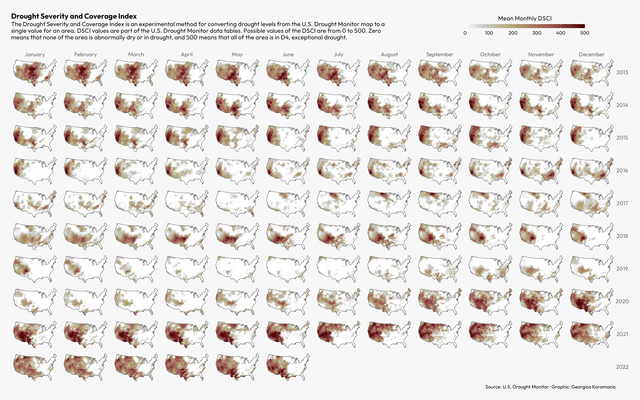 Small multiples mapping the Drought Severity and Coverage Index the last 10 years for this week’s #TidyTuesday. The subtitle text was taken from the
TidyTuesday 2022/21
May 29, 2022
rugby & TidyTuesday & map & Europe & Sweden & sports & Data Visualization
Small multiples mapping the Drought Severity and Coverage Index the last 10 years for this week’s #TidyTuesday. The subtitle text was taken from the
TidyTuesday 2022/21
May 29, 2022
rugby & TidyTuesday & map & Europe & Sweden & sports & Data Visualization
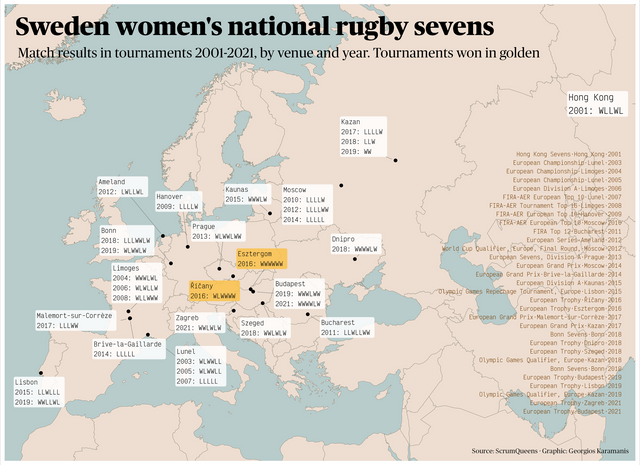 Match results of Sweden women’s national rugby sevens for this week’s #TidyTuesday code on GitHub
TidyTuesday 2022/13
April 1, 2022
sports & US & map & R & Data Visualization
Match results of Sweden women’s national rugby sevens for this week’s #TidyTuesday code on GitHub
TidyTuesday 2022/13
April 1, 2022
sports & US & map & R & Data Visualization
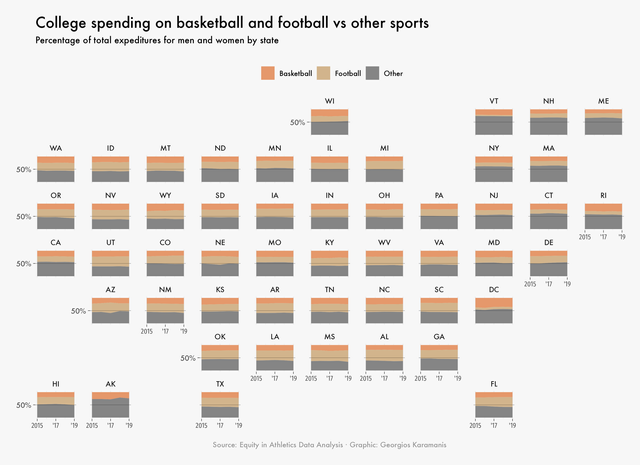 College spending on basketball and football vs other sports for this week’s #TidyTuesday Code on GitHub
TidyTuesday 2022/09
March 2, 2022
R & EV & charging stations & US & map & TidyTuesday & Data Visualization
College spending on basketball and football vs other sports for this week’s #TidyTuesday Code on GitHub
TidyTuesday 2022/09
March 2, 2022
R & EV & charging stations & US & map & TidyTuesday & Data Visualization
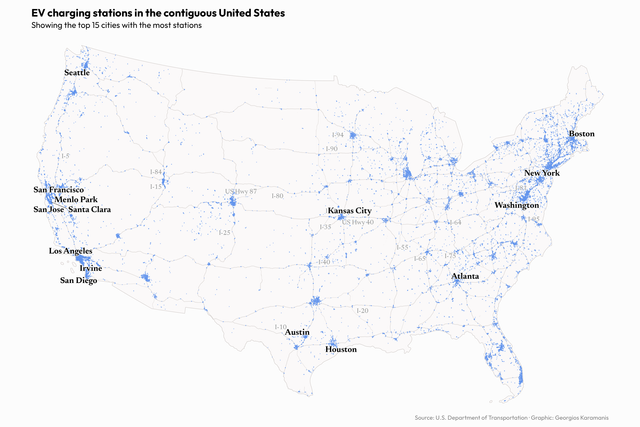 A map about EV charging stations in the US for this week’s #TidyTuesday. I wanted to make a simple and good-looking map, used another shapefile for
TidyTuesday 2022/08
February 25, 2022
R & Africa & political rights & civil liberties & map & Data Visualization
A map about EV charging stations in the US for this week’s #TidyTuesday. I wanted to make a simple and good-looking map, used another shapefile for
TidyTuesday 2022/08
February 25, 2022
R & Africa & political rights & civil liberties & map & Data Visualization
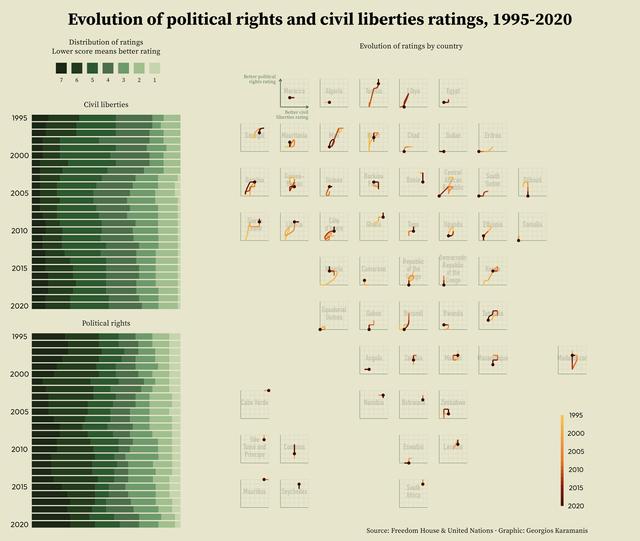 Political rights and civil liberties in Africa for this week’s #TidyTuesday code on GitHub
TidyTuesday 2022/07
February 17, 2022
R & DuBois & US & map & triangle & Data Visualization
Political rights and civil liberties in Africa for this week’s #TidyTuesday code on GitHub
TidyTuesday 2022/07
February 17, 2022
R & DuBois & US & map & triangle & Data Visualization
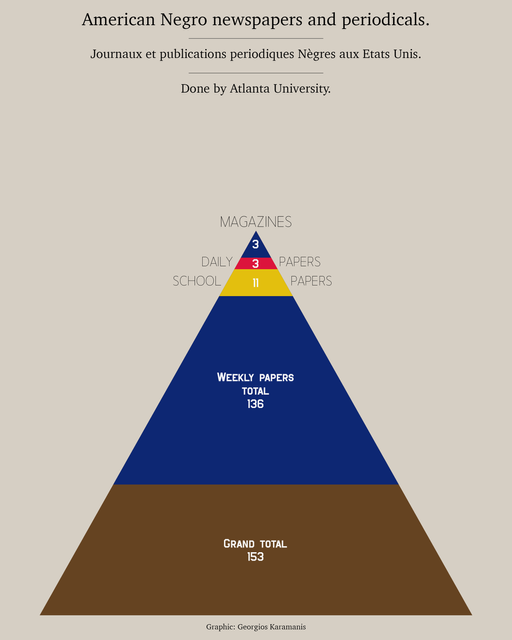 Two plots for this week’s #TidyTuesday and #DuBoisChallenge2022, recreating plates 61 and 42 Code on GitHub
30DayMapChallenge 2021
November 27, 2021
R & 30DayMapChallenge & Greece & map & Map & Data Visualization
Two plots for this week’s #TidyTuesday and #DuBoisChallenge2022, recreating plates 61 and 42 Code on GitHub
30DayMapChallenge 2021
November 27, 2021
R & 30DayMapChallenge & Greece & map & Map & Data Visualization
 This post is going to be continuously updated with submissions to the 2021 #30DayMapChallenge. The code for all plots is on GitHub. For day 1, I
TidyTuesday 2021/45
November 10, 2021
R & Africa & map & 30DayMapChallenge & population & Data Visualization & Map
This post is going to be continuously updated with submissions to the 2021 #30DayMapChallenge. The code for all plots is on GitHub. For day 1, I
TidyTuesday 2021/45
November 10, 2021
R & Africa & map & 30DayMapChallenge & population & Data Visualization & Map
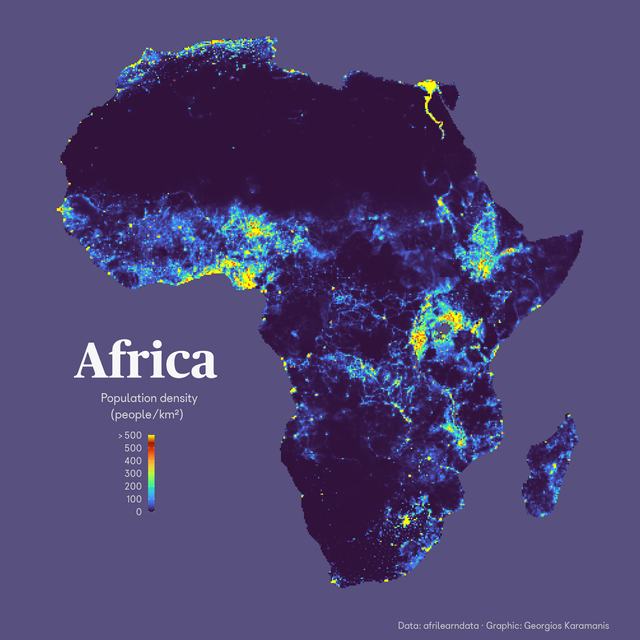 Cross post for this week’s #TidyTuesday and day 10 of #30daymapchallenge, raster. Population density in Africa with raster data from @afrimapr Code