TidyTuesday 2025/33
August 17, 2025
TidyTuesday & Shiny & R & Data Visualization & map & world & climate
 Explore extreme weather attribution studies with a Shiny app for this week’s #TidyTuesday App at shinyapps.io Code on GitHub
TidyTuesday 2025/32
August 10, 2025
TidyTuesday & income inequality & Gini & data visualization & R
Explore extreme weather attribution studies with a Shiny app for this week’s #TidyTuesday App at shinyapps.io Code on GitHub
TidyTuesday 2025/32
August 10, 2025
TidyTuesday & income inequality & Gini & data visualization & R
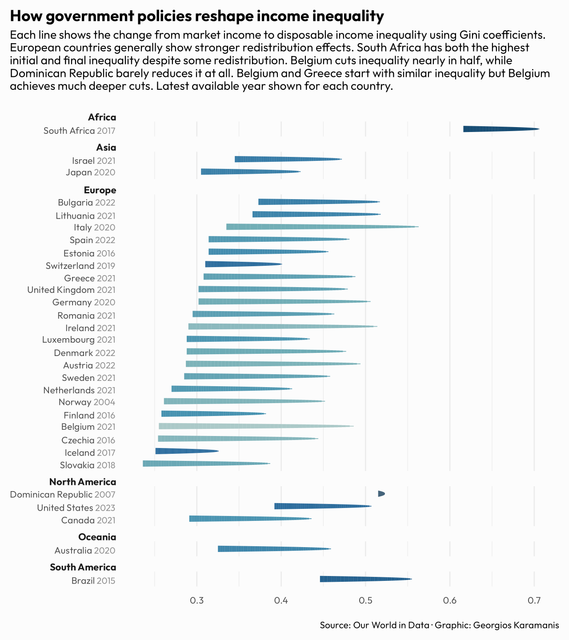 Income inequality for this week’s #TidyTuesday. How do countries redistribute income through taxes and transfers? Code on GitHub
TidyTuesday 2025/29
July 18, 2025
British Library & TidyTuesday & R & data visualization
Income inequality for this week’s #TidyTuesday. How do countries redistribute income through taxes and transfers? Code on GitHub
TidyTuesday 2025/29
July 18, 2025
British Library & TidyTuesday & R & data visualization
 British Library funding for this week’s #TidyTuesday Code on GitHub
TidyTuesday 2025/28
July 9, 2025
TidyTuesday & xkcd & color & survey & data visualization & R
British Library funding for this week’s #TidyTuesday Code on GitHub
TidyTuesday 2025/28
July 9, 2025
TidyTuesday & xkcd & color & survey & data visualization & R
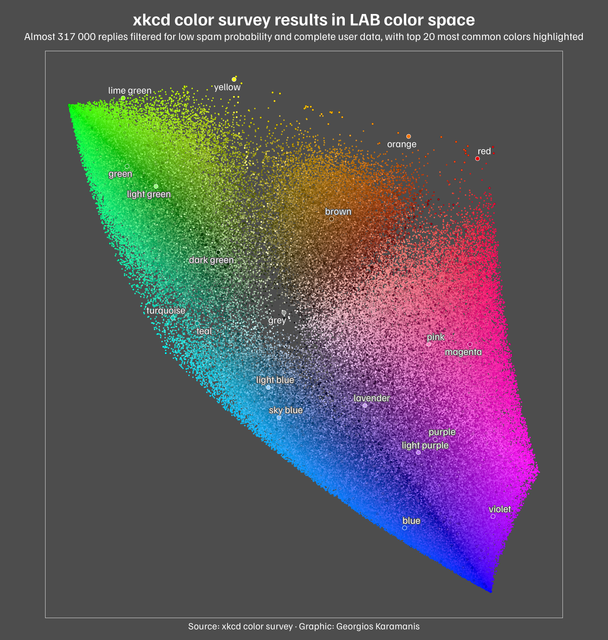 xkcd color survey results for this week’s #TidyTuesday Code on GitHub
TidyTuesday 2025/27
July 6, 2025
TidyTuesday & gas & US & data visualization & R
xkcd color survey results for this week’s #TidyTuesday Code on GitHub
TidyTuesday 2025/27
July 6, 2025
TidyTuesday & gas & US & data visualization & R
 Gas prices in the US for this week’s #TidyTuesday Code on GitHub
TidyTuesday 2025/26
June 25, 2025
TidyTuesday & data visualization & R & measles & WHO
Gas prices in the US for this week’s #TidyTuesday Code on GitHub
TidyTuesday 2025/26
June 25, 2025
TidyTuesday & data visualization & R & measles & WHO
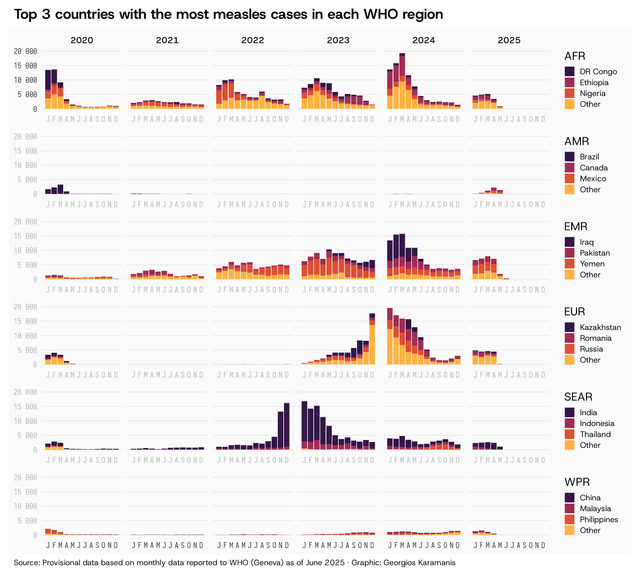 Measles cases by WHO region for this week’s #TidyTuesday Code on GitHub
TidyTuesday 2025/25
June 22, 2025
TidyTuesday & curves & data visualization & R & API
Measles cases by WHO region for this week’s #TidyTuesday Code on GitHub
TidyTuesday 2025/25
June 22, 2025
TidyTuesday & curves & data visualization & R & API
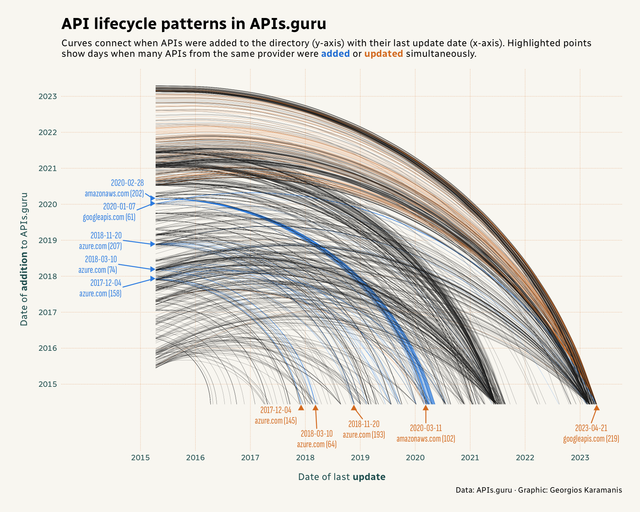 For this week’s #TidyTuesday I explored when APIs are added and updated in the APIs.guru directory Code on GitHub
TidyTuesday 2025/23
June 7, 2025
TidyTuesday & books & Project Gutenberg & data visualization & Venn
For this week’s #TidyTuesday I explored when APIs are added and updated in the APIs.guru directory Code on GitHub
TidyTuesday 2025/23
June 7, 2025
TidyTuesday & books & Project Gutenberg & data visualization & Venn
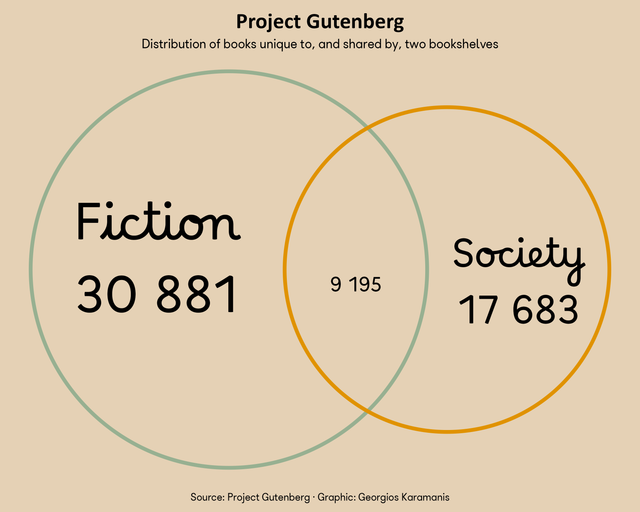 Project Gutenberg bookshelf overlap for this week’s #TidyTuesday Code on GitHub
TidyTuesday 2025/22
June 1, 2025
Dungeons & Dragons & TidyTuesday & R & Data Visualization & Shiny & radar
Project Gutenberg bookshelf overlap for this week’s #TidyTuesday Code on GitHub
TidyTuesday 2025/22
June 1, 2025
Dungeons & Dragons & TidyTuesday & R & Data Visualization & Shiny & radar
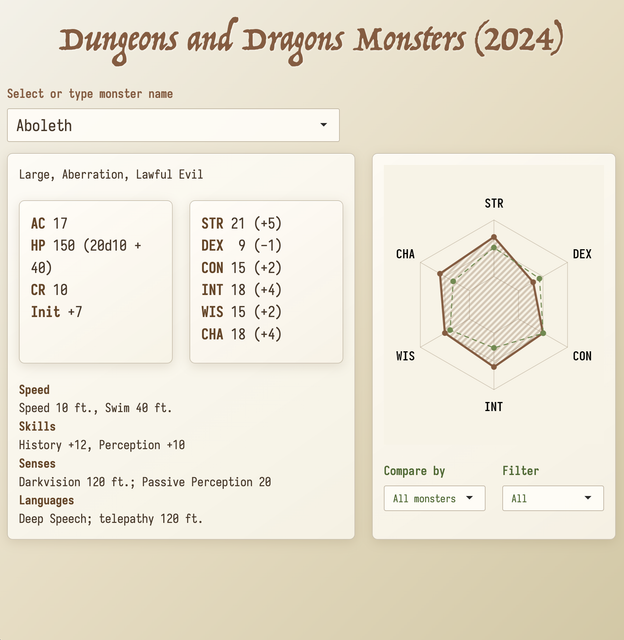 Dungeons & Dragons monsters for this week’s #TidyTuesday A Shiny app for exploring monster stats with interactive radar chart Code on GitHub
TidyTuesday 2025/18
May 4, 2025
TidyTuesday & useR & conference & R & data visualization & program & schedule
Dungeons & Dragons monsters for this week’s #TidyTuesday A Shiny app for exploring monster stats with interactive radar chart Code on GitHub
TidyTuesday 2025/18
May 4, 2025
TidyTuesday & useR & conference & R & data visualization & program & schedule
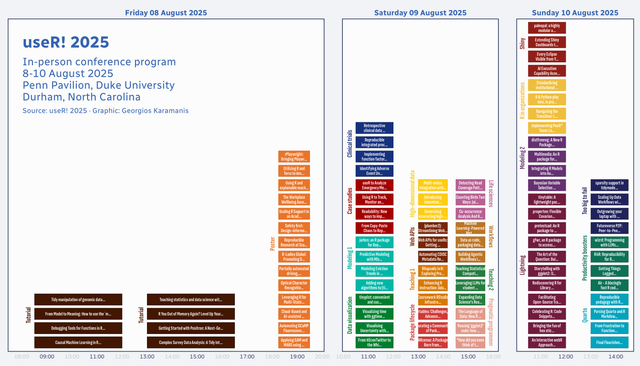 useR2025 in-person program for this week’s #TidyTuesday
30DayChartChallenge 2025
April 22, 2025
30DayChartChallenge & Sweden & health & mortality & death & age & cancer & population & R & data visualization & complications & hospitalizations & births & healthcare & antibiotics & drugs
useR2025 in-person program for this week’s #TidyTuesday
30DayChartChallenge 2025
April 22, 2025
30DayChartChallenge & Sweden & health & mortality & death & age & cancer & population & R & data visualization & complications & hospitalizations & births & healthcare & antibiotics & drugs
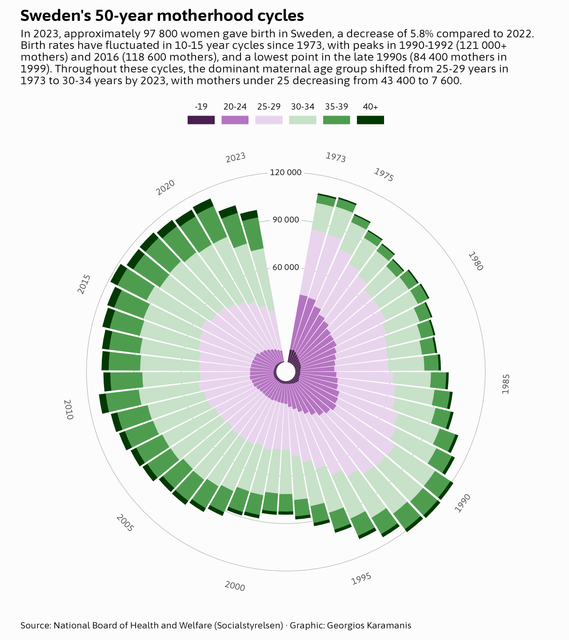 Share of deaths by age group in Sweden, 1950-2023 Lung cancer diagnoses and deaths in Sweden, 1973-2023 Sweden’s motherhood cycles BIG PRIVATE vs
TidyTuesday 2025/15
April 12, 2025
TidyTuesday & data visualization & ED & USA & healthcare & map
Share of deaths by age group in Sweden, 1950-2023 Lung cancer diagnoses and deaths in Sweden, 1973-2023 Sweden’s motherhood cycles BIG PRIVATE vs
TidyTuesday 2025/15
April 12, 2025
TidyTuesday & data visualization & ED & USA & healthcare & map
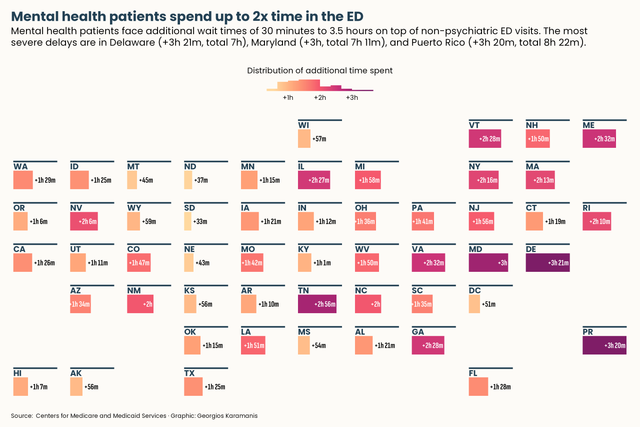 Time spent in ED for this week’s #TidyTuesday. Mental health patients consistently spend more time across all states Code on GitHub
TidyTuesday 2025/14
April 6, 2025
Pokemon & TidyTuesday & ridgeplot & data visualization
Time spent in ED for this week’s #TidyTuesday. Mental health patients consistently spend more time across all states Code on GitHub
TidyTuesday 2025/14
April 6, 2025
Pokemon & TidyTuesday & ridgeplot & data visualization
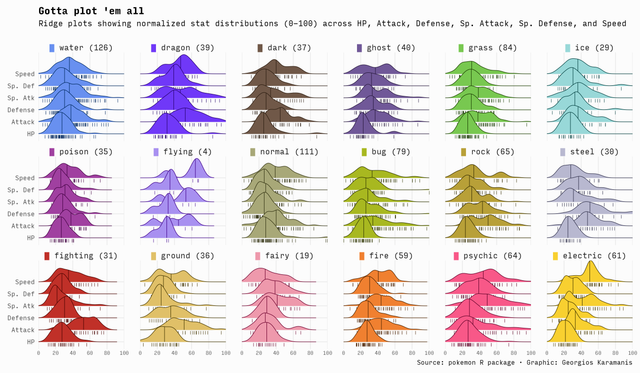 Gotta plot ’em all for this week’s #TidyTuesday Code on GitHub
TidyTuesday 2025/13
March 30, 2025
TidyTuesday & Amazon & Data Visualization & reports & numbers
Gotta plot ’em all for this week’s #TidyTuesday Code on GitHub
TidyTuesday 2025/13
March 30, 2025
TidyTuesday & Amazon & Data Visualization & reports & numbers
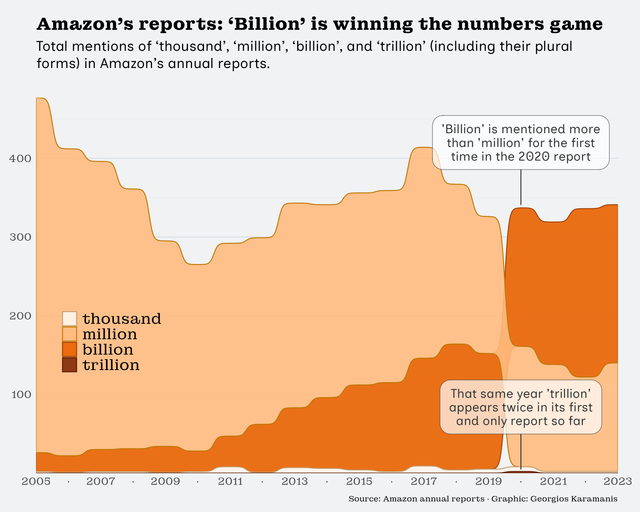 Big numbers in Amazon’s report for this week’s #TidyTuesday Code on GitHub
TidyTuesday 2024/48
November 29, 2024
data visualization & map & Ukraine & USA & TidyTuesday
Big numbers in Amazon’s report for this week’s #TidyTuesday Code on GitHub
TidyTuesday 2024/48
November 29, 2024
data visualization & map & Ukraine & USA & TidyTuesday
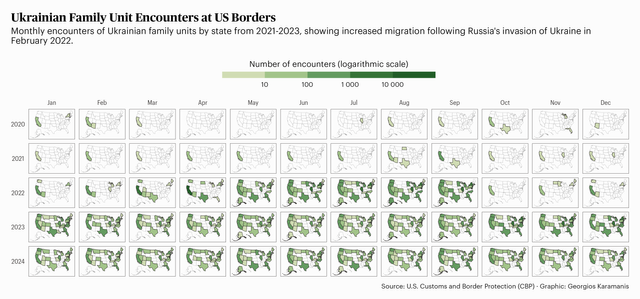 Ukrainian family unit encounters at US borders for this week’s #TidyTuesday Code on GitHub
TidyTuesday 2024/44
November 2, 2024
TidyTuesday & Data Visualization & Halloween & pumpkin
Ukrainian family unit encounters at US borders for this week’s #TidyTuesday Code on GitHub
TidyTuesday 2024/44
November 2, 2024
TidyTuesday & Data Visualization & Halloween & pumpkin
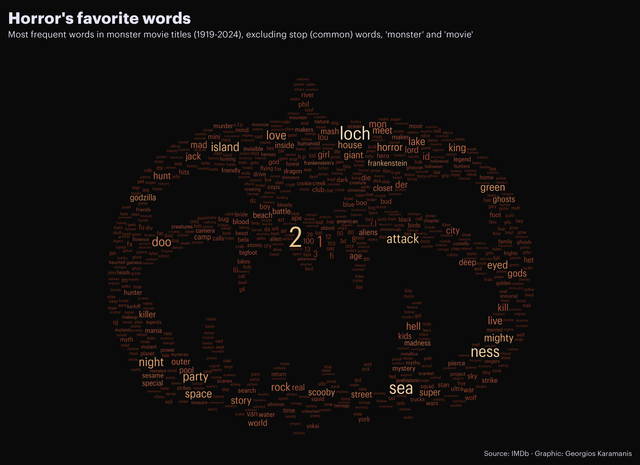 Monster movie titles for this week’s #TidyTuesday Code on GitHub
TidyTuesday 2024/38
September 20, 2024
TidyTuesday & Data Visualization & Shakespeare & sentiment
Monster movie titles for this week’s #TidyTuesday Code on GitHub
TidyTuesday 2024/38
September 20, 2024
TidyTuesday & Data Visualization & Shakespeare & sentiment
 Line-by-line sentiment analysis of Romeo and Juliet for this week’s #TidyTuesday Code on GitHub
TidyTuesday 2024/37
September 15, 2024
TidyTuesday & Data Visualization & table
Line-by-line sentiment analysis of Romeo and Juliet for this week’s #TidyTuesday Code on GitHub
TidyTuesday 2024/37
September 15, 2024
TidyTuesday & Data Visualization & table
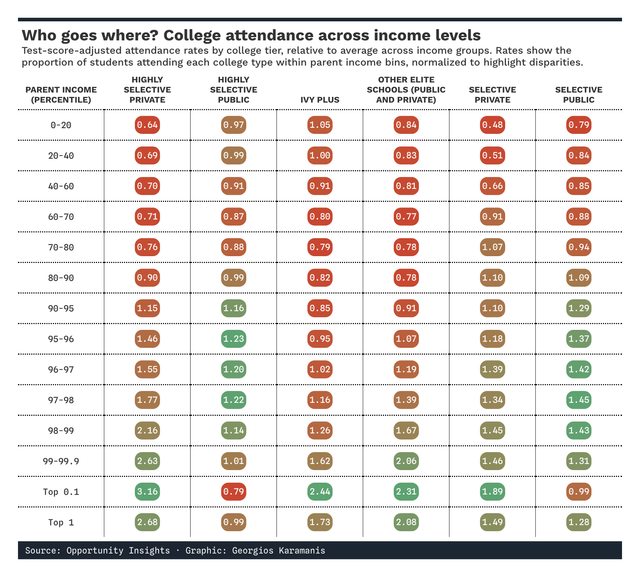 College attendance disparities for this week’s #TidyTuesday, using the very new {gtUtils} Code on GitHub
TidyTuesday 2024/36
September 8, 2024
TidyTuesday & Data Visualization & Stack Overflow & Likert & AI
College attendance disparities for this week’s #TidyTuesday, using the very new {gtUtils} Code on GitHub
TidyTuesday 2024/36
September 8, 2024
TidyTuesday & Data Visualization & Stack Overflow & Likert & AI
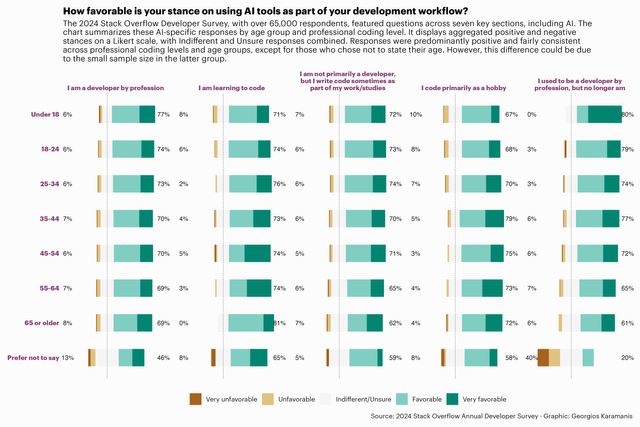 For this week’s #TidyTuesday I made a Likert scale chart for the 2024 Stack Overflow Annual Developer Survey Code on GitHub
TidyTuesday 2024/35
September 1, 2024
TidyTuesday & Data Visualization & TV & IMDb & Power Rangers
For this week’s #TidyTuesday I made a Likert scale chart for the 2024 Stack Overflow Annual Developer Survey Code on GitHub
TidyTuesday 2024/35
September 1, 2024
TidyTuesday & Data Visualization & TV & IMDb & Power Rangers
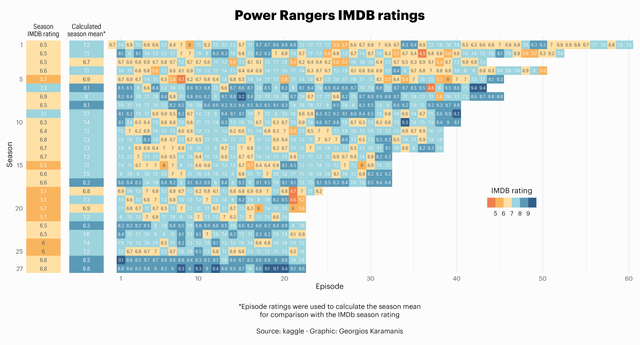 Power Rangers IMDB ratings for this week’s #TidyTuesday Code on GitHub
TidyTuesday 2024/34
August 25, 2024
TidyTuesday & Data Visualization & kings & monarchs & England & marriage
Power Rangers IMDB ratings for this week’s #TidyTuesday Code on GitHub
TidyTuesday 2024/34
August 25, 2024
TidyTuesday & Data Visualization & kings & monarchs & England & marriage
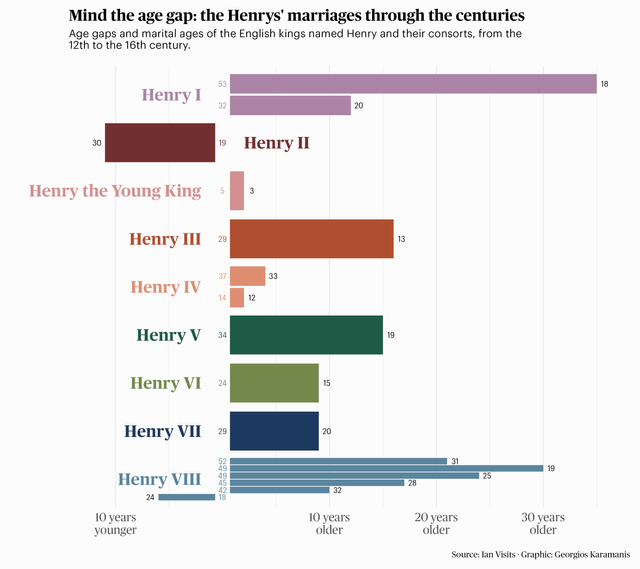 The Henrys’ marriages for this week’s #TidyTuesday Code on GitHub
TidyTuesday 2024/33
August 16, 2024
TidyTuesday & Data Visualization & scrollytelling & Quarto & closeread & World Expo
The Henrys’ marriages for this week’s #TidyTuesday Code on GitHub
TidyTuesday 2024/33
August 16, 2024
TidyTuesday & Data Visualization & scrollytelling & Quarto & closeread & World Expo
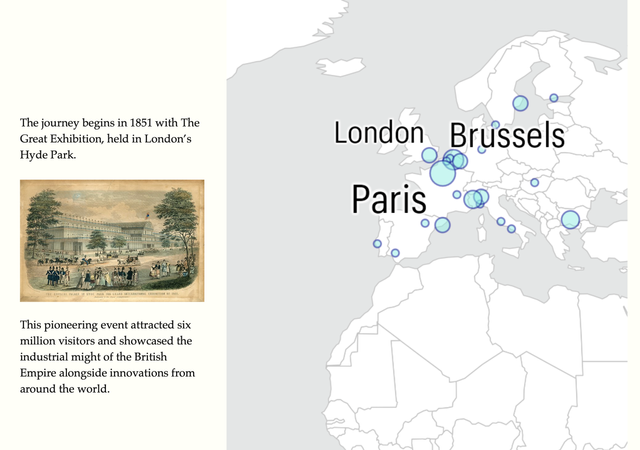 For this week’s #TidyTuesday, I made my first scrollytelling, super fun and easy thanks to #QuartoPub and closeread! Read the scrollytelling story
TidyTuesday 2024/32
August 9, 2024
Olympic games & gender & TidyTuesday & Data Visualization
For this week’s #TidyTuesday, I made my first scrollytelling, super fun and easy thanks to #QuartoPub and closeread! Read the scrollytelling story
TidyTuesday 2024/32
August 9, 2024
Olympic games & gender & TidyTuesday & Data Visualization
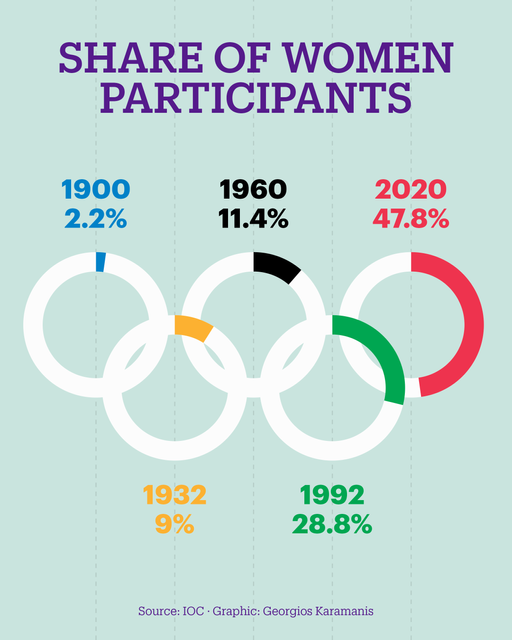
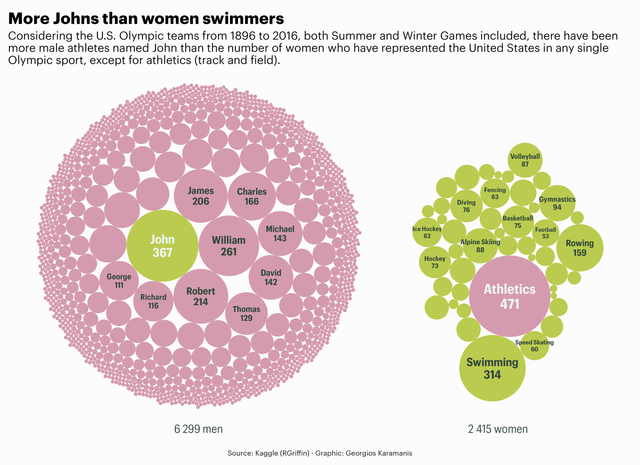 It’s the Olympics for this week’s #TidyTuesday. From 1896 to 2016, there have been more U.S. male athletes named John than U.S. female athletes in
TidyTuesday 2024/31
July 30, 2024
summer & movies & IMDB & TidyTuesday & Data Visualization
It’s the Olympics for this week’s #TidyTuesday. From 1896 to 2016, there have been more U.S. male athletes named John than U.S. female athletes in
TidyTuesday 2024/31
July 30, 2024
summer & movies & IMDB & TidyTuesday & Data Visualization
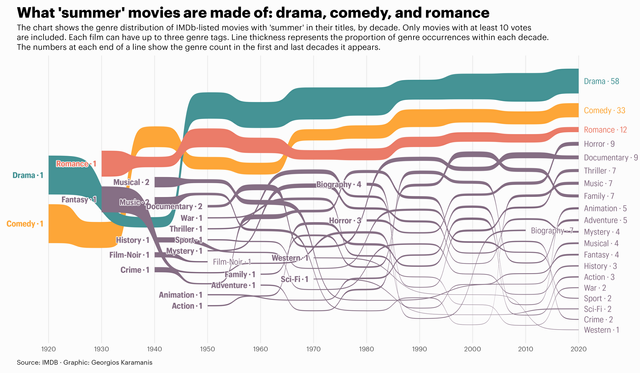 Summer movies for this week’s #TidyTuesday Code on GitHub
TidyTuesday 2024/30
July 27, 2024
TidyTuesday & American Idol & circles & Data Visualization
Summer movies for this week’s #TidyTuesday Code on GitHub
TidyTuesday 2024/30
July 27, 2024
TidyTuesday & American Idol & circles & Data Visualization
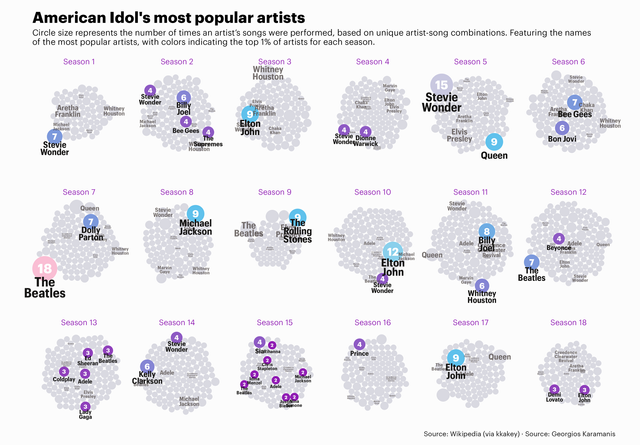 Most popular artists on American Idol for this week’s #TidyTuesday Code on GitHub
TidyTuesday 2024/29
July 18, 2024
football & women & England & TidyTuesday & Data Visualization
Most popular artists on American Idol for this week’s #TidyTuesday Code on GitHub
TidyTuesday 2024/29
July 18, 2024
football & women & England & TidyTuesday & Data Visualization
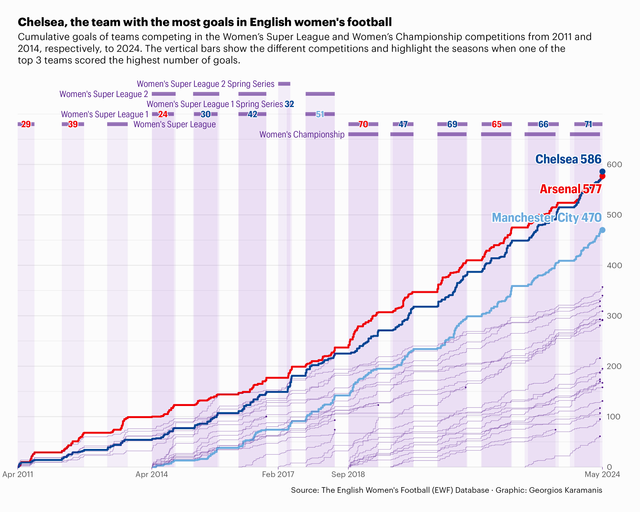 English Women’s Football for this week’s #TidyTuesday Code on GitHub
TidyTuesday 2024/28
July 14, 2024
TidyTuesday & circles & Data Visualization
English Women’s Football for this week’s #TidyTuesday Code on GitHub
TidyTuesday 2024/28
July 14, 2024
TidyTuesday & circles & Data Visualization
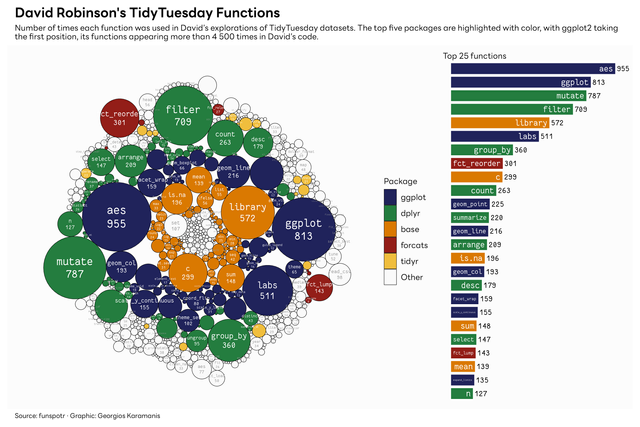 David Robinson’s functions this week’s #TidyTuesday, once again using {ggcirclepack} Code on GitHub
TidyTuesday 2024/27
July 7, 2024
TidyTuesday & bump chart & Data Visualization
David Robinson’s functions this week’s #TidyTuesday, once again using {ggcirclepack} Code on GitHub
TidyTuesday 2024/27
July 7, 2024
TidyTuesday & bump chart & Data Visualization
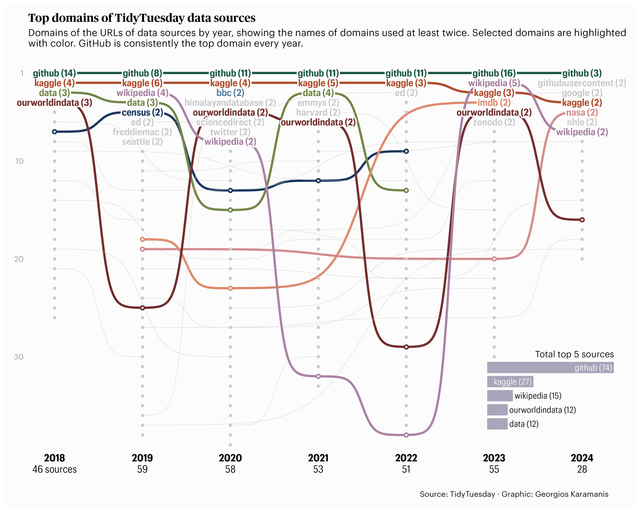 TidyTuesday data source domains for this week’s #TidyTuesday Code on GitHub
TidyTuesday 2024/26
June 28, 2024
LBGTQ+ & queer & movies & TidyTuesday & Data Visualization
TidyTuesday data source domains for this week’s #TidyTuesday Code on GitHub
TidyTuesday 2024/26
June 28, 2024
LBGTQ+ & queer & movies & TidyTuesday & Data Visualization
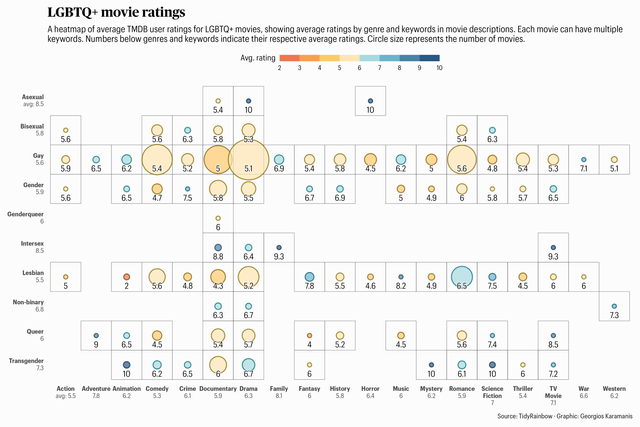 LGBTQ+ movie ratings for this week’s #TidyTuesday Code on GitHub
TidyTuesday 2024/25
June 20, 2024
holidays & US & TidyTuesday & Data Visualization
LGBTQ+ movie ratings for this week’s #TidyTuesday Code on GitHub
TidyTuesday 2024/25
June 20, 2024
holidays & US & TidyTuesday & Data Visualization
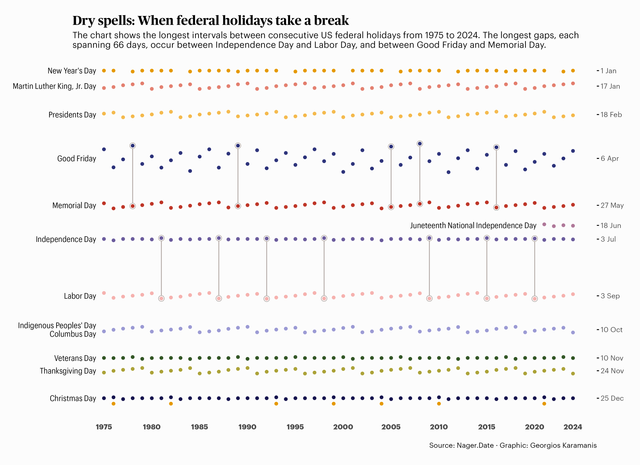 Federal holidays for this week’s #TidyTuesday Code on GitHub
TidyTuesday 2024/24
June 16, 2024
LGBT & TidyTuesday & universities & circles & Data Visualization
Federal holidays for this week’s #TidyTuesday Code on GitHub
TidyTuesday 2024/24
June 16, 2024
LGBT & TidyTuesday & universities & circles & Data Visualization
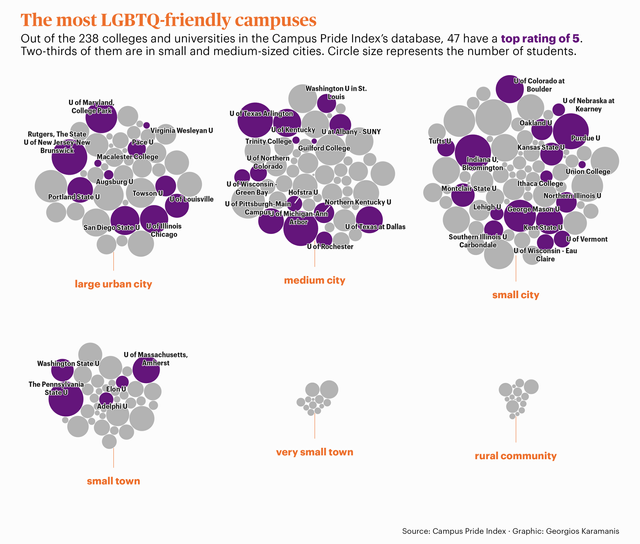 Campus Pride Index for this week’s #TidyTuesday, testing out Gina Reynolds’ very promising ggcirclepack
TidyTuesday 2024/23
June 9, 2024
cheese & TidyTuesday & Data Visualization
Campus Pride Index for this week’s #TidyTuesday, testing out Gina Reynolds’ very promising ggcirclepack
TidyTuesday 2024/23
June 9, 2024
cheese & TidyTuesday & Data Visualization
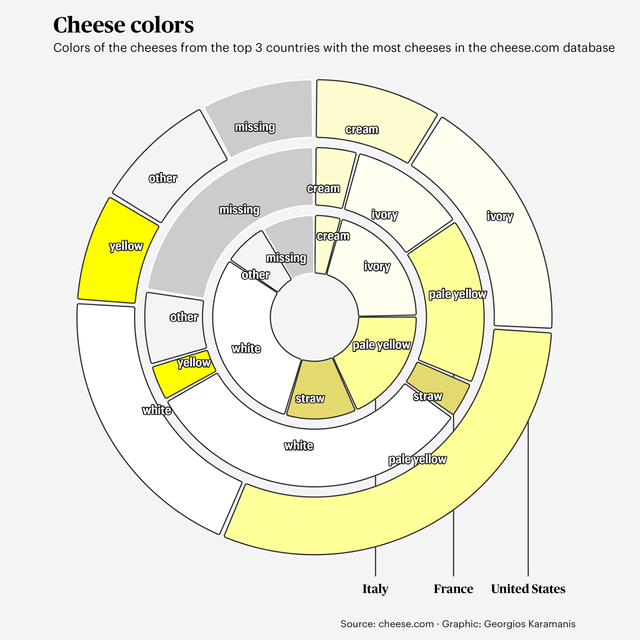 Cheese colors for this week’s #TidyTuesday Code on GitHub
TidyTuesday 2024/22
June 2, 2024
TidyTuesday & garden & vegetables & Data Visualization
Cheese colors for this week’s #TidyTuesday Code on GitHub
TidyTuesday 2024/22
June 2, 2024
TidyTuesday & garden & vegetables & Data Visualization
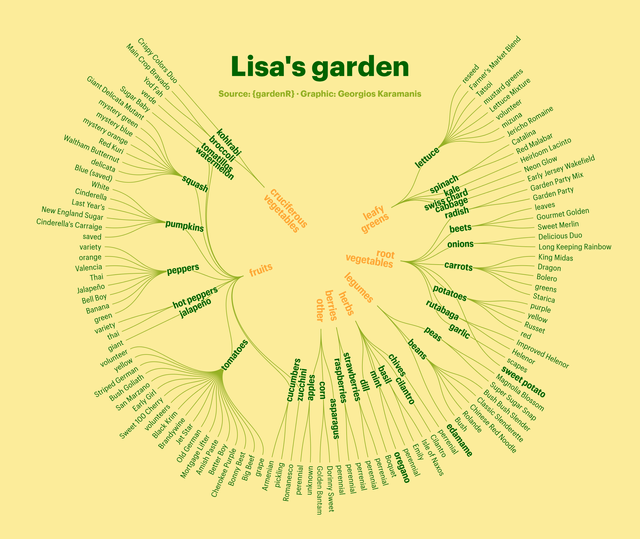 Lisa’s vegetable garden for this week’s #TidyTuesday Code on GitHub
TidyTuesday 2024/21
May 26, 2024
coal & TidyTuesday & gray & Data Visualization
Lisa’s vegetable garden for this week’s #TidyTuesday Code on GitHub
TidyTuesday 2024/21
May 26, 2024
coal & TidyTuesday & gray & Data Visualization
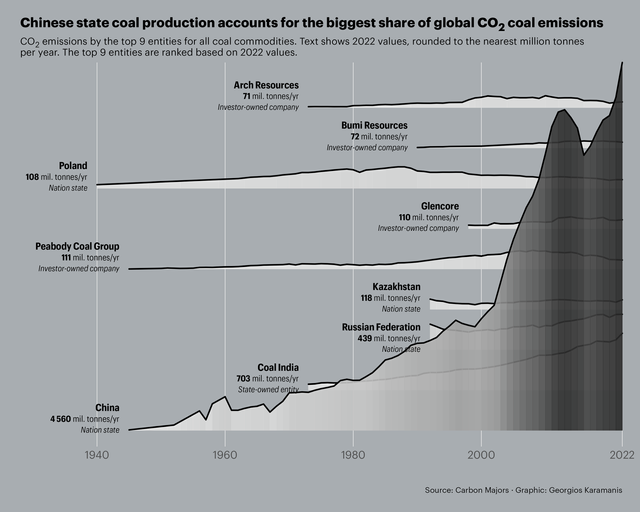 Coal CO₂ emissions for this week’s #TidyTuesday Code on GitHub
TidyTuesday 2024/20
May 19, 2024
coffee & TidyTuesday & Data Visualization
Coal CO₂ emissions for this week’s #TidyTuesday Code on GitHub
TidyTuesday 2024/20
May 19, 2024
coffee & TidyTuesday & Data Visualization
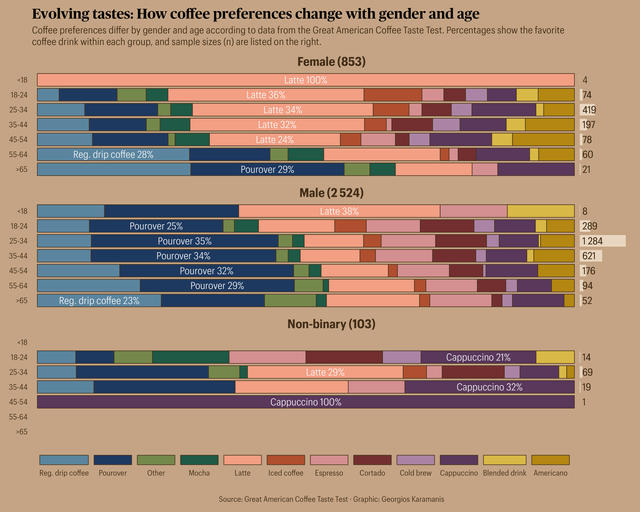 Coffee preferences by gender and age for this week’s #TidyTuesday Code on GitHub
TidyTuesday 2024/19
May 9, 2024
Rolling Stone & music & TidyTuesday & Data Visualization
Coffee preferences by gender and age for this week’s #TidyTuesday Code on GitHub
TidyTuesday 2024/19
May 9, 2024
Rolling Stone & music & TidyTuesday & Data Visualization
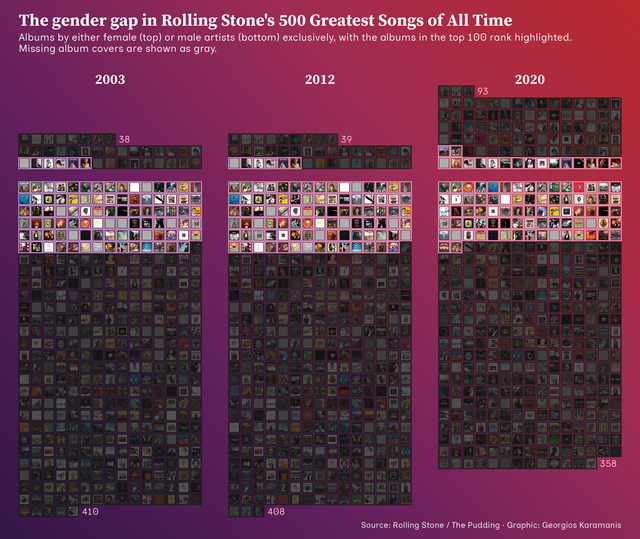 The gender gap in Rolling Stone’s 500 greatest songs for this week’s #TidyTuesday Code on GitHub
TidyTuesday 2024/18
May 5, 2024
TidyTuesday & World Bank & economy & Data Visualization
The gender gap in Rolling Stone’s 500 greatest songs for this week’s #TidyTuesday Code on GitHub
TidyTuesday 2024/18
May 5, 2024
TidyTuesday & World Bank & economy & Data Visualization
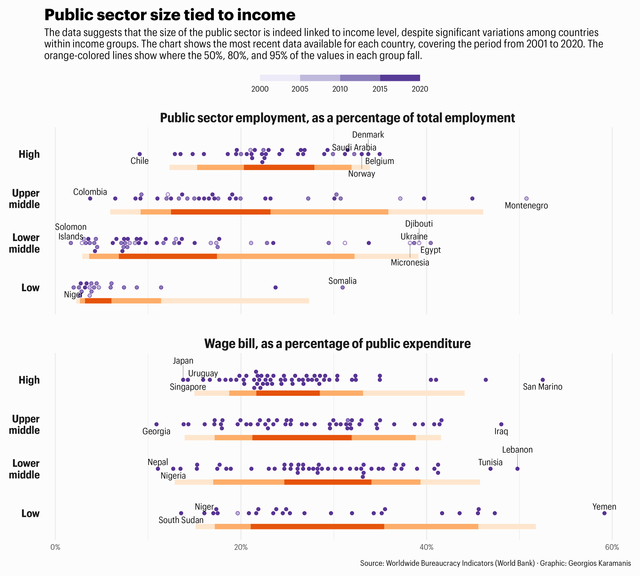 For this week’s #TidyTuesday I made a different version of Pamela Jakiela’s charts at
30DayChartChallenge 2024
April 29, 2024
30DayChartChallenge & Olympic games & women & sports & map & cities & pool & water & AI & injuries & twins & heatmap & metro & Paris & dinosaur & LGBT & Tokyo & Data Visualization
For this week’s #TidyTuesday I made a different version of Pamela Jakiela’s charts at
30DayChartChallenge 2024
April 29, 2024
30DayChartChallenge & Olympic games & women & sports & map & cities & pool & water & AI & injuries & twins & heatmap & metro & Paris & dinosaur & LGBT & Tokyo & Data Visualization
 Day 1, part-to-whole Day 2, neo Day 3, makeover Day 4. waffle Day 5, diverging Day 6, OECD Day 7, hazards Day 8, circular Day 9,
TidyTuesday 2024/17
April 26, 2024
TidyTuesday & space & Data Visualization
Day 1, part-to-whole Day 2, neo Day 3, makeover Day 4. waffle Day 5, diverging Day 6, OECD Day 7, hazards Day 8, circular Day 9,
TidyTuesday 2024/17
April 26, 2024
TidyTuesday & space & Data Visualization
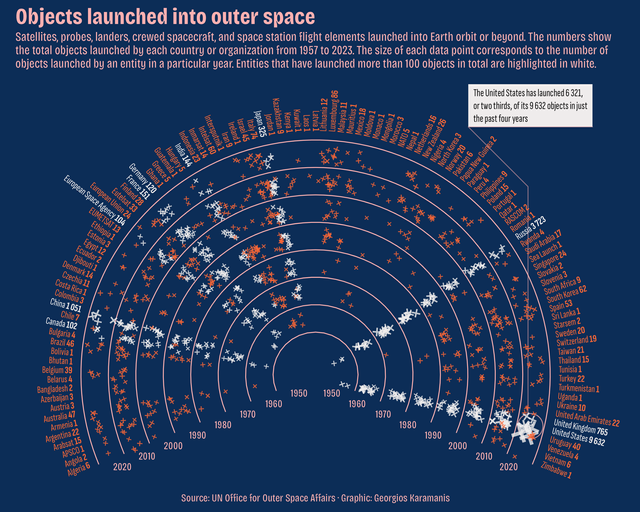 Objects launched into outer space for this week’s #TidyTuesday Code on GitHub
TidyTuesday 2024/16
April 21, 2024
R & Shiny & CRAN & TidyTuesday & Data Visualization
Objects launched into outer space for this week’s #TidyTuesday Code on GitHub
TidyTuesday 2024/16
April 21, 2024
R & Shiny & CRAN & TidyTuesday & Data Visualization
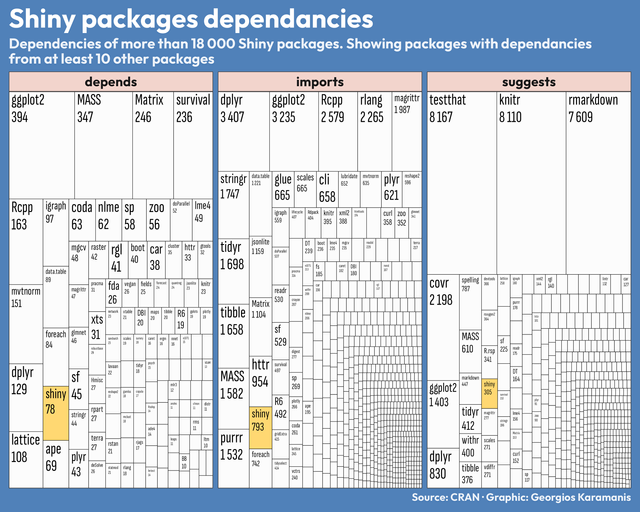 Shiny packages dependencies for this week’s #TidyTuesday Code on GitHub
TidyTuesday 2024/15
April 8, 2024
map & US & eclipse & TidyTuesday & Data Visualization & Map
Shiny packages dependencies for this week’s #TidyTuesday Code on GitHub
TidyTuesday 2024/15
April 8, 2024
map & US & eclipse & TidyTuesday & Data Visualization & Map
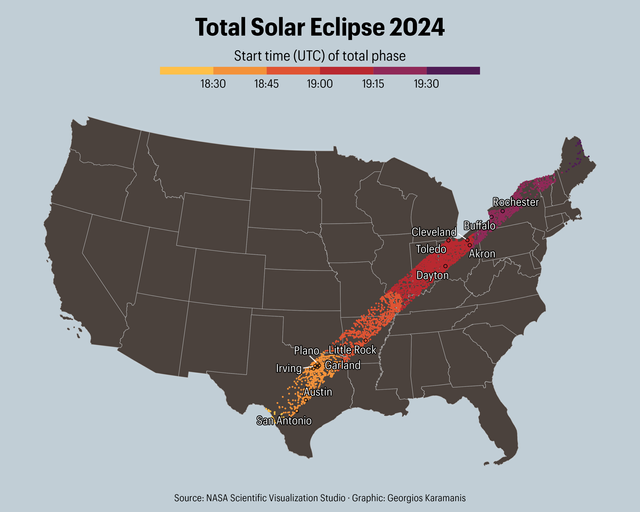 Total eclipse path for this week’s #TidyTuesday Code on GitHub
TidyTuesday 2024/14
April 7, 2024
DuBois & TidyTuesday & Data Visualization
Total eclipse path for this week’s #TidyTuesday Code on GitHub
TidyTuesday 2024/14
April 7, 2024
DuBois & TidyTuesday & Data Visualization
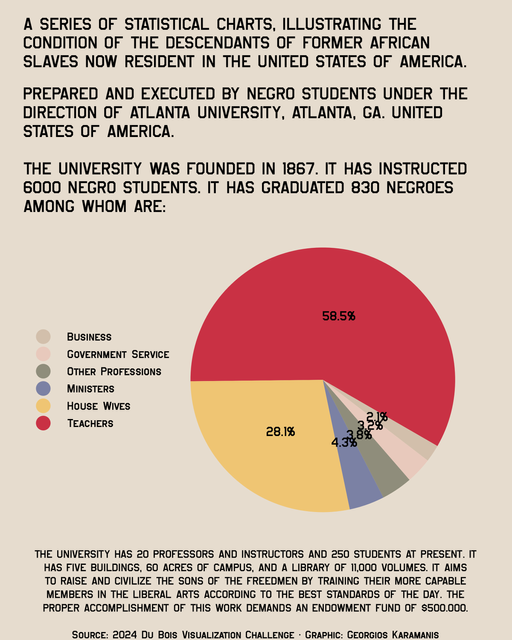 A simpler remake of W.E.B Du Bois’ plate 37 for this week’s #TidyTuesday and #DuBoisChallenge2024 Code on GitHub
TidyTuesday 2024/13
March 30, 2024
NCAA & basketball & TidyTuesday & Data Visualization
A simpler remake of W.E.B Du Bois’ plate 37 for this week’s #TidyTuesday and #DuBoisChallenge2024 Code on GitHub
TidyTuesday 2024/13
March 30, 2024
NCAA & basketball & TidyTuesday & Data Visualization
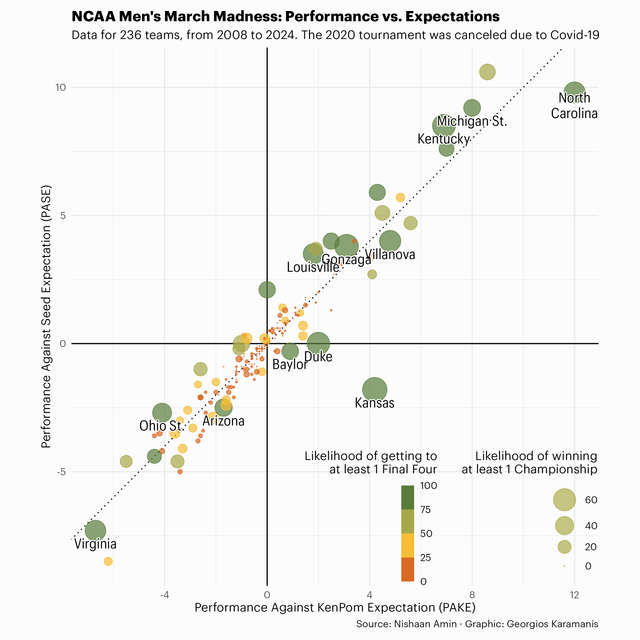 Exploring performance vs expectation for #MarchMadness teams for this week’s #TidyTuesday Code on GitHub
TidyTuesday 2024/12
March 23, 2024
table & TidyTuesday & X-Men & moneyball & Data Visualization
Exploring performance vs expectation for #MarchMadness teams for this week’s #TidyTuesday Code on GitHub
TidyTuesday 2024/12
March 23, 2024
table & TidyTuesday & X-Men & moneyball & Data Visualization
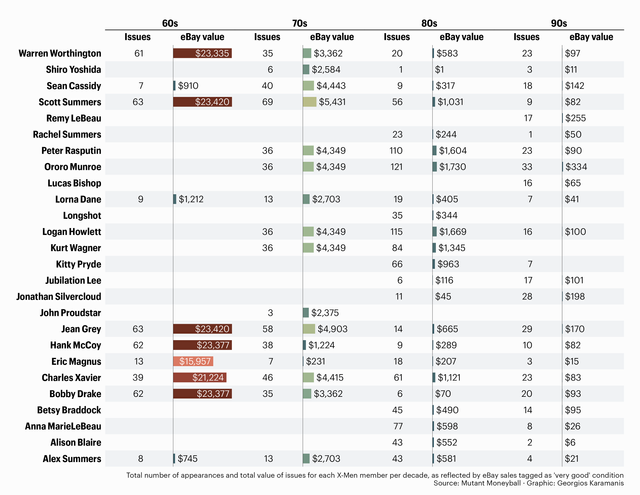 X-Men Mutant Moneyball for this week’s #TidyTuesday. Started the table with gt, then reactable and ended up making it with ggplot 😁 Code on GitHub
TidyTuesday 2024/11
March 15, 2024
LGBT & fiscal sponsors & TidyTuesday & Data Visualization
X-Men Mutant Moneyball for this week’s #TidyTuesday. Started the table with gt, then reactable and ended up making it with ggplot 😁 Code on GitHub
TidyTuesday 2024/11
March 15, 2024
LGBT & fiscal sponsors & TidyTuesday & Data Visualization
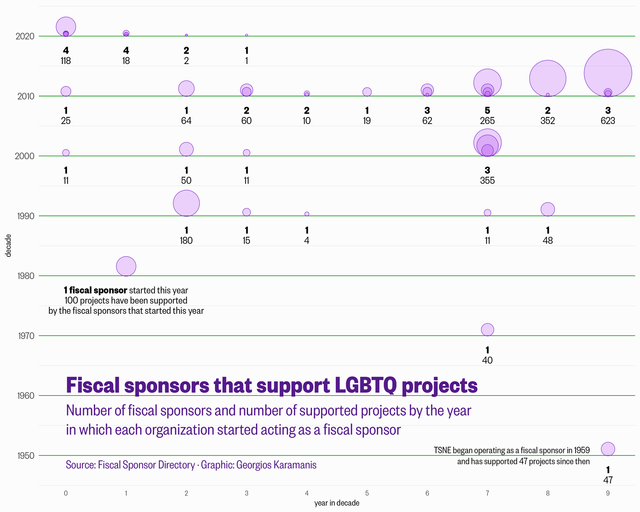 Fiscal sponsors that support LGBTQ projects for this week’s #TidyTuesday Code on GitHub
TidyTuesday 2024/10
March 8, 2024
Baltimore & TidyTuesday & Trash Wheels & polystyrene & Data Visualization
Fiscal sponsors that support LGBTQ projects for this week’s #TidyTuesday Code on GitHub
TidyTuesday 2024/10
March 8, 2024
Baltimore & TidyTuesday & Trash Wheels & polystyrene & Data Visualization
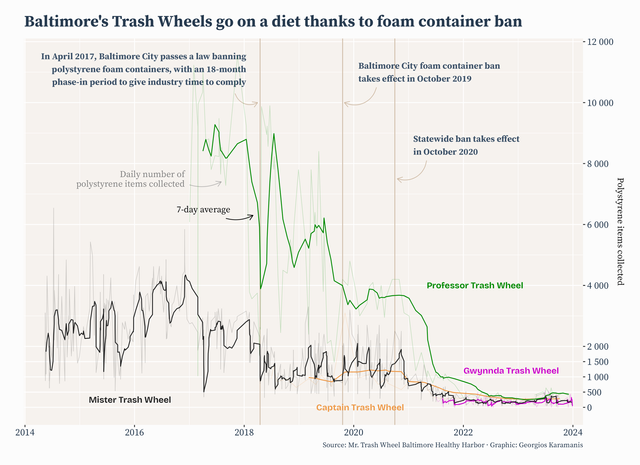 This week’s #TidyTuesday is about Baltimore’s Trash Wheels going on a diet, thanks to the foam container bans Code on GitHub
TidyTuesday 2024/09
March 3, 2024
leap day & TidyTuesday & timeline & Data Visualization
This week’s #TidyTuesday is about Baltimore’s Trash Wheels going on a diet, thanks to the foam container bans Code on GitHub
TidyTuesday 2024/09
March 3, 2024
leap day & TidyTuesday & timeline & Data Visualization
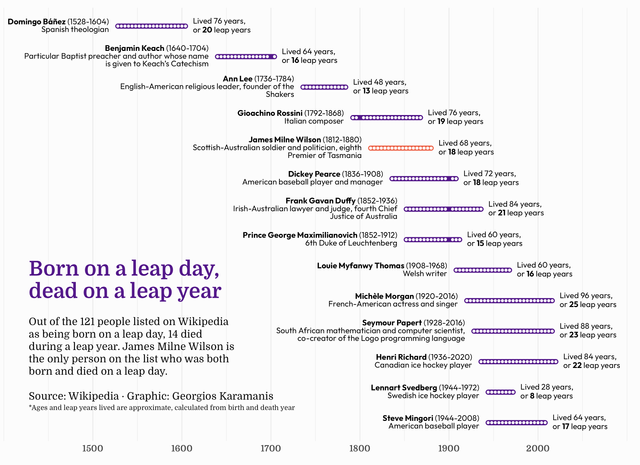 “Born on a leap day, dead on a leap year” for this week’s #TidyTuesday Code on GitHub
TidyTuesday 2024/08
February 24, 2024
TidyTuesday & treemap & ISC & grants & Data Visualization
“Born on a leap day, dead on a leap year” for this week’s #TidyTuesday Code on GitHub
TidyTuesday 2024/08
February 24, 2024
TidyTuesday & treemap & ISC & grants & Data Visualization
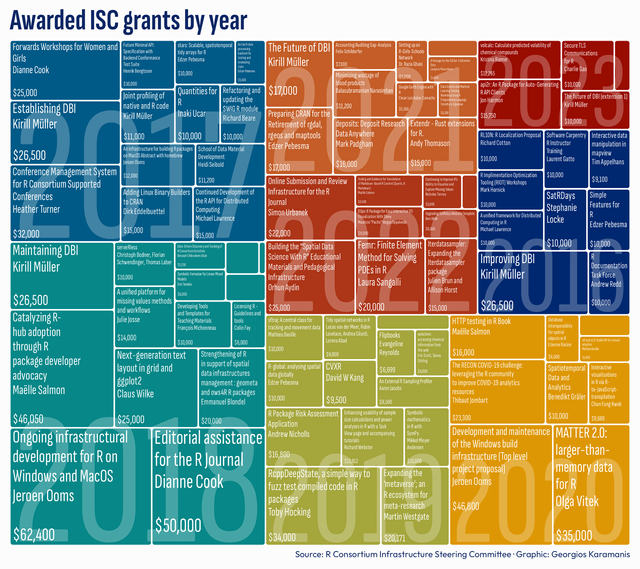 A treemap of awarded ISC grants for this week’s #TidyTuesday Code on GitHub
TidyTuesday 2024/07
February 16, 2024
heart & Valentine's & candy & TidyTuesday & Data Visualization
A treemap of awarded ISC grants for this week’s #TidyTuesday Code on GitHub
TidyTuesday 2024/07
February 16, 2024
heart & Valentine's & candy & TidyTuesday & Data Visualization
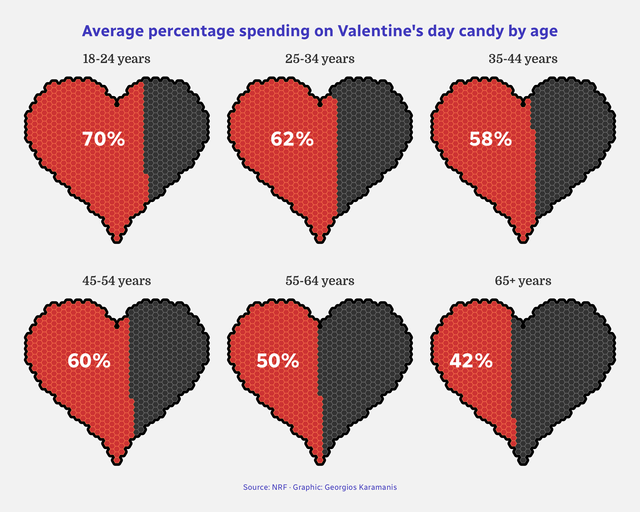 Spending on Valentine’s day candy by age for this week’s #TidyTuesday Code on GitHub
TidyTuesday 2024/06
February 11, 2024
TidyTuesday & ferdio & UNESCO & heritage & Data Visualization
Spending on Valentine’s day candy by age for this week’s #TidyTuesday Code on GitHub
TidyTuesday 2024/06
February 11, 2024
TidyTuesday & ferdio & UNESCO & heritage & Data Visualization
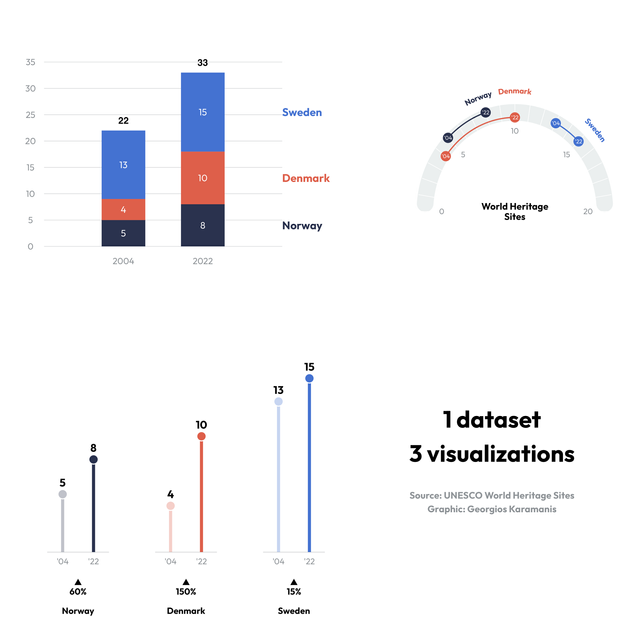 For this week’s #TidyTuesday I recreated the first three visualizations created by ferdio Code on GitHub
TidyTuesday 2024/05
February 4, 2024
table & TidyTuesday & groundhog & Data Visualization
For this week’s #TidyTuesday I recreated the first three visualizations created by ferdio Code on GitHub
TidyTuesday 2024/05
February 4, 2024
table & TidyTuesday & groundhog & Data Visualization
 Non-groundhog day for this week’s #TidyTuesday Code on GitHub
TidyTuesday 2024/04
January 28, 2024
England & education & TidyTuesday & towns & Data Visualization
Non-groundhog day for this week’s #TidyTuesday Code on GitHub
TidyTuesday 2024/04
January 28, 2024
England & education & TidyTuesday & towns & Data Visualization
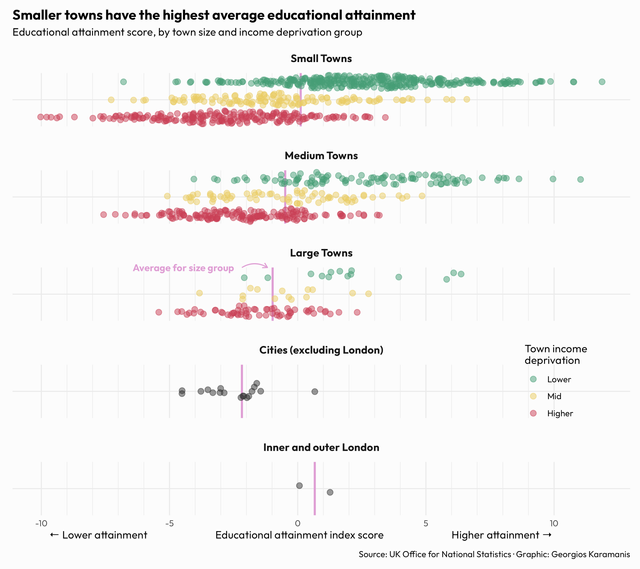 Educational attainment in England for this week’s #TidyTuesday. Idea and text from ONS’s interactive chart Code on GitHub
TidyTuesday 2024/03
January 21, 2024
US & map & TidyTuesday & missing data & Data Visualization & Map
Educational attainment in England for this week’s #TidyTuesday. Idea and text from ONS’s interactive chart Code on GitHub
TidyTuesday 2024/03
January 21, 2024
US & map & TidyTuesday & missing data & Data Visualization & Map
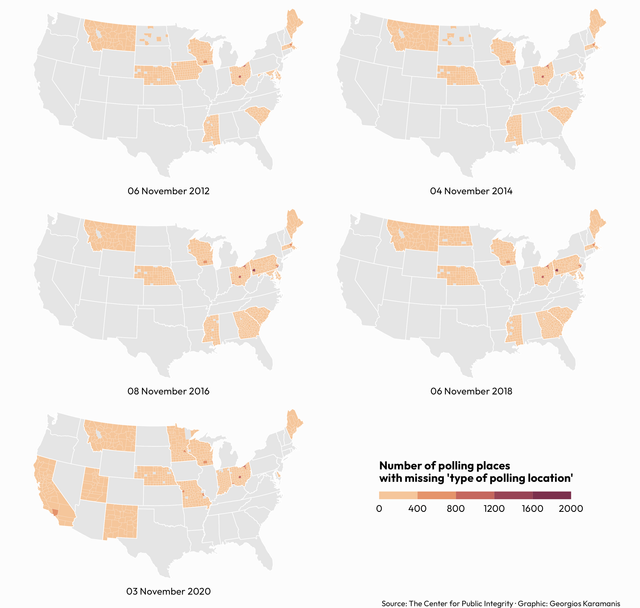 Missing data of US polling places for this week’s #TidyTuesday Code on GitHub
TidyTuesday 2024/02
January 14, 2024
TidyTuesday & hockey & NHL & flags & Data Visualization
Missing data of US polling places for this week’s #TidyTuesday Code on GitHub
TidyTuesday 2024/02
January 14, 2024
TidyTuesday & hockey & NHL & flags & Data Visualization
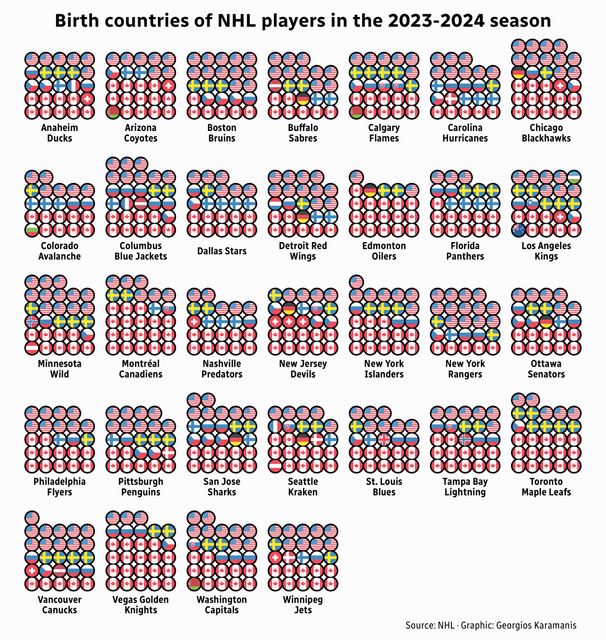 NHL birth countries for this week’s #TidyTuesday Code on GitHub
TidyTuesday 2023/52
December 31, 2023
TidyTuesday & network & ggplot2 & R & Data Visualization
NHL birth countries for this week’s #TidyTuesday Code on GitHub
TidyTuesday 2023/52
December 31, 2023
TidyTuesday & network & ggplot2 & R & Data Visualization
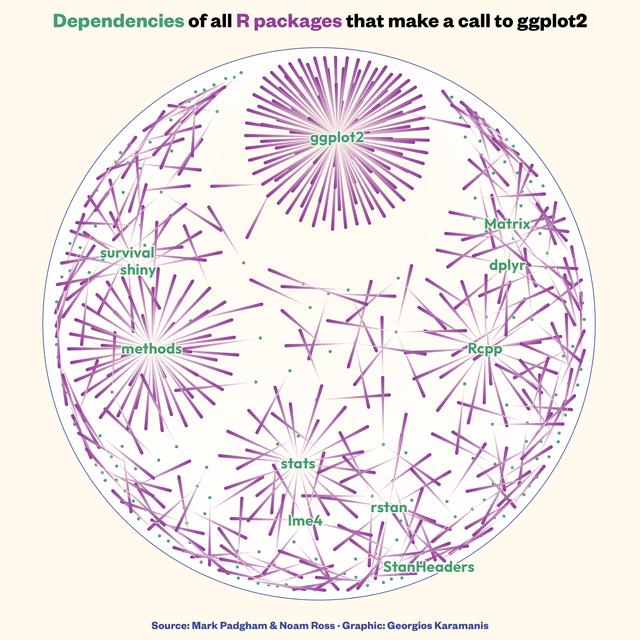 For this week’s #TidyTuesday I made a network graph of the dependencies of all R packages that make a call to ggplot2 Code on GitHub
TidyTuesday 2023/51
December 22, 2023
TV & holidays & IMDB & TidyTuesday & Data Visualization
For this week’s #TidyTuesday I made a network graph of the dependencies of all R packages that make a call to ggplot2 Code on GitHub
TidyTuesday 2023/51
December 22, 2023
TV & holidays & IMDB & TidyTuesday & Data Visualization
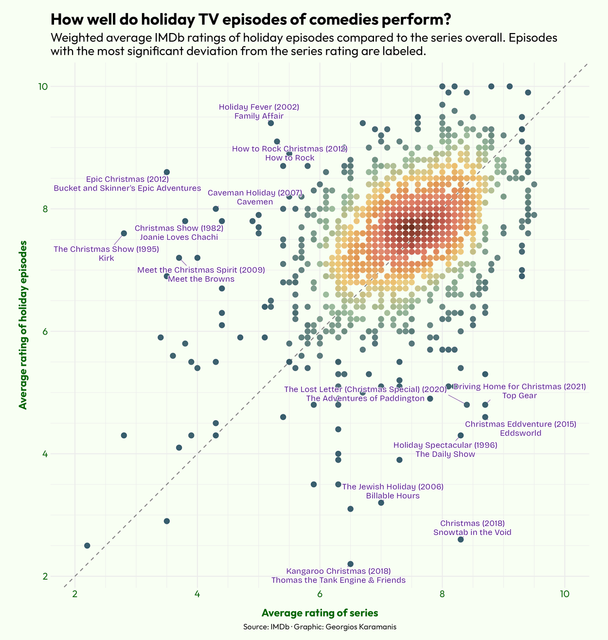 Holiday TV episode ratings for this week’s #TidyTuesday. In general, holiday episodes of comedies seem to be rated similarly to or slightly higher
TidyTuesday 2023/50
December 15, 2023
holidays & movies & TidyTuesday & Data Visualization
Holiday TV episode ratings for this week’s #TidyTuesday. In general, holiday episodes of comedies seem to be rated similarly to or slightly higher
TidyTuesday 2023/50
December 15, 2023
holidays & movies & TidyTuesday & Data Visualization
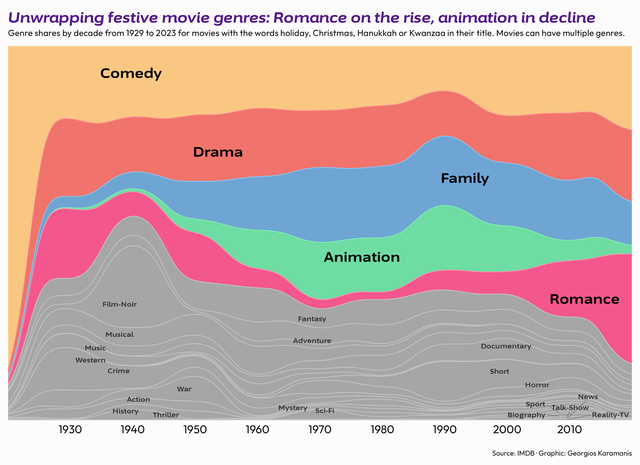 Trends in holiday movie genres for this week’s #TidyTuesday Code on GitHub
TidyTuesday 2023/49
December 8, 2023
world & map & TidyTuesday & life expectancy & Data Visualization & Map
Trends in holiday movie genres for this week’s #TidyTuesday Code on GitHub
TidyTuesday 2023/49
December 8, 2023
world & map & TidyTuesday & life expectancy & Data Visualization & Map
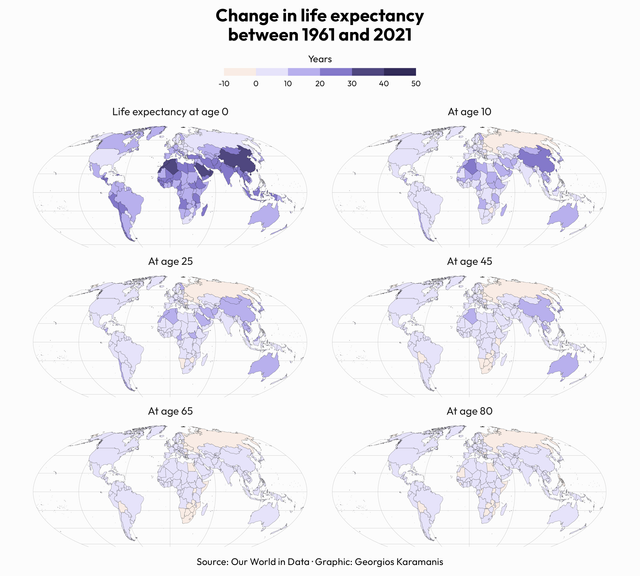 Life expectancy for this week’s #TidyTuesday with data from Our World in Data Code on GitHub
TidyTuesday 2023/48
December 3, 2023
Doctor Who & TV & TidyTuesday & network & biofabric & Data Visualization
Life expectancy for this week’s #TidyTuesday with data from Our World in Data Code on GitHub
TidyTuesday 2023/48
December 3, 2023
Doctor Who & TV & TidyTuesday & network & biofabric & Data Visualization
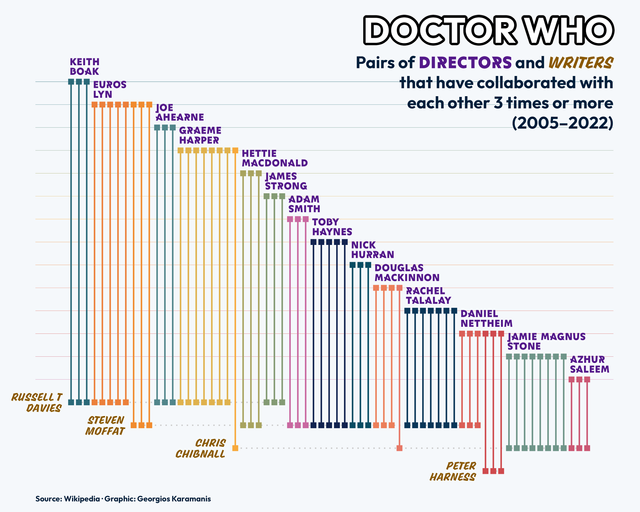 For this week’s #TidyTuesday I made a BioFabric network plot with {ggraph}
TidyTuesday 2023/47
November 24, 2023
R-Ladies & animation & map & TidyTuesday & Data Visualization & Video
R-Ladies events for this week’s #TidyTuesday. This might be the first animation with {gganimate} I ever share! Code on GitHub Video Block
TidyTuesday 2023/46
November 19, 2023
Diwali & TidyTuesday & Data Visualization
For this week’s #TidyTuesday I made a BioFabric network plot with {ggraph}
TidyTuesday 2023/47
November 24, 2023
R-Ladies & animation & map & TidyTuesday & Data Visualization & Video
R-Ladies events for this week’s #TidyTuesday. This might be the first animation with {gganimate} I ever share! Code on GitHub Video Block
TidyTuesday 2023/46
November 19, 2023
Diwali & TidyTuesday & Data Visualization
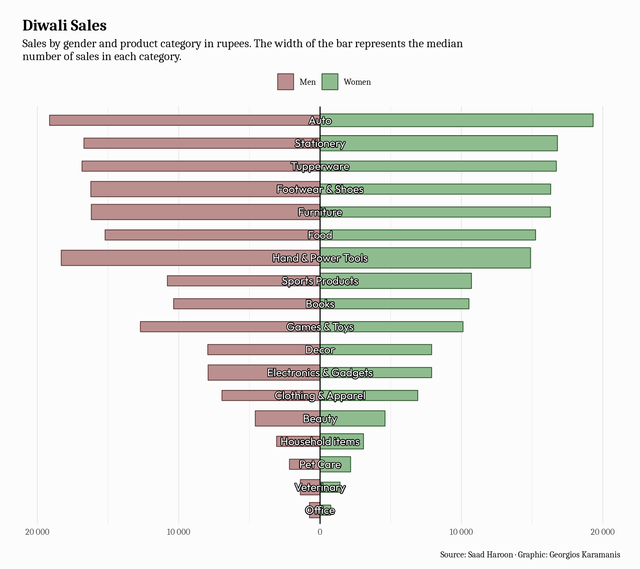 Diwali sales for this week’s #TidyTuesday Code on GitHub
TidyTuesday 2023/45
November 10, 2023
US & elections & map & Data Visualization & Map
Diwali sales for this week’s #TidyTuesday Code on GitHub
TidyTuesday 2023/45
November 10, 2023
US & elections & map & Data Visualization & Map
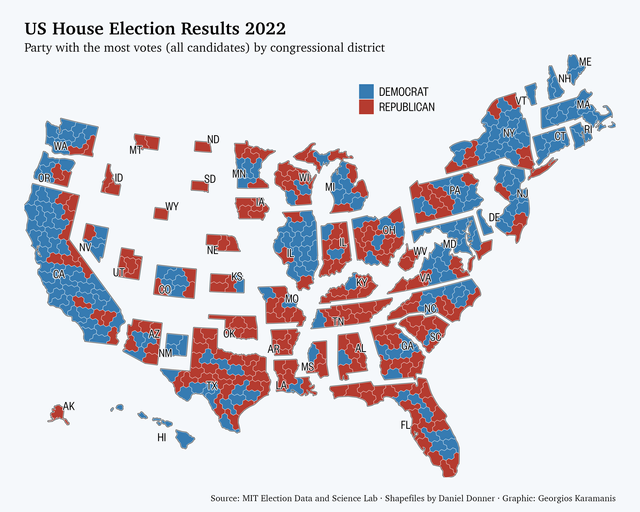 US House elections for this week’s #TidyTuesday. Used v 3.0 of the congressional district hexmap by Daniel Donner available at https://dkel.ec/map
TidyTuesday 2023/44
November 5, 2023
Snopes & horror & halloween & TidyTuesday & network & Data Visualization
US House elections for this week’s #TidyTuesday. Used v 3.0 of the congressional district hexmap by Daniel Donner available at https://dkel.ec/map
TidyTuesday 2023/44
November 5, 2023
Snopes & horror & halloween & TidyTuesday & network & Data Visualization
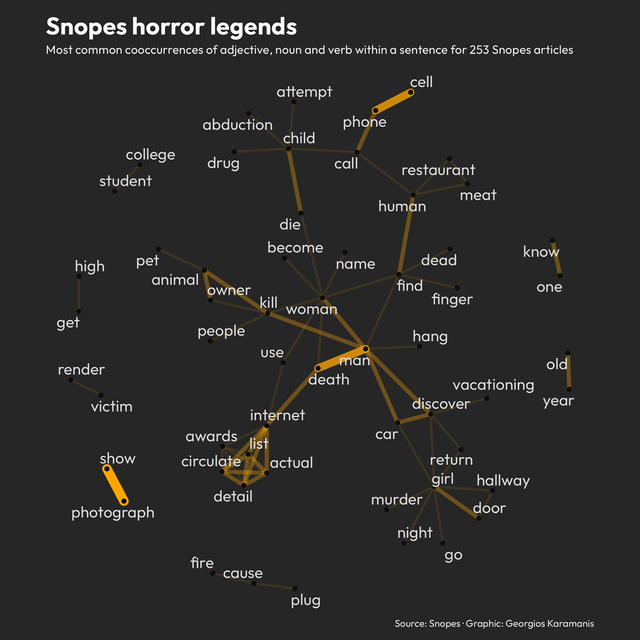 Word cooccurrences in Snopes articles for this week’s #TidyTuesday Code on GitHub
30DayMapChallenge 2023
November 1, 2023
30DayMapChallenge & LGBT & map & world & Data Visualization & Map
Word cooccurrences in Snopes articles for this week’s #TidyTuesday Code on GitHub
30DayMapChallenge 2023
November 1, 2023
30DayMapChallenge & LGBT & map & world & Data Visualization & Map
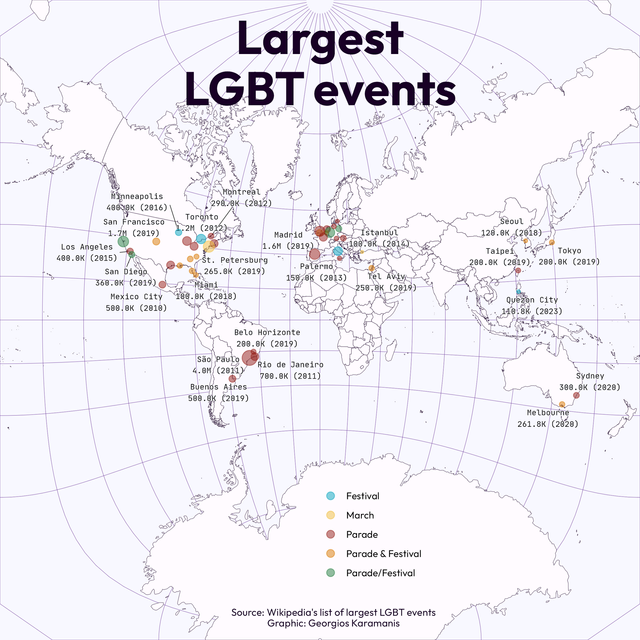 Code on GitHub Day 1, Points Wikipedia’s list of largest #LGBT events. Latest event shown for cities with multiple events. Attendance according to
TidyTuesday 2023/43
October 29, 2023
TidyTuesday & heatmap & simulated & Data Visualization
Code on GitHub Day 1, Points Wikipedia’s list of largest #LGBT events. Latest event shown for cities with multiple events. Attendance according to
TidyTuesday 2023/43
October 29, 2023
TidyTuesday & heatmap & simulated & Data Visualization
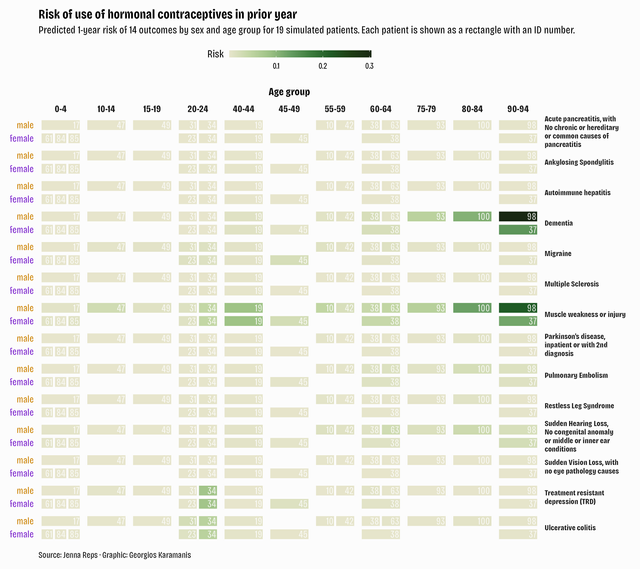 Patient risk profiles for this week’s #TidyTuesday Code on GitHub
TidyTuesday 2023/42
October 20, 2023
Taylor Swift & music & Spotify & TidyTuesday & Data Visualization
Patient risk profiles for this week’s #TidyTuesday Code on GitHub
TidyTuesday 2023/42
October 20, 2023
Taylor Swift & music & Spotify & TidyTuesday & Data Visualization
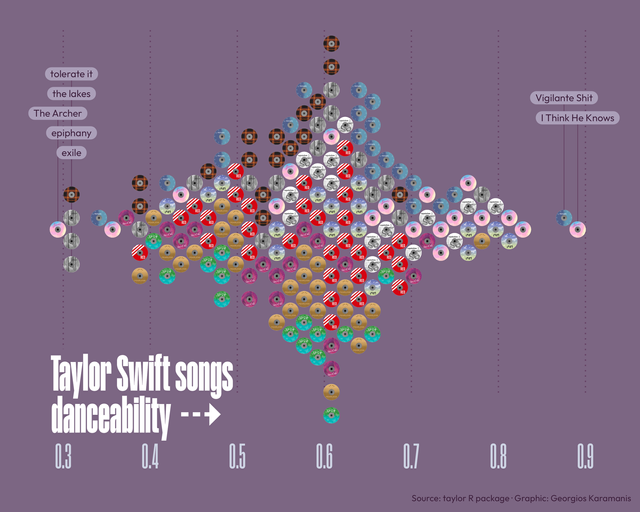 Danceability of Taylor Swift songs for this week’s #TidyTuesday Code on GitHub
TidyTuesday 2023/41
October 15, 2023
US & map & TidyTuesday & haunted & halloween & Data Visualization
Danceability of Taylor Swift songs for this week’s #TidyTuesday Code on GitHub
TidyTuesday 2023/41
October 15, 2023
US & map & TidyTuesday & haunted & halloween & Data Visualization
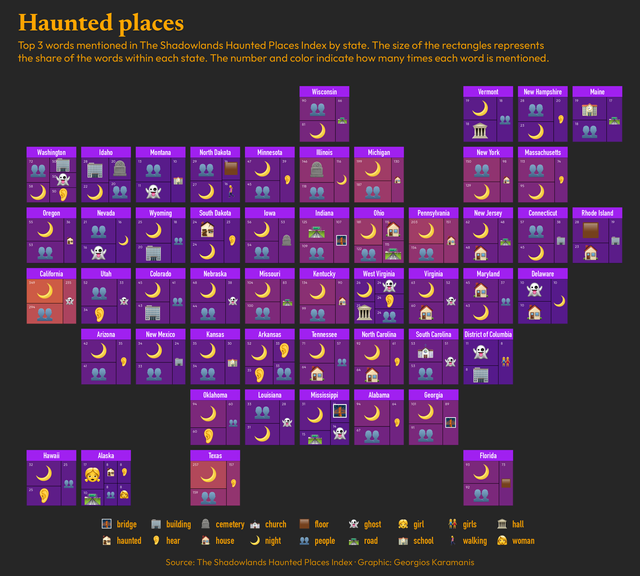 Haunted US places for this week’s #TidyTuesday Code on GitHub
TidyTuesday 2023/40
October 8, 2023
grants & US & TidyTuesday & Data Visualization
Haunted US places for this week’s #TidyTuesday Code on GitHub
TidyTuesday 2023/40
October 8, 2023
grants & US & TidyTuesday & Data Visualization
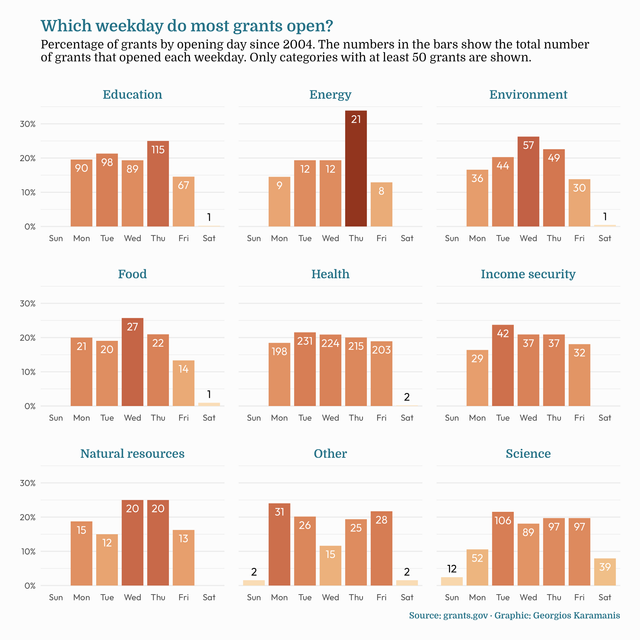 Opening weekdays of federal grants for this week’s #TidyTuesday Code on GitHub
TidyTuesday 2023/39
October 1, 2023
Roy Kent & Ted Lasso & TidyTuesday & fuck & Richmond & Data Visualization
Opening weekdays of federal grants for this week’s #TidyTuesday Code on GitHub
TidyTuesday 2023/39
October 1, 2023
Roy Kent & Ted Lasso & TidyTuesday & fuck & Richmond & Data Visualization
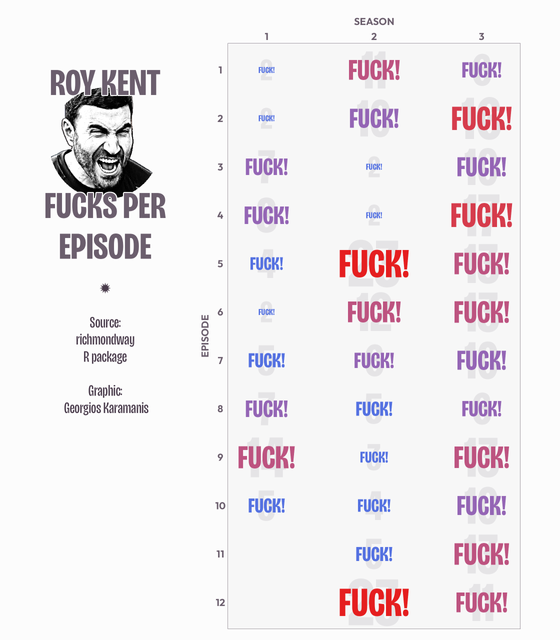 Roy Kent F**k count for this week’s #TidyTuesday Code on GitHub
TidyTuesday 2023/38
September 24, 2023
TidyTuesday & CRAN & Data Visualization
Roy Kent F**k count for this week’s #TidyTuesday Code on GitHub
TidyTuesday 2023/38
September 24, 2023
TidyTuesday & CRAN & Data Visualization
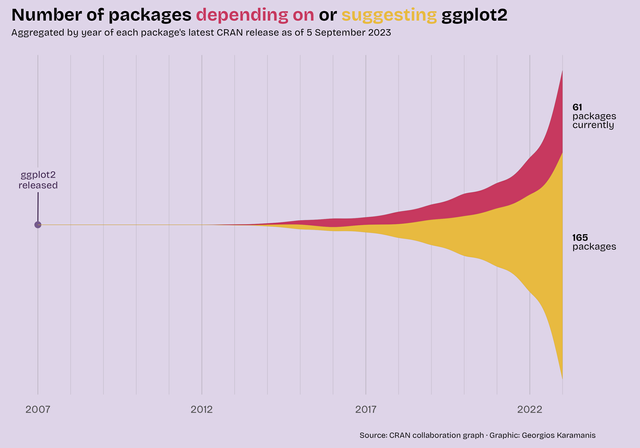 A quick plot for this week’s #TidyTuesday, showing the number of CRAN packages depending on/suggesting ggplot2. I later realized I wasn’t working
TidyTuesday 2023/37
September 12, 2023
meals & Europe & TidyTuesday & map & Data Visualization
A quick plot for this week’s #TidyTuesday, showing the number of CRAN packages depending on/suggesting ggplot2. I later realized I wasn’t working
TidyTuesday 2023/37
September 12, 2023
meals & Europe & TidyTuesday & map & Data Visualization
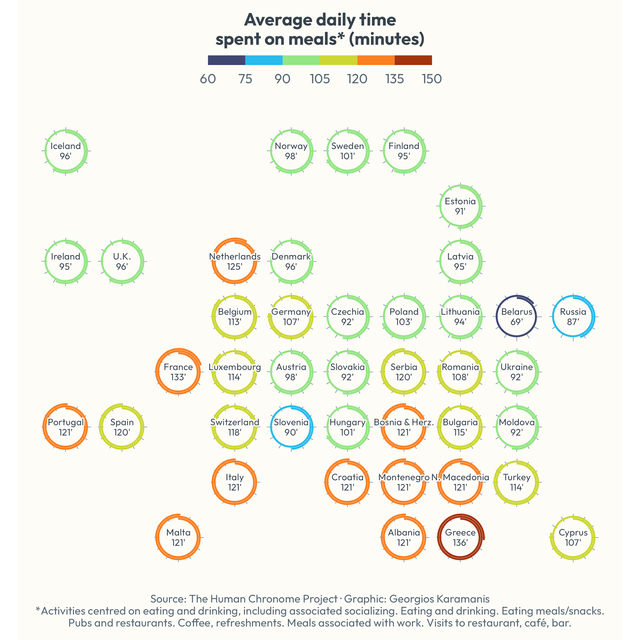 Daily time spent on meals in European countries for this week’s #TidyTuesday Code on GitHub
TidyTuesday 2023/36
September 8, 2023
unions & US & TidyTuesday & Data Visualization
Daily time spent on meals in European countries for this week’s #TidyTuesday Code on GitHub
TidyTuesday 2023/36
September 8, 2023
unions & US & TidyTuesday & Data Visualization
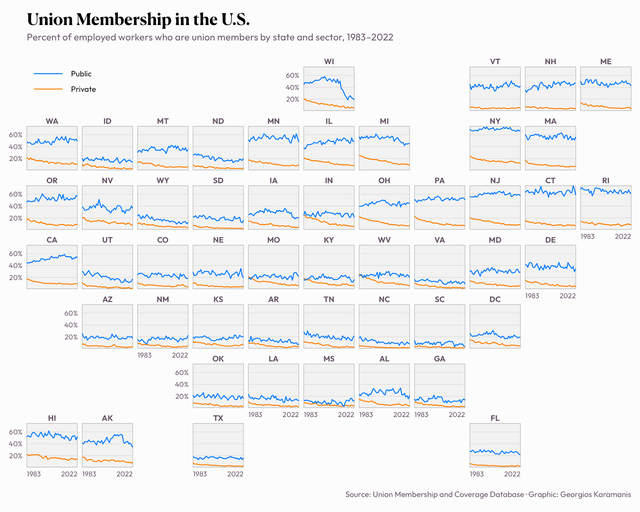 Union Membership in the U.S. for this week’s #TidyTuesday Code on GitHub
TidyTuesday 2023/35
September 3, 2023
fair use & US & parliament & TidyTuesday & Data Visualization
Union Membership in the U.S. for this week’s #TidyTuesday Code on GitHub
TidyTuesday 2023/35
September 3, 2023
fair use & US & parliament & TidyTuesday & Data Visualization
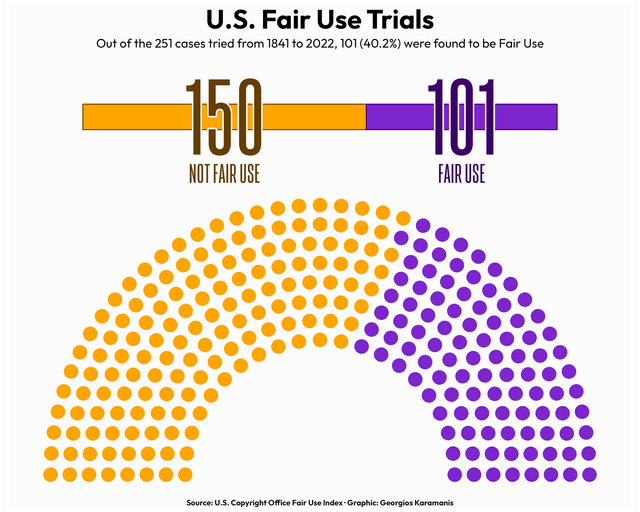 US fair use cases for this week’s #TidyTuesday Code on GitHub
TidyTuesday 2023/34
August 27, 2023
refugees & UNHCR & TidyTuesday & Data Visualization
US fair use cases for this week’s #TidyTuesday Code on GitHub
TidyTuesday 2023/34
August 27, 2023
refugees & UNHCR & TidyTuesday & Data Visualization
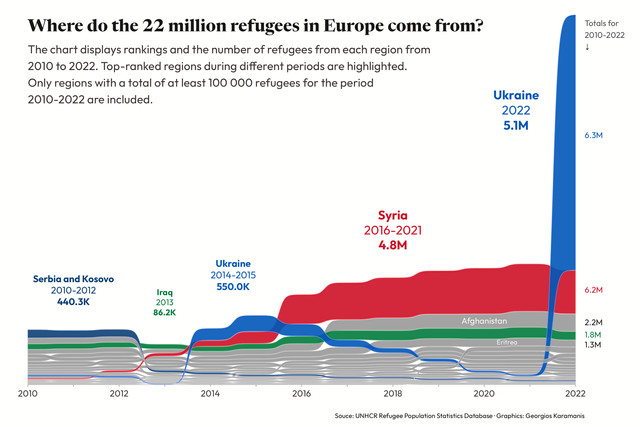 Refugees in Europe for this week’s #TidyTuesday. Alluvial bump chart made with ggsankey with data from UNHCR Refugee Population Statistics Database
TidyTuesday 2023/33
August 20, 2023
spam & TidyTuesday & Data Visualization
Refugees in Europe for this week’s #TidyTuesday. Alluvial bump chart made with ggsankey with data from UNHCR Refugee Population Statistics Database
TidyTuesday 2023/33
August 20, 2023
spam & TidyTuesday & Data Visualization
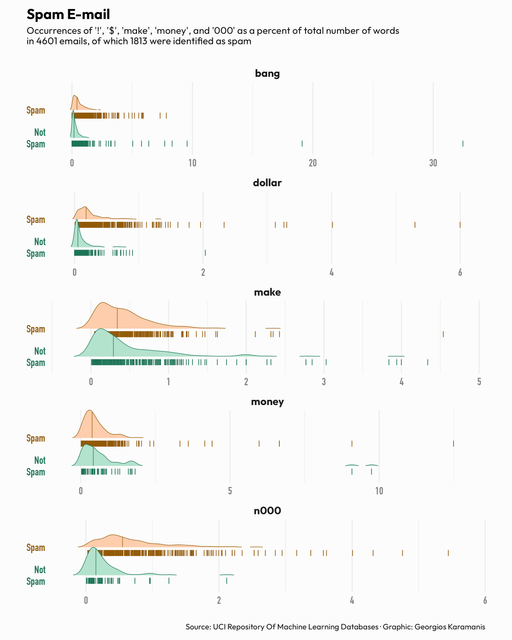 Spam email for this week’s #TidyTuesday Code on GitHub
MapPromptMonday 2023/30
August 14, 2023
Earth & MapPromptMonday & Data Visualization & Map
Spam email for this week’s #TidyTuesday Code on GitHub
MapPromptMonday 2023/30
August 14, 2023
Earth & MapPromptMonday & Data Visualization & Map
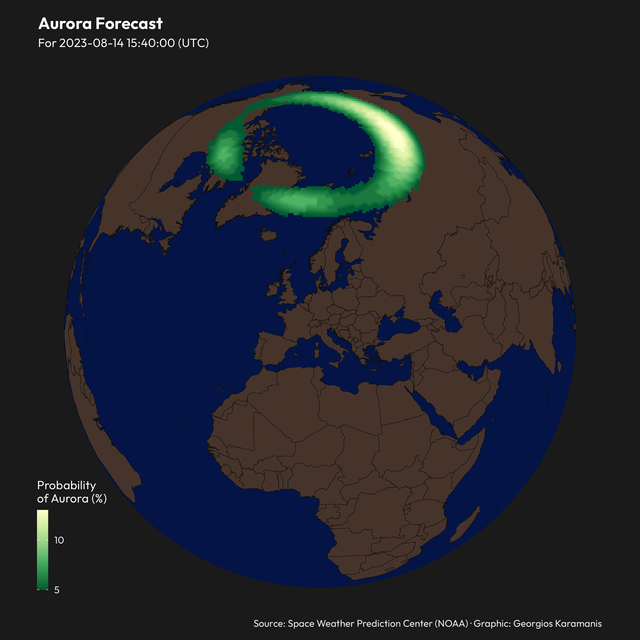 Aurora forecast for the week of July 24-30 of #MapPromptMonday, Natural Wonders Code on GitHub
TidyTuesday 2023/32
August 13, 2023
TV & TidyTuesday & Data Visualization
Aurora forecast for the week of July 24-30 of #MapPromptMonday, Natural Wonders Code on GitHub
TidyTuesday 2023/32
August 13, 2023
TV & TidyTuesday & Data Visualization
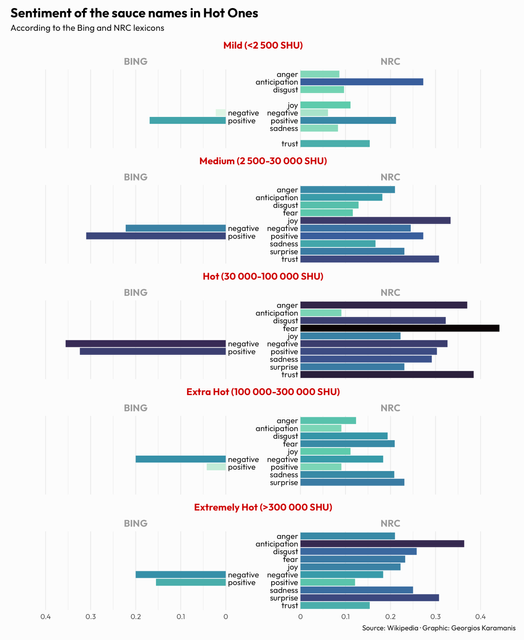 Sentiment of sauce names in Hot Ones for this week’s #TidyTuesday Code on GitHub
MapPromptMonday 2023/29
August 6, 2023
chocolate & Europe & map & MapPromptMonday & Data Visualization & Map
Sentiment of sauce names in Hot Ones for this week’s #TidyTuesday Code on GitHub
MapPromptMonday 2023/29
August 6, 2023
chocolate & Europe & map & MapPromptMonday & Data Visualization & Map
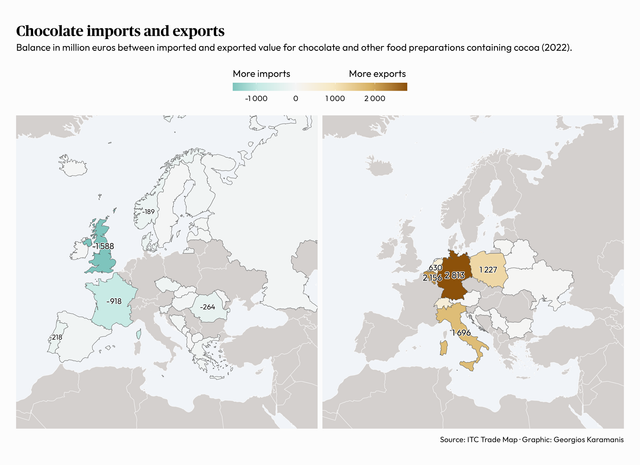 Chocolate trade balance for the week of July 17-23 of #MapPromptMonday, Desserts Code on GitHub
TidyTuesday 2023/31
August 2, 2023
US & states & distance & cities & TidyTuesday & map & Data Visualization & Map
Chocolate trade balance for the week of July 17-23 of #MapPromptMonday, Desserts Code on GitHub
TidyTuesday 2023/31
August 2, 2023
US & states & distance & cities & TidyTuesday & map & Data Visualization & Map
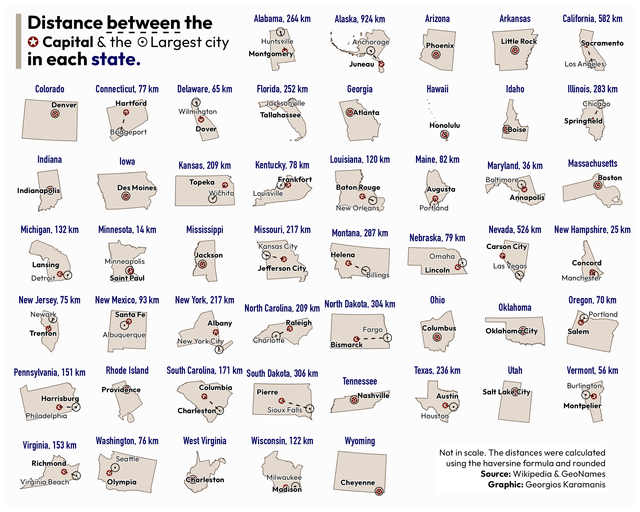 Distance between the capital and the largest city in each state for this week’s #TidyTuesday Code on GitHub
MapPromptMonday 2023/27
July 30, 2023
ice & Europe & MapPromptMonday & Data Visualization & Map
Distance between the capital and the largest city in each state for this week’s #TidyTuesday Code on GitHub
MapPromptMonday 2023/27
July 30, 2023
ice & Europe & MapPromptMonday & Data Visualization & Map
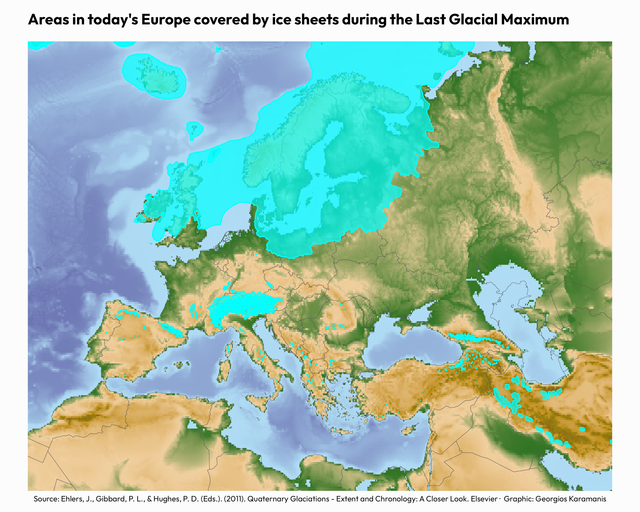 Areas in today’s Europe covered by ice during LGM for the week of 3-10 July of #MapPromptMonday, Snow or Ice Shapefiles for the ice sheets Code on
TidyTuesday 2023/30
July 25, 2023
scurvy & TidyTuesday & heatmap & Data Visualization
Areas in today’s Europe covered by ice during LGM for the week of 3-10 July of #MapPromptMonday, Snow or Ice Shapefiles for the ice sheets Code on
TidyTuesday 2023/30
July 25, 2023
scurvy & TidyTuesday & heatmap & Data Visualization
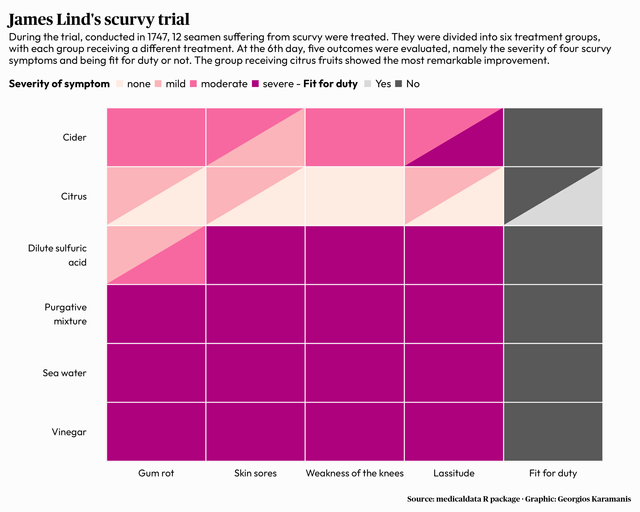 James Lind’s scurvy trial for this week’s #TidyTuesday Code on GitHub
MapPromptMonday 2023/26
July 23, 2023
cherry & map & europe & MapPromptMonday & Data Visualization & Map
James Lind’s scurvy trial for this week’s #TidyTuesday Code on GitHub
MapPromptMonday 2023/26
July 23, 2023
cherry & map & europe & MapPromptMonday & Data Visualization & Map
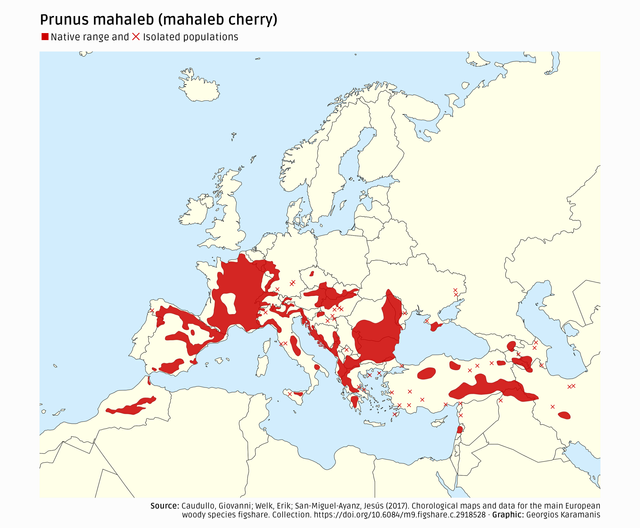 Distribution of the mahaleb cherry for the week of 26 June-2 July of #MapPromptMonday, Plants Code on GitHub
TidyTuesday 2023/29
July 21, 2023
GPT & distribution & probability & AI & TidyTuesday & Data Visualization
Distribution of the mahaleb cherry for the week of 26 June-2 July of #MapPromptMonday, Plants Code on GitHub
TidyTuesday 2023/29
July 21, 2023
GPT & distribution & probability & AI & TidyTuesday & Data Visualization
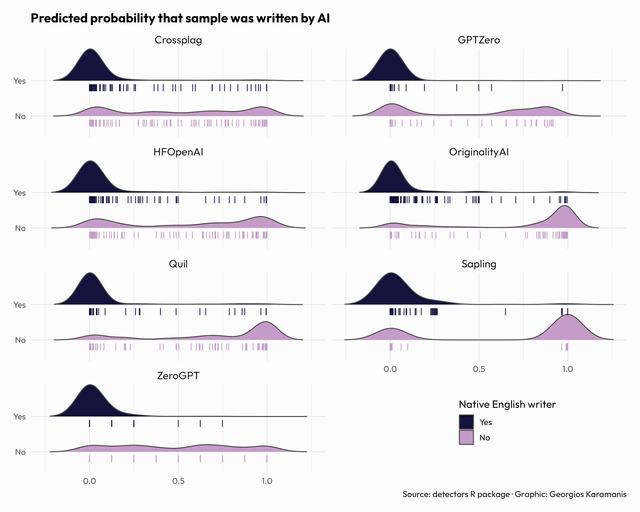 GPT detectors for this week’s #TidyTuesday. A different version of Simon’s plot Code on GitHub
TidyTuesday 2023/28
July 14, 2023
temperature & polar & TidyTuesday & Data Visualization
GPT detectors for this week’s #TidyTuesday. A different version of Simon’s plot Code on GitHub
TidyTuesday 2023/28
July 14, 2023
temperature & polar & TidyTuesday & Data Visualization
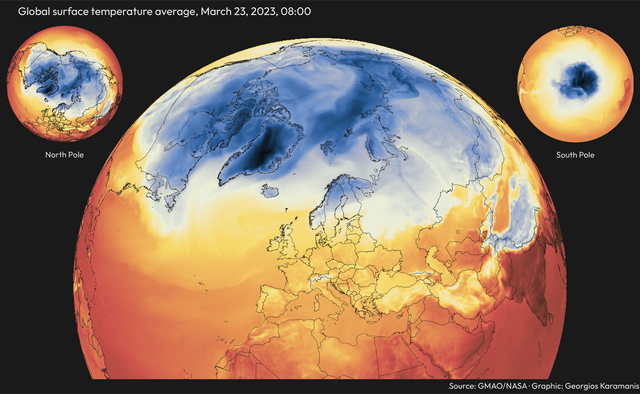
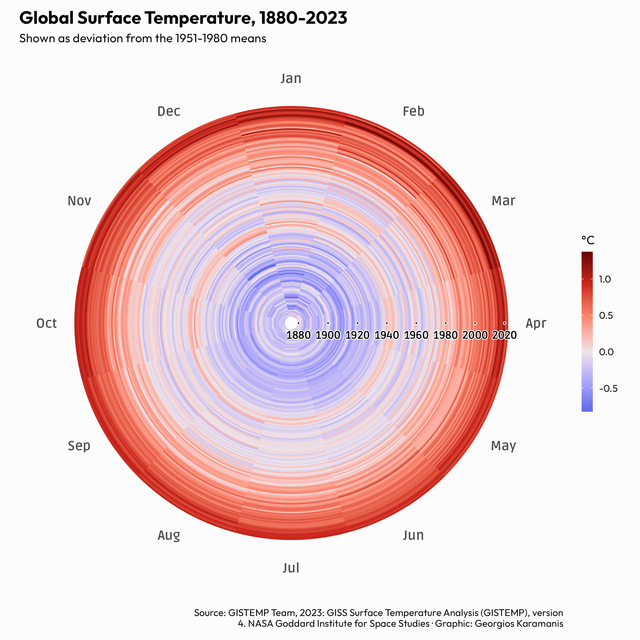 Global surface temperature for this week’s #TidyTuesday Code on GitHub
TidyTuesday 2023/27
July 9, 2023
US & map & TidyTuesday & historical markers & Data Visualization & Map
Global surface temperature for this week’s #TidyTuesday Code on GitHub
TidyTuesday 2023/27
July 9, 2023
US & map & TidyTuesday & historical markers & Data Visualization & Map
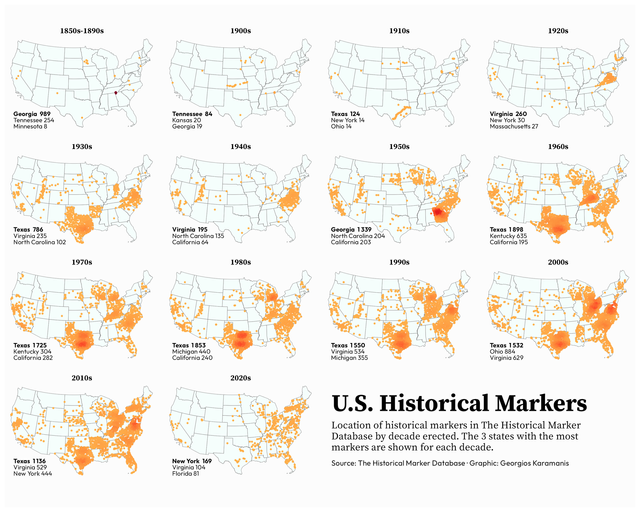 US historical markers for this week’s #TidyTuesday Code on GitHub
MapPromptMonday 2023/25
July 8, 2023
sunset & solstice & Europe & MapPromptMonday & Data Visualization & Map
US historical markers for this week’s #TidyTuesday Code on GitHub
MapPromptMonday 2023/25
July 8, 2023
sunset & solstice & Europe & MapPromptMonday & Data Visualization & Map
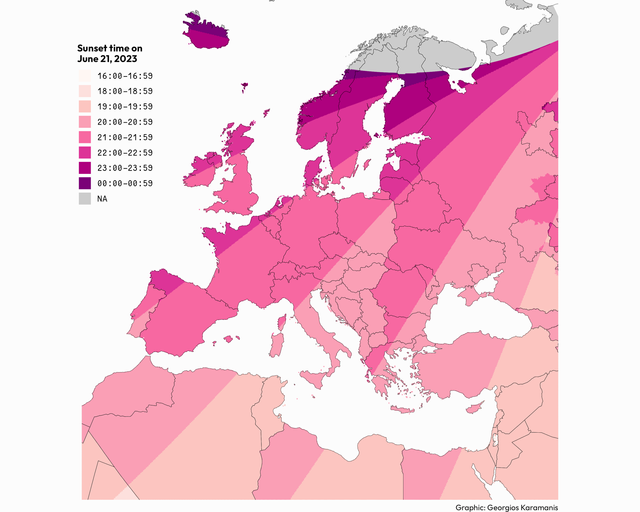 Sunset times on June 21, 2023 for the week of 19-25 June of #MapPromptMonday, Solstice/Seasons Original idea by Brian Brettschneider Code on GitHub
TidyTuesday 2023/26
June 30, 2023
US & beach & places & map & TidyTuesday & Data Visualization
Sunset times on June 21, 2023 for the week of 19-25 June of #MapPromptMonday, Solstice/Seasons Original idea by Brian Brettschneider Code on GitHub
TidyTuesday 2023/26
June 30, 2023
US & beach & places & map & TidyTuesday & Data Visualization
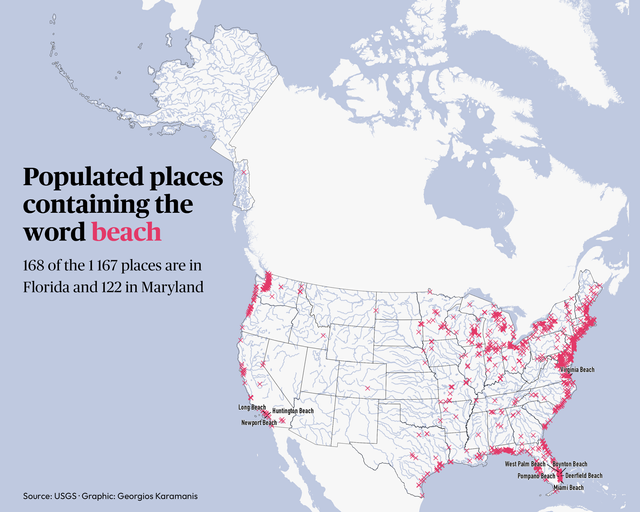 For this week’s #TidyTuesday I plotted the populated places in the US with the word ‘beach’ in their name Code on GitHub
TidyTuesday 2023/25
June 25, 2023
UFO & world & map & TidyTuesday & Data Visualization
For this week’s #TidyTuesday I plotted the populated places in the US with the word ‘beach’ in their name Code on GitHub
TidyTuesday 2023/25
June 25, 2023
UFO & world & map & TidyTuesday & Data Visualization
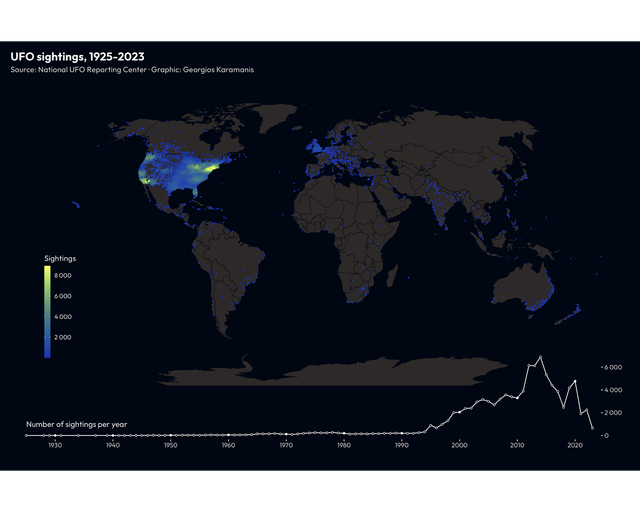 Reported UFO sightings for this week’s #TidyTuesday Code on GitHub
TidyTuesday 2023/24
June 18, 2023
survey & donut chart & SAFI & TidyTuesday & Data Visualization
Reported UFO sightings for this week’s #TidyTuesday Code on GitHub
TidyTuesday 2023/24
June 18, 2023
survey & donut chart & SAFI & TidyTuesday & Data Visualization
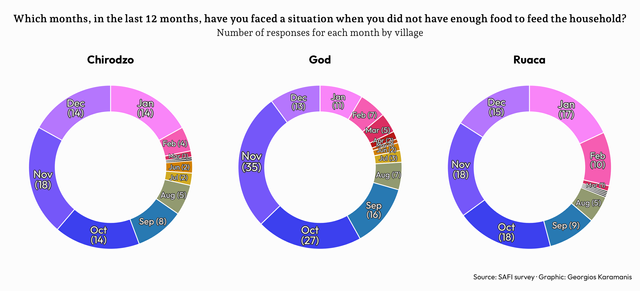 SAFI survey for this week’s #TidyTuesday Code on GitHub
MapPromptMonday 2023/24
June 17, 2023
sea & ice & Arctic & MapPromptMonday & Data Visualization & Map
SAFI survey for this week’s #TidyTuesday Code on GitHub
MapPromptMonday 2023/24
June 17, 2023
sea & ice & Arctic & MapPromptMonday & Data Visualization & Map
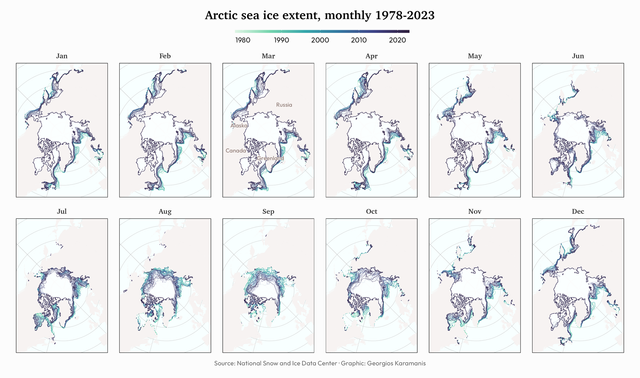 Arctic sea ice extent for this week’s #MapPromptMonday, Arctic or Antarctic Code on GitHub
TidyTuesday 2023/23
June 11, 2023
Europe & energy & electricity & map & TidyTuesday & Data Visualization
Arctic sea ice extent for this week’s #MapPromptMonday, Arctic or Antarctic Code on GitHub
TidyTuesday 2023/23
June 11, 2023
Europe & energy & electricity & map & TidyTuesday & Data Visualization
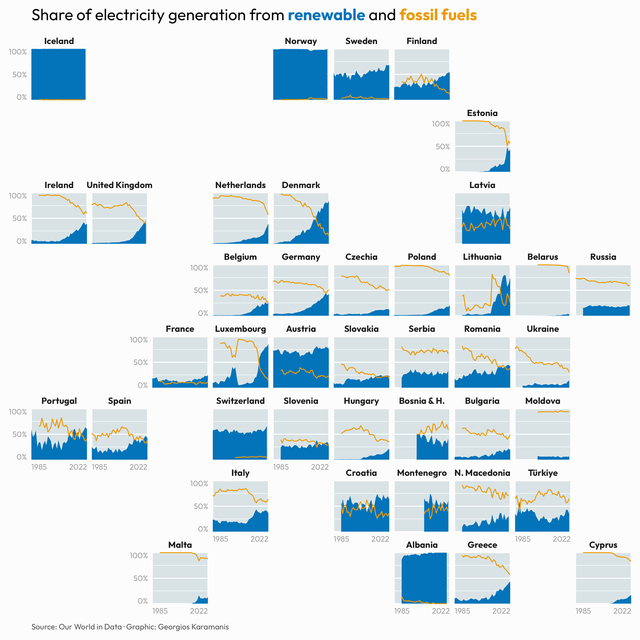 Share of electricity generation in Europe for this week’s #TidyTuesday Code on GitHub
MapPromptMonday 2023/23
June 8, 2023
Europe & police & phone number & MapPromptMonday & map & Data Visualization & Map
Share of electricity generation in Europe for this week’s #TidyTuesday Code on GitHub
MapPromptMonday 2023/23
June 8, 2023
Europe & police & phone number & MapPromptMonday & map & Data Visualization & Map
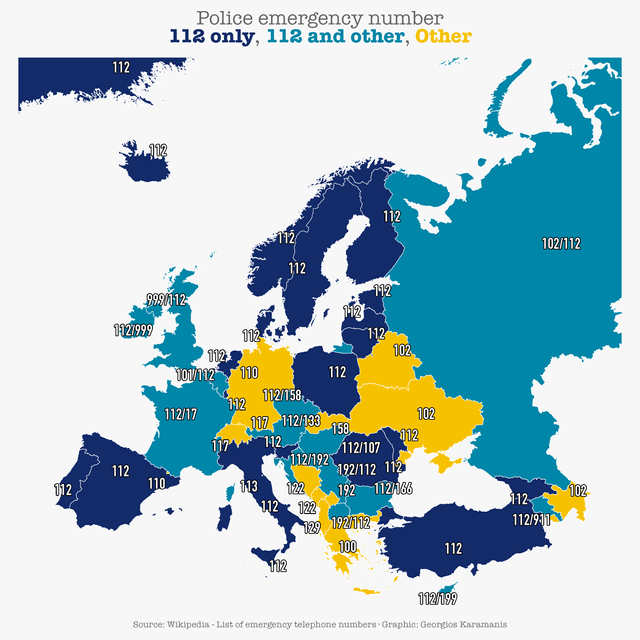 Europe’s police emergency numbers for this week’s #MapPromptMonday, Safety Code on GitHub Source is Wikipedia’s List of emergency telephone numbers
MapPromptMonday 2023/22
June 4, 2023
water & sea & Europe & MapPromptMonday & climate & Data Visualization & Map
Europe’s police emergency numbers for this week’s #MapPromptMonday, Safety Code on GitHub Source is Wikipedia’s List of emergency telephone numbers
MapPromptMonday 2023/22
June 4, 2023
water & sea & Europe & MapPromptMonday & climate & Data Visualization & Map
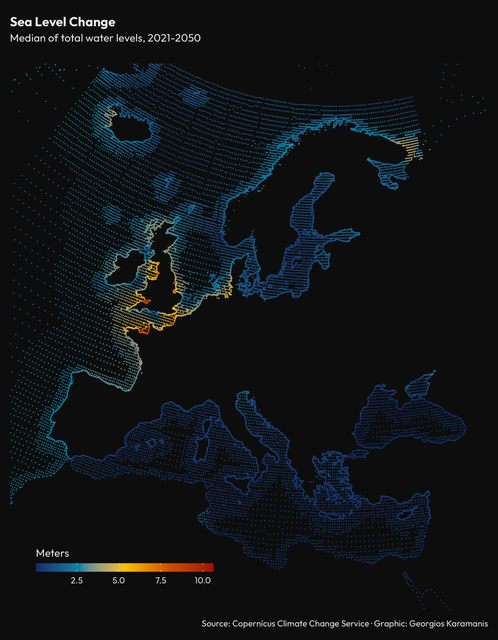 Sea level change for this week’s #MapPromptMonday, Cimate Change Vulnerability Code on GitHub Data source
TidyTuesday 2023/22
June 4, 2023
age & people & TidyTuesday & Data Visualization
Sea level change for this week’s #MapPromptMonday, Cimate Change Vulnerability Code on GitHub Data source
TidyTuesday 2023/22
June 4, 2023
age & people & TidyTuesday & Data Visualization
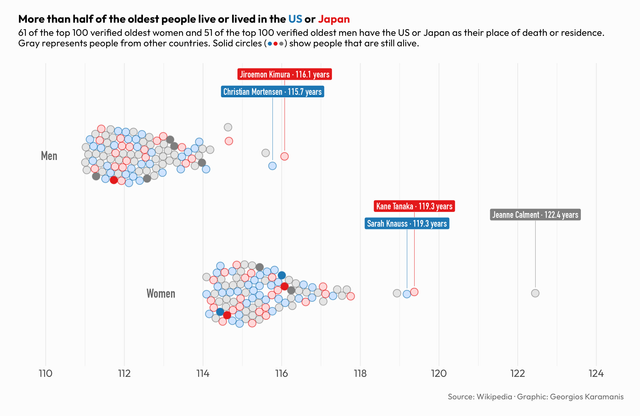 Verified oldest people for this week’s #TidyTuesday. Big thanks to Aryn Toombs for the tutorial on making a beeswarm chart with circle packing Code
MapPromptMonday 2023/21
May 29, 2023
Europe & map & MapPromptMonday & art & triangulation & Data Visualization & Map
Verified oldest people for this week’s #TidyTuesday. Big thanks to Aryn Toombs for the tutorial on making a beeswarm chart with circle packing Code
MapPromptMonday 2023/21
May 29, 2023
Europe & map & MapPromptMonday & art & triangulation & Data Visualization & Map
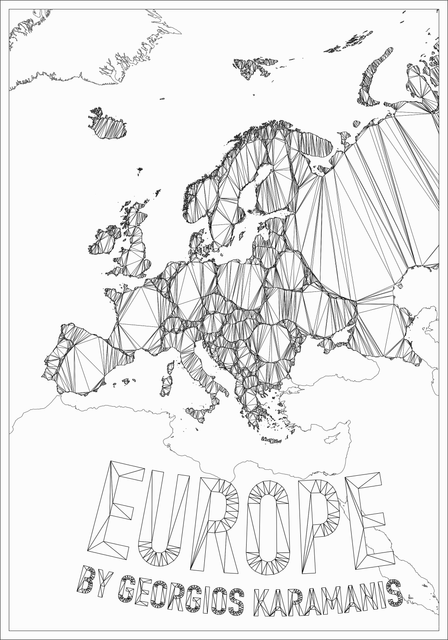 Europe with constrained triangulation for last week’s #MapPromptMonday, Book Cover Code on GitHub
TidyTuesday 2023/21
May 28, 2023
squirrels & Central Park & TidyTuesday & Data Visualization
Europe with constrained triangulation for last week’s #MapPromptMonday, Book Cover Code on GitHub
TidyTuesday 2023/21
May 28, 2023
squirrels & Central Park & TidyTuesday & Data Visualization
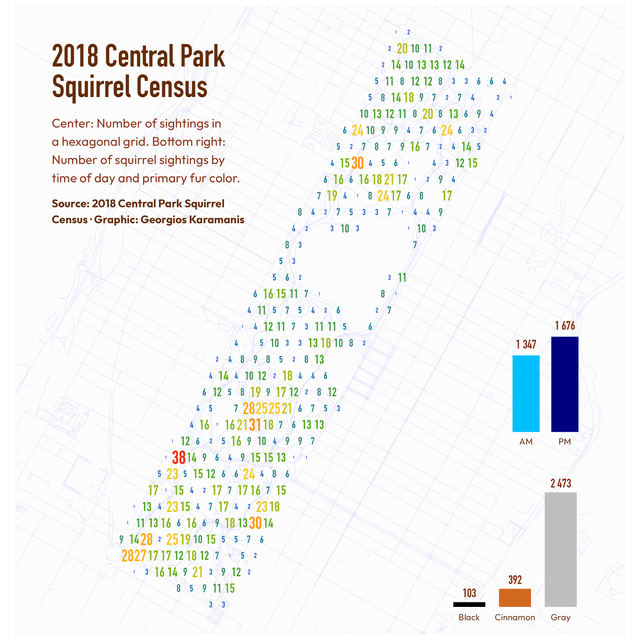 2018 Central Park Squirrel Census for this week’s #TidyTuesday Code on GitHub
MapPromptMonday 2023/20
May 28, 2023
Europe & degree days & MapPromptMonday & map & Data Visualization & Map
2018 Central Park Squirrel Census for this week’s #TidyTuesday Code on GitHub
MapPromptMonday 2023/20
May 28, 2023
Europe & degree days & MapPromptMonday & map & Data Visualization & Map
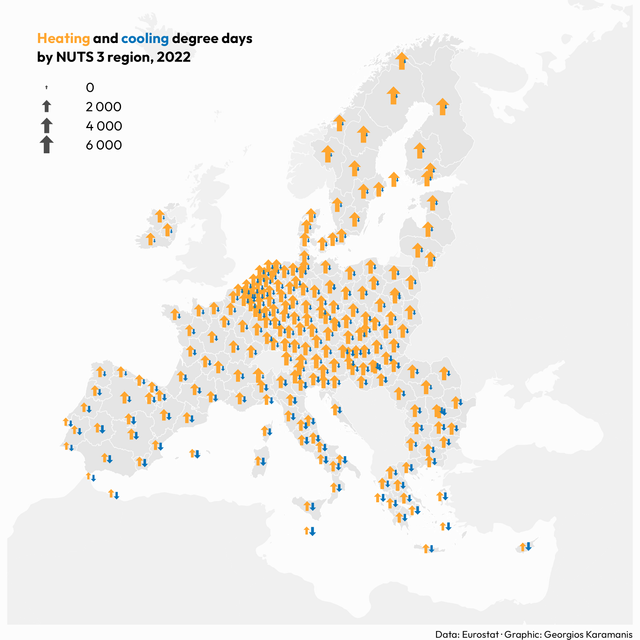 Week of May 15-21 of #MapPromptMonday, Proportional Symbols Code on GitHub
TidyTuesday 2023/20
May 21, 2023
tornado & US & spiral & TidyTuesday & Data Visualization
Week of May 15-21 of #MapPromptMonday, Proportional Symbols Code on GitHub
TidyTuesday 2023/20
May 21, 2023
tornado & US & spiral & TidyTuesday & Data Visualization
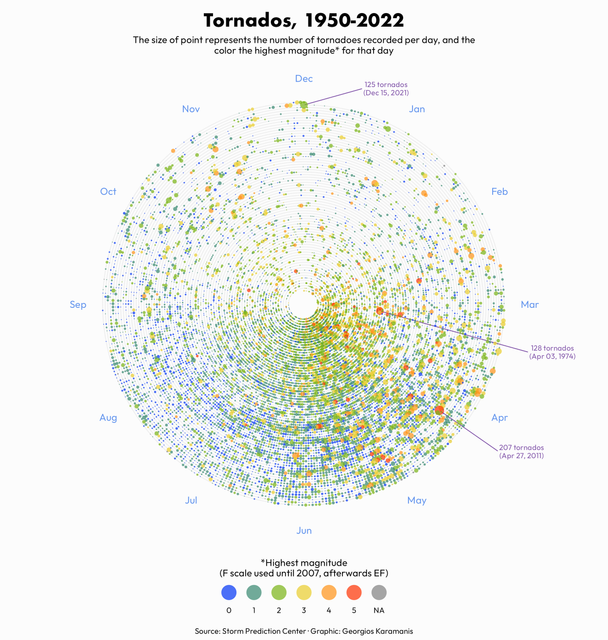 Tornados for this week’s #TidyTuesday Code on GitHub
MapPromptMonday 2023/19
May 19, 2023
globe & map & MapPromptMonday & Thessaloniki & Uppsala & cities & Data Visualization & Map
Tornados for this week’s #TidyTuesday Code on GitHub
MapPromptMonday 2023/19
May 19, 2023
globe & map & MapPromptMonday & Thessaloniki & Uppsala & cities & Data Visualization & Map
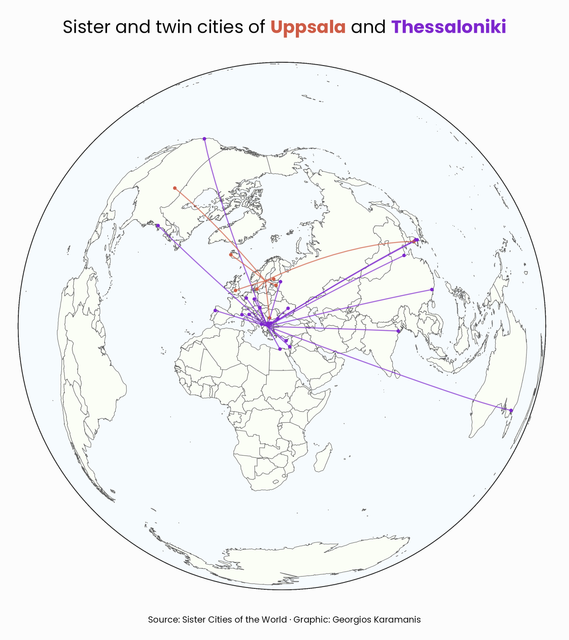 Week 8-14 May of #MapPromptMonday, Home Sister and twin cities of Thessaloniki and Uppsala, the two cities I call home Code on GitHub
MapPromptMonday 2023/18
May 13, 2023
map & urbanisation & Europe & Africa & MapPromptMonday & Data Visualization & Map
Week 8-14 May of #MapPromptMonday, Home Sister and twin cities of Thessaloniki and Uppsala, the two cities I call home Code on GitHub
MapPromptMonday 2023/18
May 13, 2023
map & urbanisation & Europe & Africa & MapPromptMonday & Data Visualization & Map
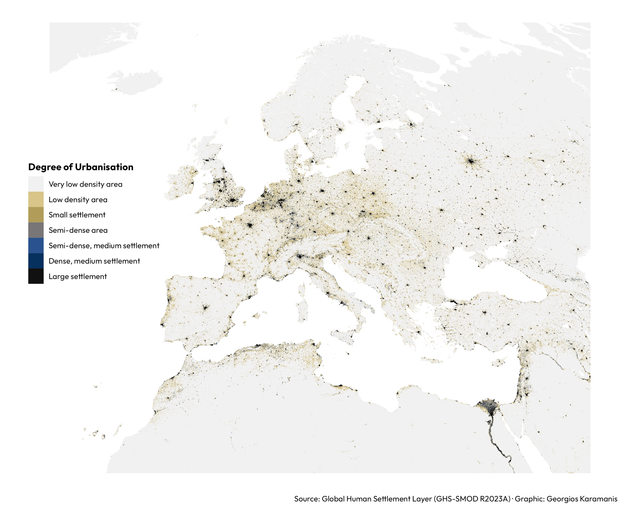 Degree of urbanisation in Europe and North Africa for the week 1-7 May of #MapPromptMonday, Urban vs. Rural Code on GitHub
TidyTuesday 2023/19
May 12, 2023
US & map & childcare & TidyTuesday & Map & Data Visualization
Degree of urbanisation in Europe and North Africa for the week 1-7 May of #MapPromptMonday, Urban vs. Rural Code on GitHub
TidyTuesday 2023/19
May 12, 2023
US & map & childcare & TidyTuesday & Map & Data Visualization
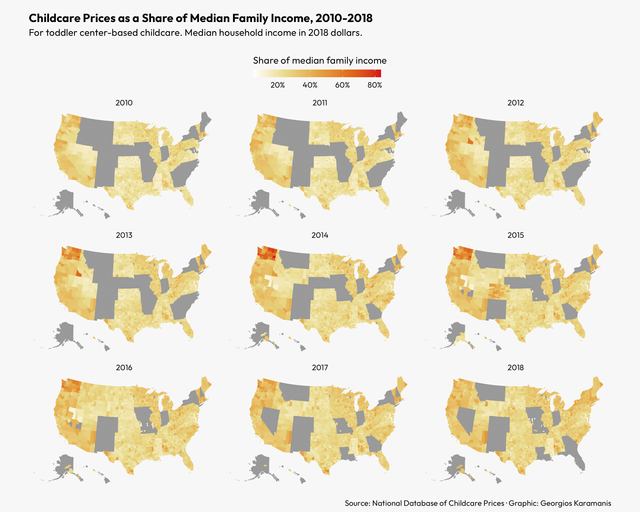 Childcare Prices for this week’s #TidyTuesday Code on GitHub
MapPromptMonday 2023/17
May 10, 2023
disease & surgery & health & Europe & MapPromptMonday & map & Map & Data Visualization
Childcare Prices for this week’s #TidyTuesday Code on GitHub
MapPromptMonday 2023/17
May 10, 2023
disease & surgery & health & Europe & MapPromptMonday & map & Map & Data Visualization
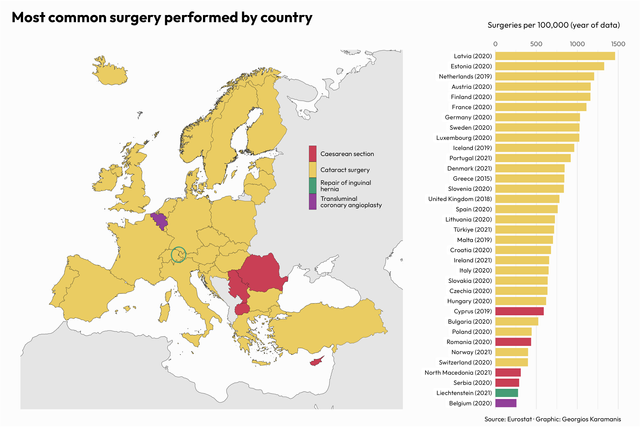 For the week 24-30 Apr of #MapPromptMonday, Disease, I looked at the most common surgeries in European countries Code on GitHub
MapPromptMonday 2023/16
May 7, 2023
drought & Europe & MapPromptMonday & Data Visualization & Map
For the week 24-30 Apr of #MapPromptMonday, Disease, I looked at the most common surgeries in European countries Code on GitHub
MapPromptMonday 2023/16
May 7, 2023
drought & Europe & MapPromptMonday & Data Visualization & Map
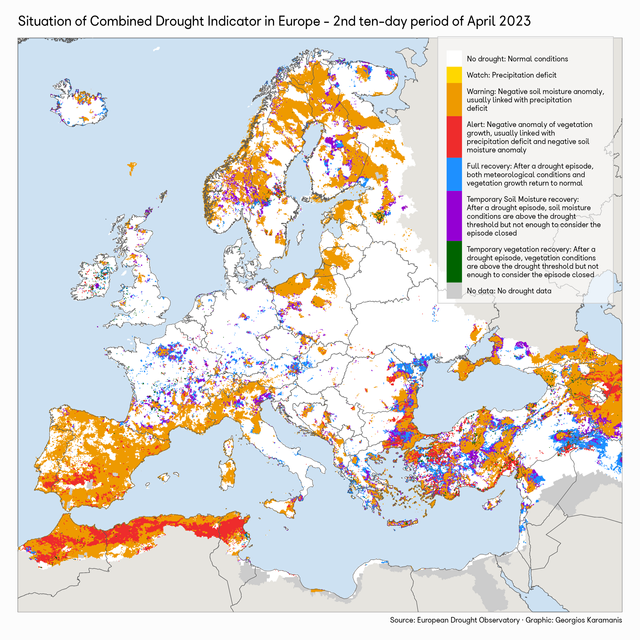 For the week 17-24 April of #MapPromptMonday, Environment, I recreated the drought map by Copernicus EMS Code on GitHub
TidyTuesday 2023/18
May 6, 2023
rodents & reproduction & Portal Project & TidyTuesday & Data Visualization
For the week 17-24 April of #MapPromptMonday, Environment, I recreated the drought map by Copernicus EMS Code on GitHub
TidyTuesday 2023/18
May 6, 2023
rodents & reproduction & Portal Project & TidyTuesday & Data Visualization
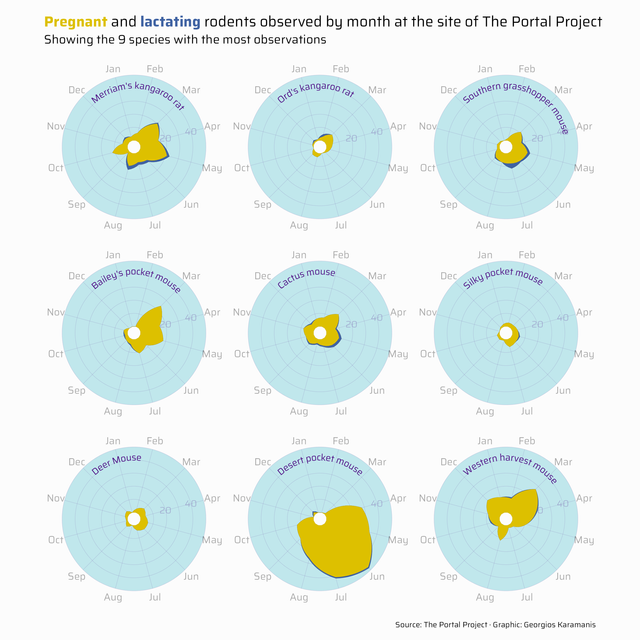 Pregnant and lactating rodents at The Portal Project for this week’s #TidyTuesday. Code on GitHub
TidyTuesday 2023/17
April 29, 2023
London & marathon & women & Data Visualization
Pregnant and lactating rodents at The Portal Project for this week’s #TidyTuesday. Code on GitHub
TidyTuesday 2023/17
April 29, 2023
London & marathon & women & Data Visualization
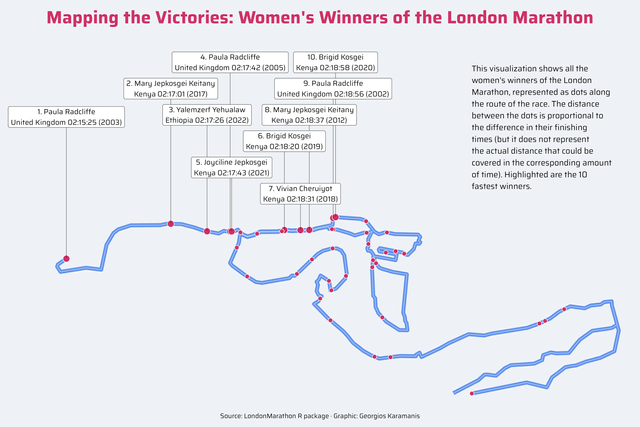 Women’s winners of the London Marathon for this week’s #TidyTuesday. Code on GitHub [ ](This visualization shows all the women’s winners of the
TidyTuesday 2023/16
April 23, 2023
crops & Middle East & map & TidyTuesday & Data Visualization
Women’s winners of the London Marathon for this week’s #TidyTuesday. Code on GitHub [ ](This visualization shows all the women’s winners of the
TidyTuesday 2023/16
April 23, 2023
crops & Middle East & map & TidyTuesday & Data Visualization
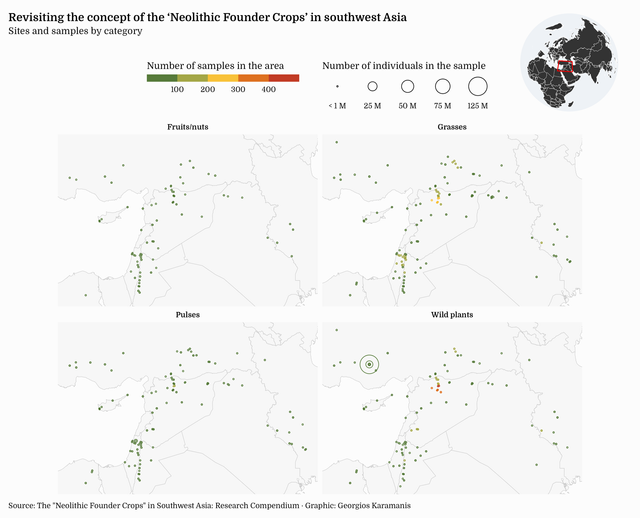 Neolithic Founder Crops for this week’s #TidyTuesday. Had started with a similar map when I saw Nicola’s plot and decided to steal the idea of a
MapPromptMonday 2023/15
April 21, 2023
Europe & MapPromptMonday & topographic & height & Data Visualization & Map
Neolithic Founder Crops for this week’s #TidyTuesday. Had started with a similar map when I saw Nicola’s plot and decided to steal the idea of a
MapPromptMonday 2023/15
April 21, 2023
Europe & MapPromptMonday & topographic & height & Data Visualization & Map
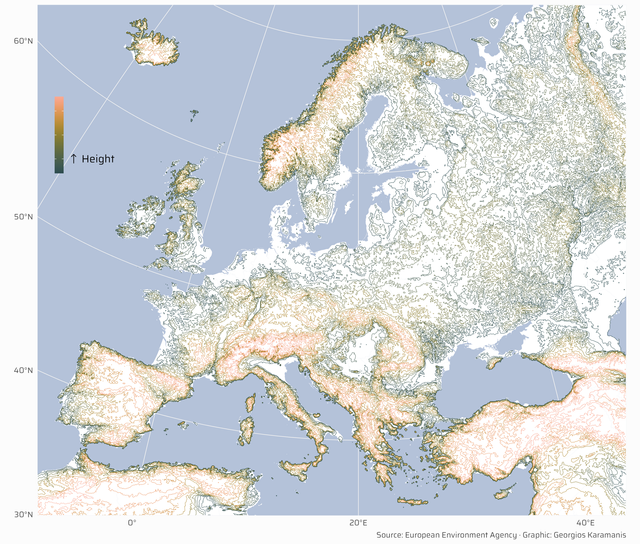 Submission to last week’s #MapPromptMonday, Topography Code on GitHub
MapPromptMonday 2023/14
April 17, 2023
map & MapPromptMonday & photos & Olivia & Map & Data Visualization
Submission to last week’s #MapPromptMonday, Topography Code on GitHub
MapPromptMonday 2023/14
April 17, 2023
map & MapPromptMonday & photos & Olivia & Map & Data Visualization
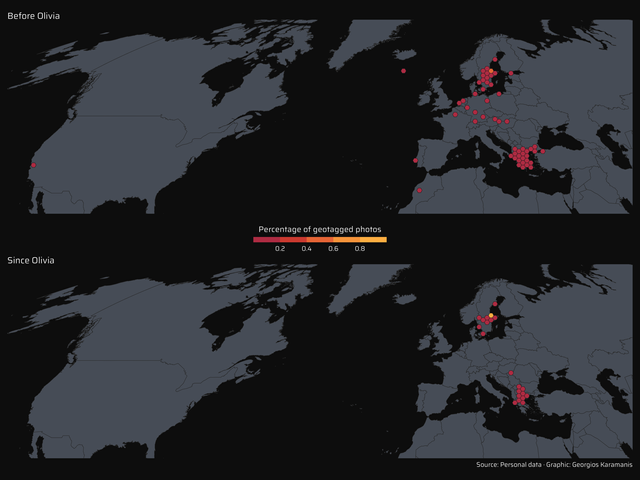 A personal project for #MapPromptMonday, week of April 3-9, Bucket List. Location of geotagged photos before and after the birth of my daughter Code
TidyTuesday 2023/15
April 16, 2023
eggs & TidyTuesday & Data Visualization
A personal project for #MapPromptMonday, week of April 3-9, Bucket List. Location of geotagged photos before and after the birth of my daughter Code
TidyTuesday 2023/15
April 16, 2023
eggs & TidyTuesday & Data Visualization
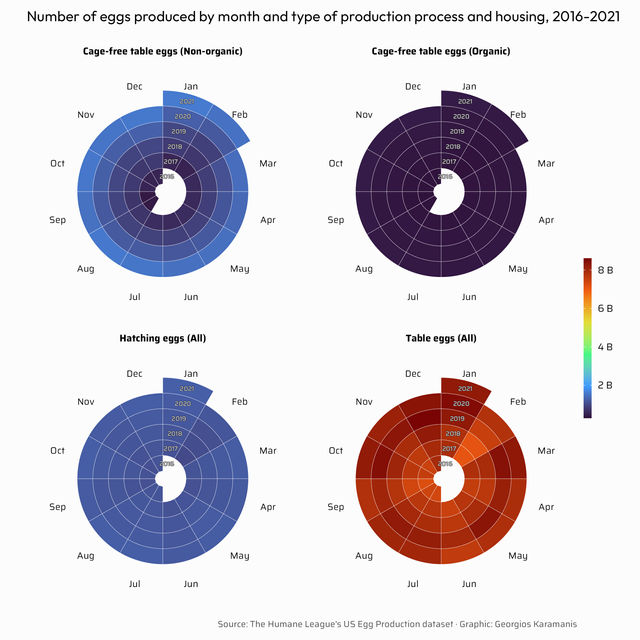 US Egg Production for this week’s #TidyTuesday Code on GitHub
MapPromptMonday 2023/13
April 9, 2023
map & MapPromptMonday & Europe & disaster & Map & Data Visualization
US Egg Production for this week’s #TidyTuesday Code on GitHub
MapPromptMonday 2023/13
April 9, 2023
map & MapPromptMonday & Europe & disaster & Map & Data Visualization
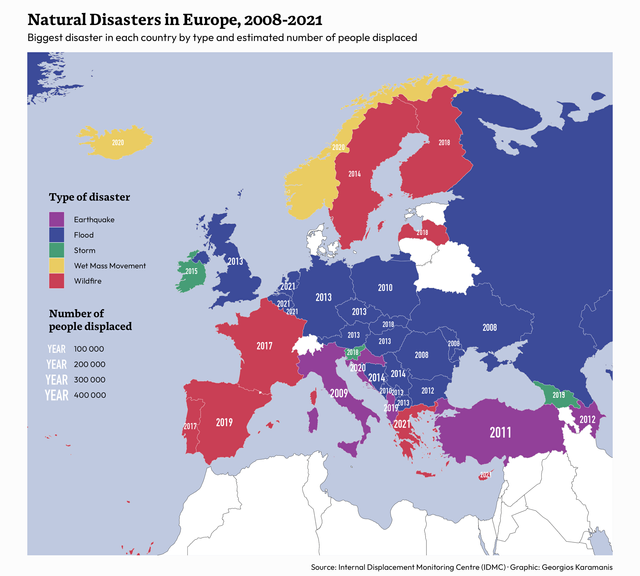 For last week’s #MapPromptMonday, Recent Environmental Disaster, I made this map of the biggest (by number of people displaced) disaster in each
TidyTuesday 2023/14
April 8, 2023
football & Premier League & TidyTuesday & Data Visualization
For last week’s #MapPromptMonday, Recent Environmental Disaster, I made this map of the biggest (by number of people displaced) disaster in each
TidyTuesday 2023/14
April 8, 2023
football & Premier League & TidyTuesday & Data Visualization
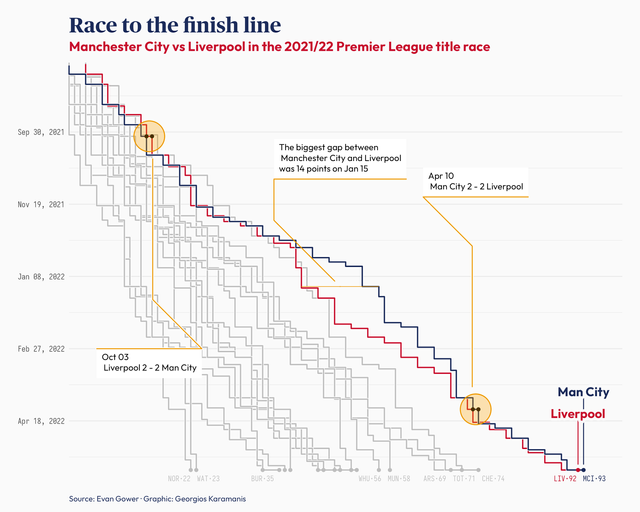 The 2021/22 title race between Manchester City and Liverpool for this week’s #TidyTuesday Code on GitHub
TidyTuesday 2023/13
April 1, 2023
world & timezones & time & Data Visualization & Map
The 2021/22 title race between Manchester City and Liverpool for this week’s #TidyTuesday Code on GitHub
TidyTuesday 2023/13
April 1, 2023
world & timezones & time & Data Visualization & Map
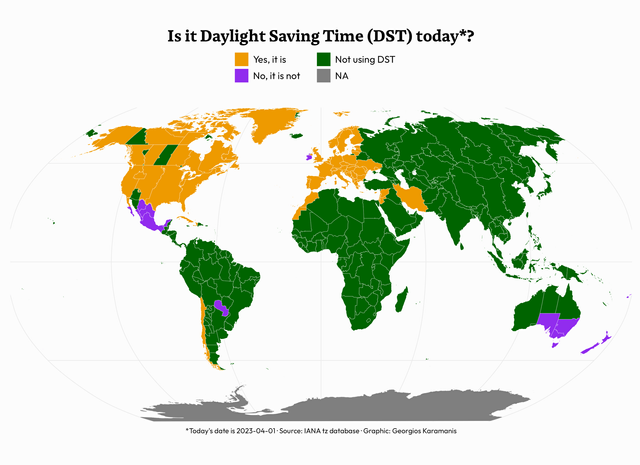 “Is it Daylight Saving Time today?” for this week’s #TidyTuesday Code on GitHub
TidyTuesday 2023/12
March 26, 2023
R & programming languages & Data Visualization
“Is it Daylight Saving Time today?” for this week’s #TidyTuesday Code on GitHub
TidyTuesday 2023/12
March 26, 2023
R & programming languages & Data Visualization
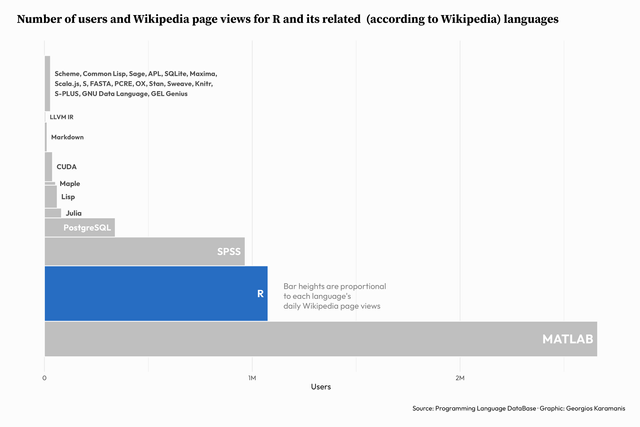 Two charts about R for this week’s #TidyTuesday Code on Github
MapPromptMonday 2023/12
March 24, 2023
map & Earth & temperature & globe & Data Visualization & Map
Two charts about R for this week’s #TidyTuesday Code on Github
MapPromptMonday 2023/12
March 24, 2023
map & Earth & temperature & globe & Data Visualization & Map
 For this week’s #MapPromptMonday, Inspired By…, I used ggplot2 to recreate Wanmei’s great visual. Downloading the data was super easy thanks to
MapPromptMonday 2023/11
March 19, 2023
Europe & map & elevation & relief & Map & Data Visualization
For this week’s #MapPromptMonday, Inspired By…, I used ggplot2 to recreate Wanmei’s great visual. Downloading the data was super easy thanks to
MapPromptMonday 2023/11
March 19, 2023
Europe & map & elevation & relief & Map & Data Visualization
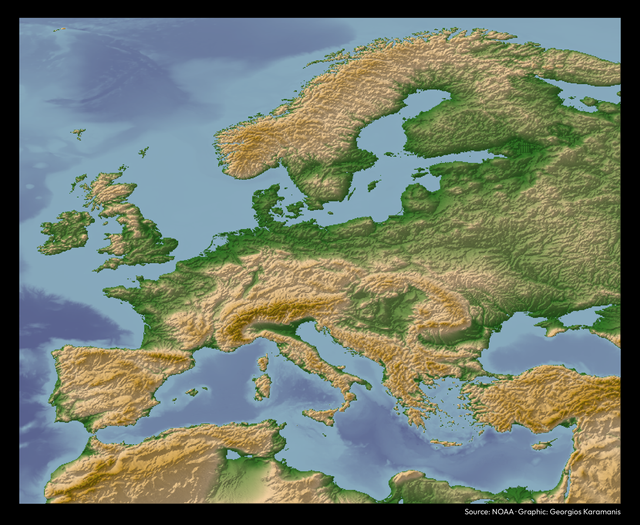 For this week’s #MapPromptMonday, Earth imagery, I made an elevation map of Europe with a shaded relief using Elio’s technique. Code on GitHub
TidyTuesday 2023/11
March 16, 2023
drugs & medicine & Europe & names & text & Data Visualization
For this week’s #MapPromptMonday, Earth imagery, I made an elevation map of Europe with a shaded relief using Elio’s technique. Code on GitHub
TidyTuesday 2023/11
March 16, 2023
drugs & medicine & Europe & names & text & Data Visualization
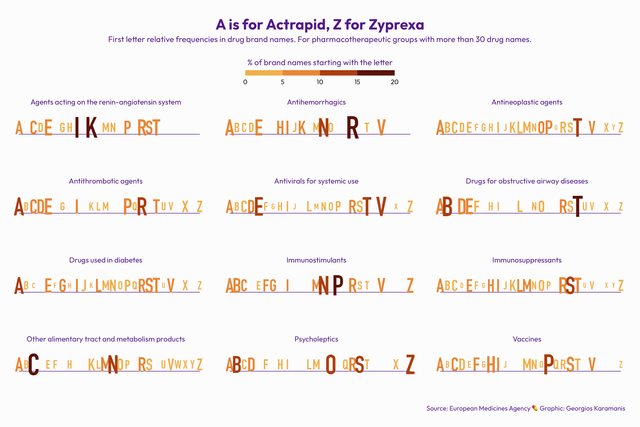 For this week’s #TidyTuesday I looked at the first letters of drug brand names. Cool to see different patterns among the drug groups. Once again
TidyTuesday 2023/10
March 12, 2023
numbats & Australia & map & Data Visualization & Map
For this week’s #TidyTuesday I looked at the first letters of drug brand names. Cool to see different patterns among the drug groups. Once again
TidyTuesday 2023/10
March 12, 2023
numbats & Australia & map & Data Visualization & Map
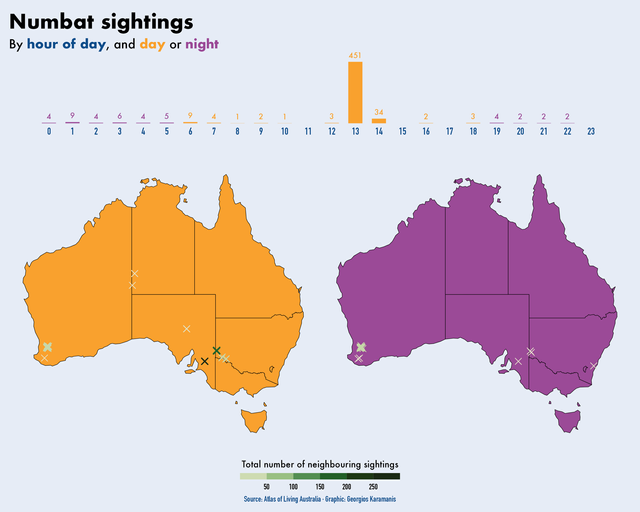 Numbat sightings for this week’s #TidyTuesday Code on GitHub
MapPromptMonday 2023/10
March 11, 2023
pets & cats & dogs & Europe & map & Data Visualization & Map
Numbat sightings for this week’s #TidyTuesday Code on GitHub
MapPromptMonday 2023/10
March 11, 2023
pets & cats & dogs & Europe & map & Data Visualization & Map
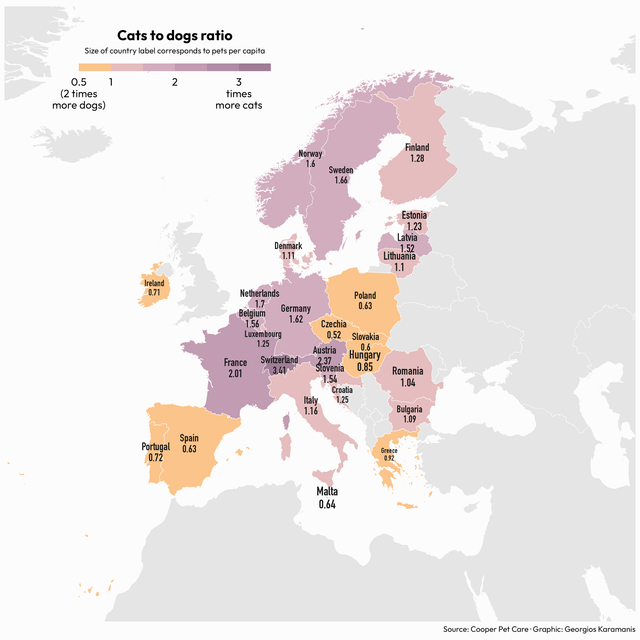 I didn’t have a favorite animal for this week #MapPromptMonday, so I asked my daughter about hers 🙂 So, here is the ratio of cats to dogs in
TidyTuesday 2023/9
March 5, 2023
Africa & language & emoji & Data Visualization
I didn’t have a favorite animal for this week #MapPromptMonday, so I asked my daughter about hers 🙂 So, here is the ratio of cats to dogs in
TidyTuesday 2023/9
March 5, 2023
Africa & language & emoji & Data Visualization
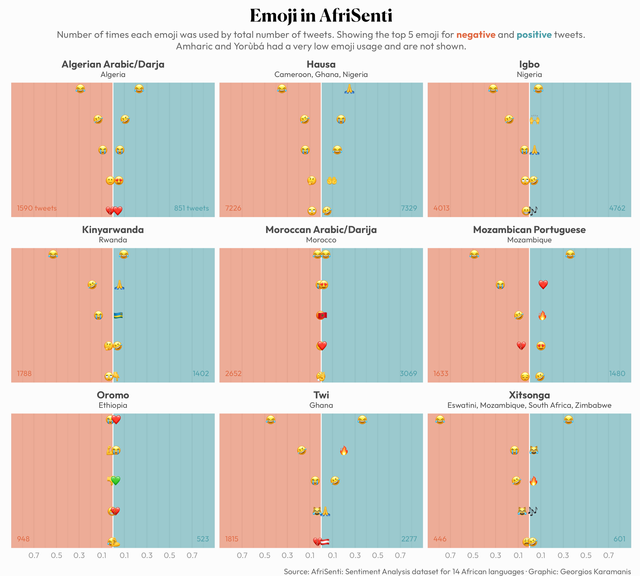 Emoji usage in the AfriSenti dataset for this week’s #TidyTuesday. Code on GitHub
MapPromptMonday 2023/9
March 3, 2023
map & Europe & yew & tree & Data Visualization & Map
Emoji usage in the AfriSenti dataset for this week’s #TidyTuesday. Code on GitHub
MapPromptMonday 2023/9
March 3, 2023
map & Europe & yew & tree & Data Visualization & Map
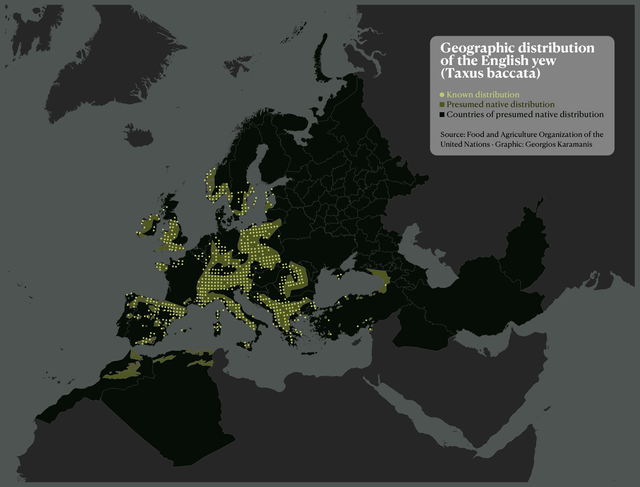 For this week #MapPromptMonday (NGO Data) I remade a map from a FAO report. Code on GitHub
TidyTuesday 2023/8
February 26, 2023
Bob Ross & painting & color & Data Visualization
For this week #MapPromptMonday (NGO Data) I remade a map from a FAO report. Code on GitHub
TidyTuesday 2023/8
February 26, 2023
Bob Ross & painting & color & Data Visualization
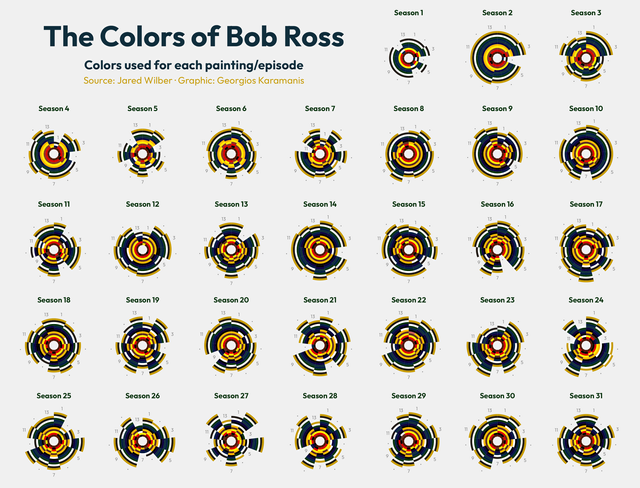 Colors used in Bob Ross’s paintings for this week’s #TidyTuesday Code on GitHub
MapPromptMonday 2023/8
February 23, 2023
map & train & Europe & b&w & Map & Data Visualization
Colors used in Bob Ross’s paintings for this week’s #TidyTuesday Code on GitHub
MapPromptMonday 2023/8
February 23, 2023
map & train & Europe & b&w & Map & Data Visualization
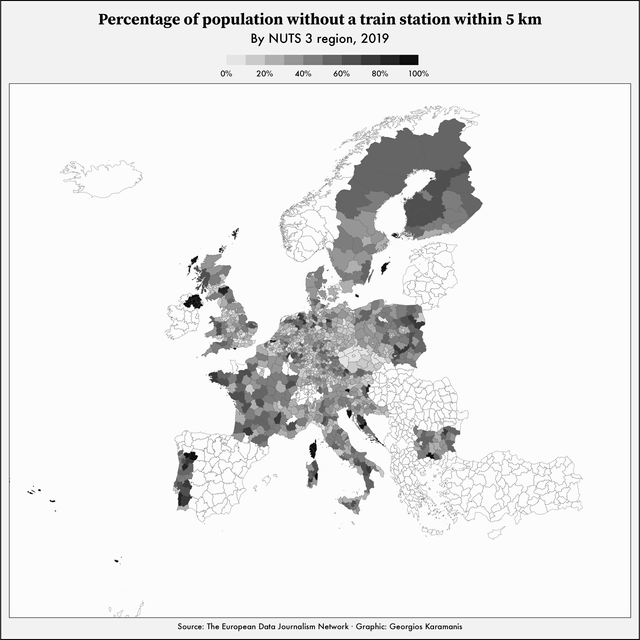 For this week #MapPromptMonday (Black & White/Grayscale) I used a dataset by the EDJNet. Code on GitHub
TidyTuesday 2023/7
February 19, 2023
Hollywood & movies & actors & age & Data Visualization
For this week #MapPromptMonday (Black & White/Grayscale) I used a dataset by the EDJNet. Code on GitHub
TidyTuesday 2023/7
February 19, 2023
Hollywood & movies & actors & age & Data Visualization
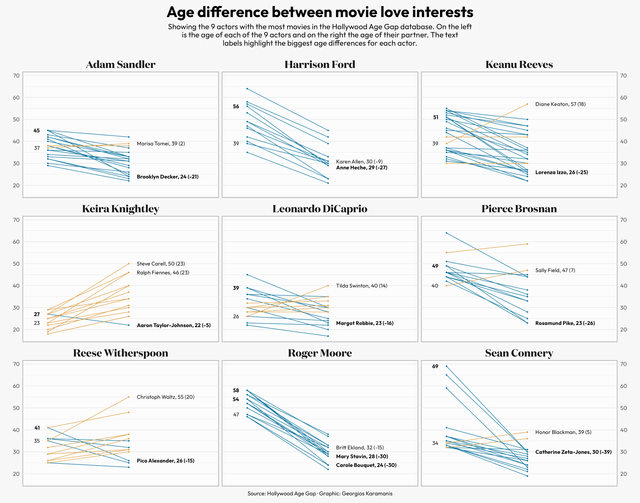 Hollywood age gaps for this week’s #TidyTuesday Code on Github
MapPromptMonday 2023/7
February 16, 2023
map & Europe & sunshine & precipitation & bivariate & Map & Data Visualization
Hollywood age gaps for this week’s #TidyTuesday Code on Github
MapPromptMonday 2023/7
February 16, 2023
map & Europe & sunshine & precipitation & bivariate & Map & Data Visualization
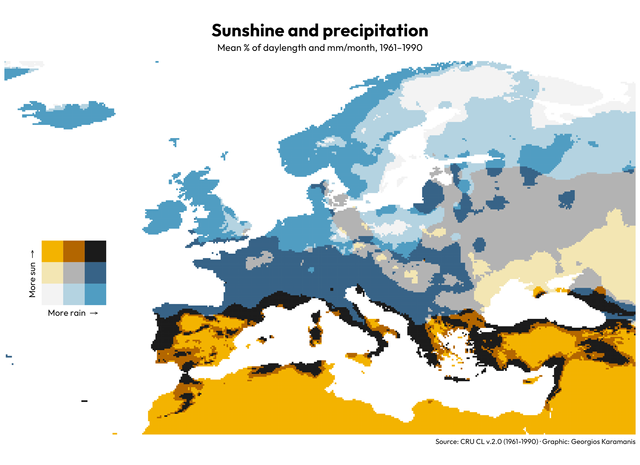 Mean sunshine and precipitation between 1961 and 1990 for this week’s #MapPromptMonday (Bivariate map) Idea and colors by Colin Angus Code on GitHub
TidyTuesday 2023/6
February 9, 2023
Tech & stocks & Data Visualization
Mean sunshine and precipitation between 1961 and 1990 for this week’s #MapPromptMonday (Bivariate map) Idea and colors by Colin Angus Code on GitHub
TidyTuesday 2023/6
February 9, 2023
Tech & stocks & Data Visualization
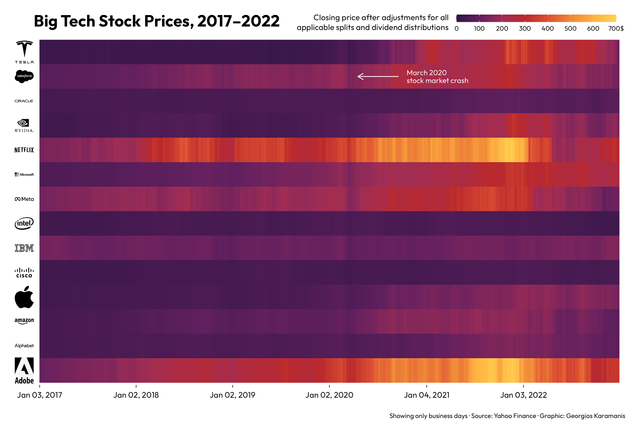 Big tech stock prices for this week’s #TidyTuesday Code on Github
MapPromptMonday 2023/6
February 6, 2023
Earth & climate & temperature & map & Data Visualization & Map
Big tech stock prices for this week’s #TidyTuesday Code on Github
MapPromptMonday 2023/6
February 6, 2023
Earth & climate & temperature & map & Data Visualization & Map
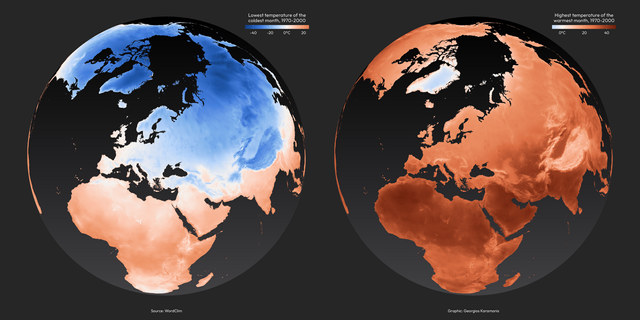 Lowest and highest temperatures between 1970 and 2000 for this week’s #MapPromptMonday (Climate/Weather) code on GitHub
MapPromptMonday 2023/5
February 4, 2023
Europe & Sweden & Immigration & Map & Data Visualization
Lowest and highest temperatures between 1970 and 2000 for this week’s #MapPromptMonday (Climate/Weather) code on GitHub
MapPromptMonday 2023/5
February 4, 2023
Europe & Sweden & Immigration & Map & Data Visualization
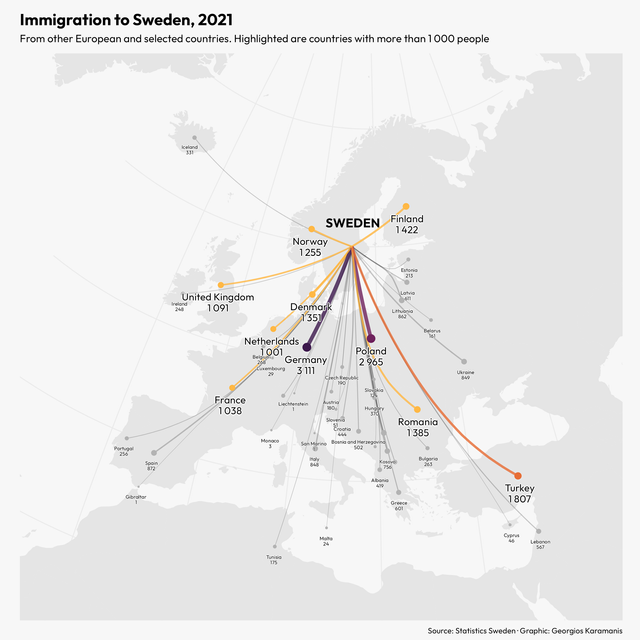 Immigration to Sweden for this week’s #MapPromptMonday (Flow Map) Code on GitHub
TidyTuesday 2023/5
February 3, 2023
cats & UK & circles & movement & Data Visualization
Immigration to Sweden for this week’s #MapPromptMonday (Flow Map) Code on GitHub
TidyTuesday 2023/5
February 3, 2023
cats & UK & circles & movement & Data Visualization
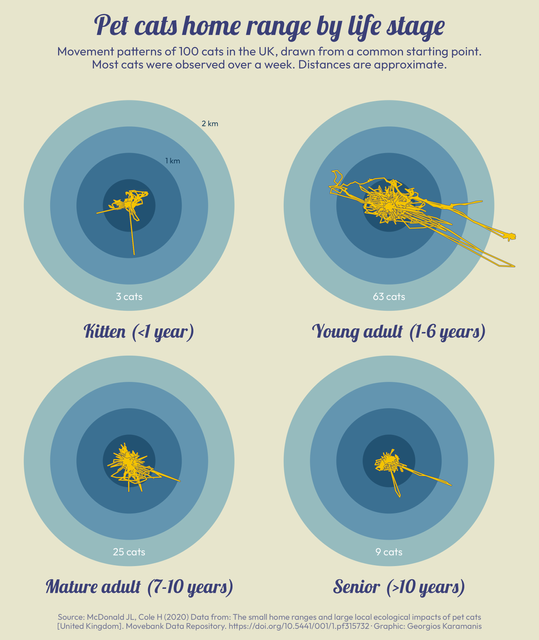 Pet cats movement range by life stage for this week’s #TidyTuesday Code on Github
MapPromptMonday 2023/4
January 28, 2023
TV & map & Europe & Map & Data Visualization
Pet cats movement range by life stage for this week’s #TidyTuesday Code on Github
MapPromptMonday 2023/4
January 28, 2023
TV & map & Europe & Map & Data Visualization
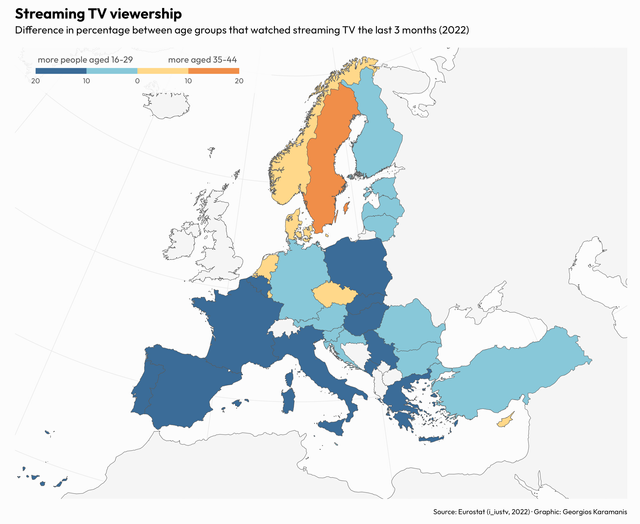 For this week’s #MapPromptMonday I made a map comparing the streaming TV viewership between two age groups in EU countries. Code on GitHub
TidyTuesday 2023/4
January 26, 2023
Alone & TV & waffle & Data Visualization
For this week’s #MapPromptMonday I made a map comparing the streaming TV viewership between two age groups in EU countries. Code on GitHub
TidyTuesday 2023/4
January 26, 2023
Alone & TV & waffle & Data Visualization
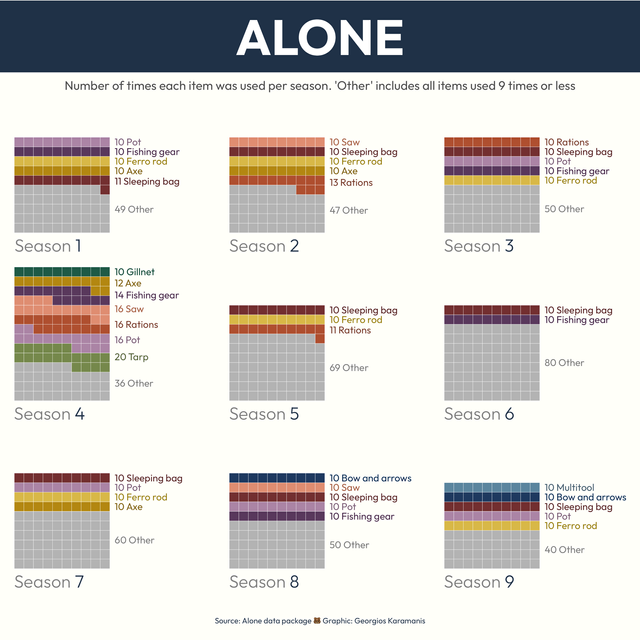 For this week’s #TidyTuesday I made a waffle chart highlighting the most popular items brought by “Alone” participants by season. Code on Github
TidyTuesday 2023/3
January 22, 2023
art & museum & exhibition & Data Visualization
For this week’s #TidyTuesday I made a waffle chart highlighting the most popular items brought by “Alone” participants by season. Code on Github
TidyTuesday 2023/3
January 22, 2023
art & museum & exhibition & Data Visualization
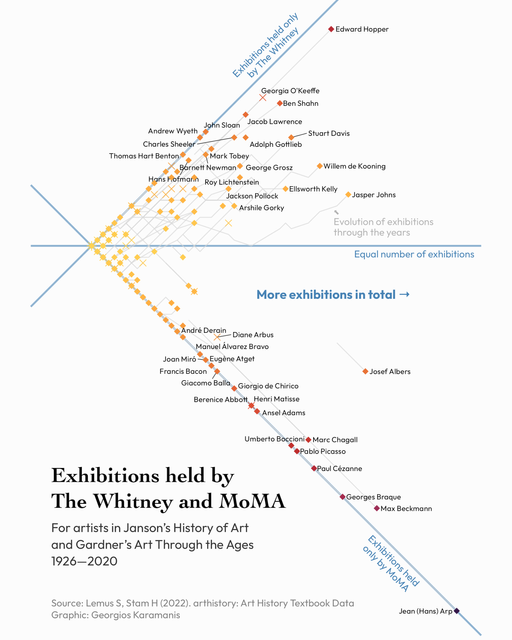 Exhibitions by MoMA and The Whitney for this week’s #TidyTuesday Code on GitHub
MapPromptMonday 2023/3
January 21, 2023
map & MapPromptMonday & livestock & colorblind-friendly & Data Visualization & Map
Exhibitions by MoMA and The Whitney for this week’s #TidyTuesday Code on GitHub
MapPromptMonday 2023/3
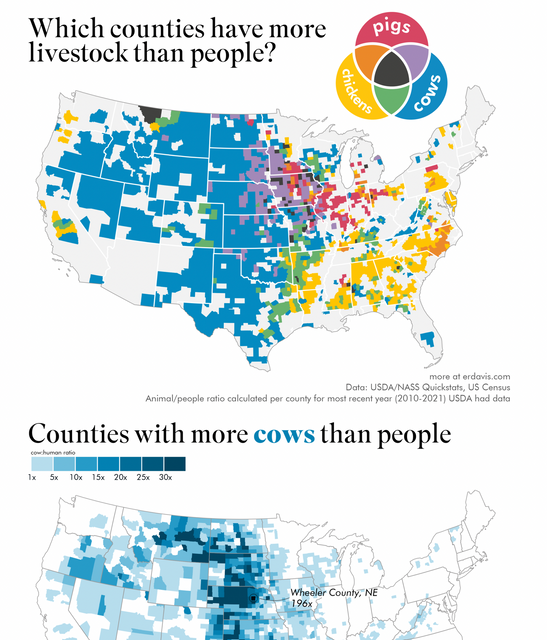
January 21, 2023
map & MapPromptMonday & livestock & colorblind-friendly & Data Visualization & Map
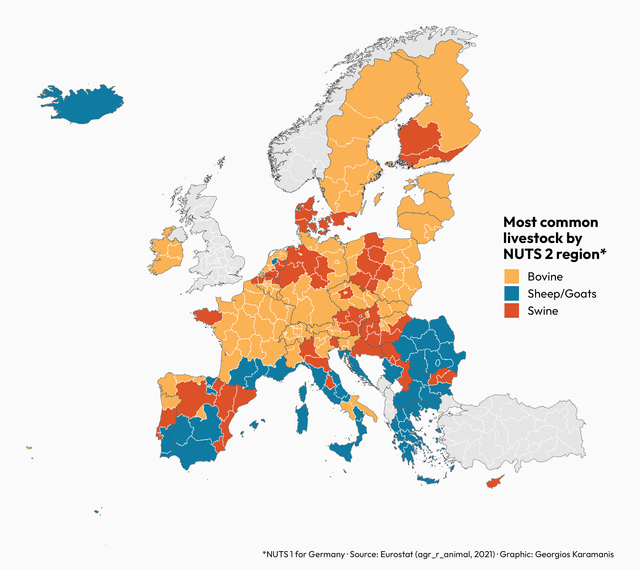 Most common livestock in EU for this week’s #MapPromptMonday. Used the colorblind-friendly palette “Egypt” from MetBrewer Code on GitHub
TidyTuesday and MapPromptMonday 2023/2
January 14, 2023
TidyTuesday & MapPromptMonday & map & US & bird & hot spot & grackle & Data Visualization
Most common livestock in EU for this week’s #MapPromptMonday. Used the colorblind-friendly palette “Egypt” from MetBrewer Code on GitHub
TidyTuesday and MapPromptMonday 2023/2
January 14, 2023
TidyTuesday & MapPromptMonday & map & US & bird & hot spot & grackle & Data Visualization
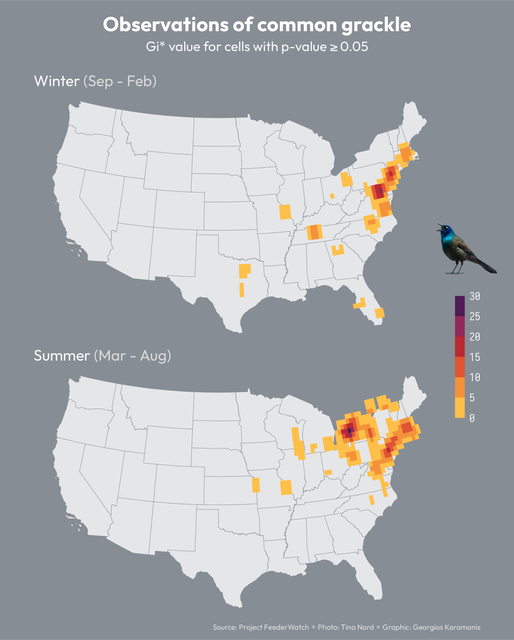 Another cross post for #MapPromptMonday (Hot spot map) and #TidyTuesday (Project FeederWatch). First time doing hot spot analysis, used the
TidyTuesday and MapPromptMonday 2023/1
January 5, 2023
Europe & map & death & Eurostat & Data Visualization & Map
Another cross post for #MapPromptMonday (Hot spot map) and #TidyTuesday (Project FeederWatch). First time doing hot spot analysis, used the
TidyTuesday and MapPromptMonday 2023/1
January 5, 2023
Europe & map & death & Eurostat & Data Visualization & Map
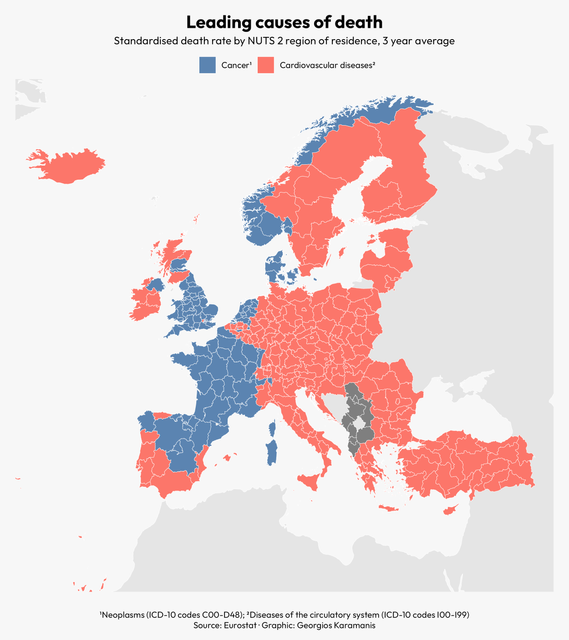 Cross post for #MapPromptMonday and #TidyTuesday. Leading cause of death by European NUTS 2 regions, trying out the eurostat R package for getting
TidyTuesday 2022/52
January 1, 2023
Star Trek & R & timeline & Data Visualization
Cross post for #MapPromptMonday and #TidyTuesday. Leading cause of death by European NUTS 2 regions, trying out the eurostat R package for getting
TidyTuesday 2022/52
January 1, 2023
Star Trek & R & timeline & Data Visualization
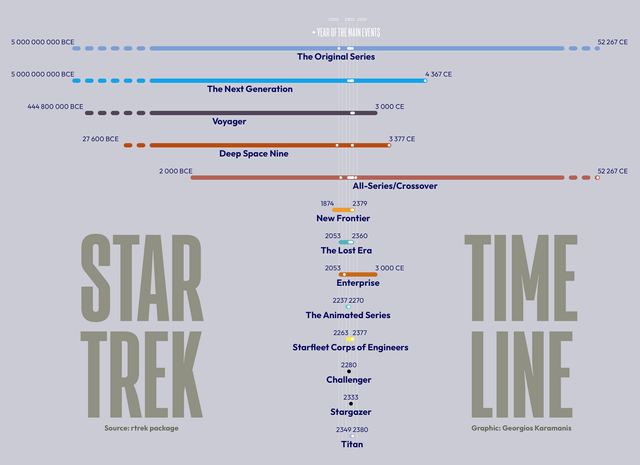 Star Trek timelines for this week’s #TidyTuesday. code at GitHub
TidyTuesday 2022/51
December 23, 2022
R & US & map & weather & wind & Data Visualization
Star Trek timelines for this week’s #TidyTuesday. code at GitHub
TidyTuesday 2022/51
December 23, 2022
R & US & map & weather & wind & Data Visualization
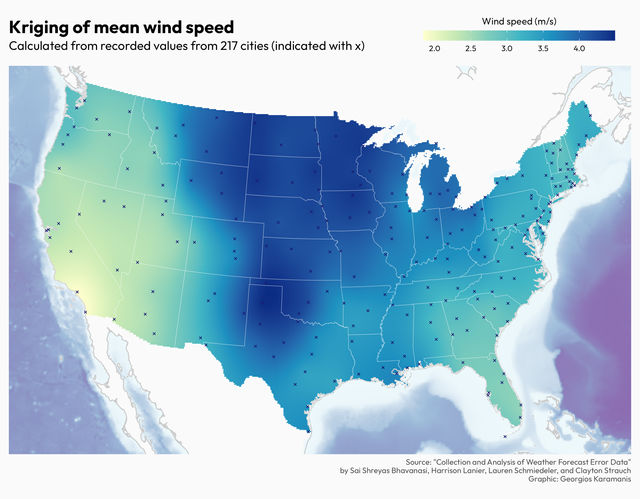 Mean wind speed for this week’s #TidyTuesday. First time using kriging interpolaration, inspired by the plots in the poster at the source of the
TidyTuesday 2022/50
December 17, 2022
R & retail & sales & US & Data Visualization
Mean wind speed for this week’s #TidyTuesday. First time using kriging interpolaration, inspired by the plots in the poster at the source of the
TidyTuesday 2022/50
December 17, 2022
R & retail & sales & US & Data Visualization
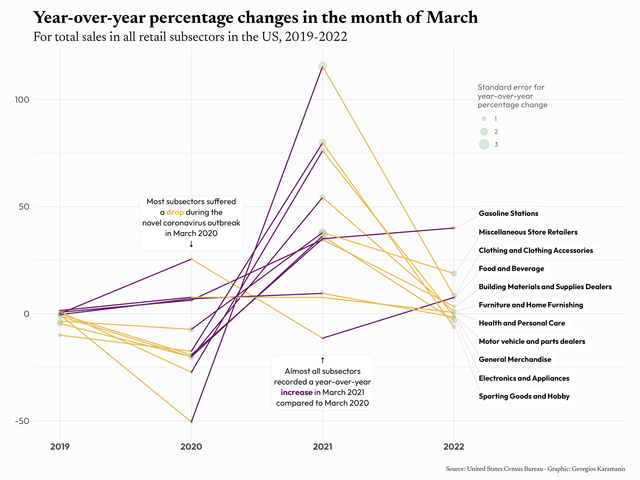 Retail sales for this week’s #TidyTuesday, comparing the YOY changes in March 2019-2022. Code on GitHub
TidyTuesday 2022/49
December 9, 2022
R & Manhattan & New York & map & elevators & buildings & Data Visualization
Retail sales for this week’s #TidyTuesday, comparing the YOY changes in March 2019-2022. Code on GitHub
TidyTuesday 2022/49
December 9, 2022
R & Manhattan & New York & map & elevators & buildings & Data Visualization
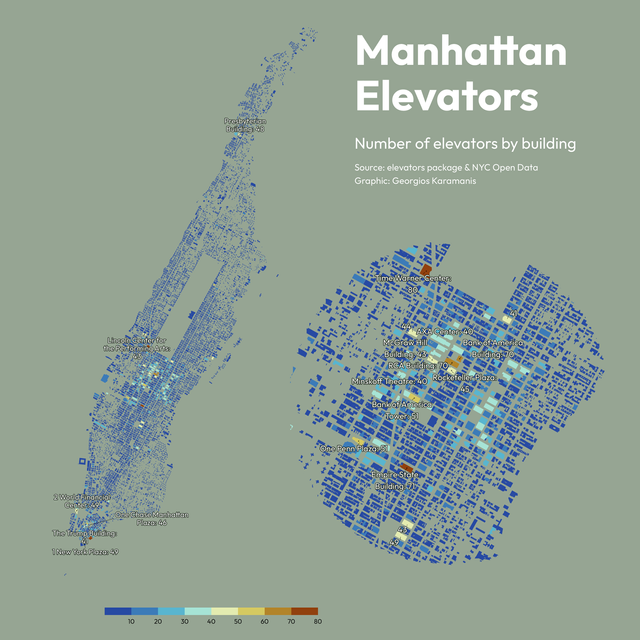 Number of elevators by building for this week’s #TidyTuesday, combining the elevator dataset with the building footprints spatial file from NYC Open
TidyTuesday 2022/48
December 3, 2022
R & TidyTuesday & football & FIFA & Data Visualization
Number of elevators by building for this week’s #TidyTuesday, combining the elevator dataset with the building footprints spatial file from NYC Open
TidyTuesday 2022/48
December 3, 2022
R & TidyTuesday & football & FIFA & Data Visualization
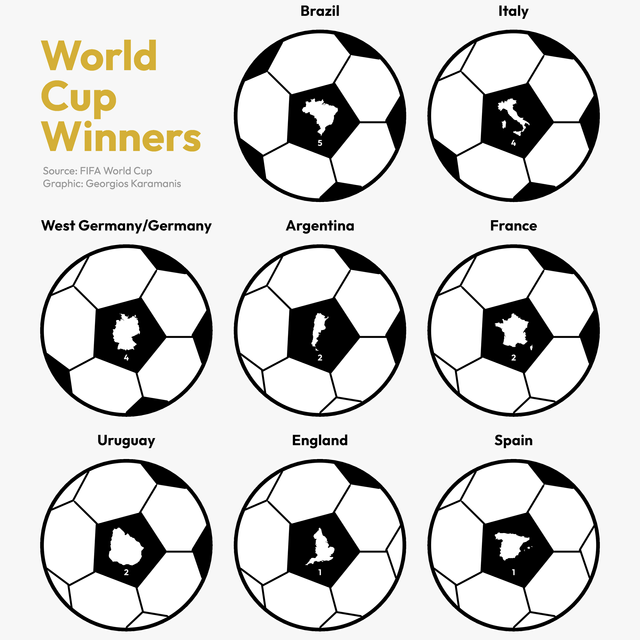 Number of FIFA World Cup titles for this week’s #TidyTuesday Code on GitHub
TidyTuesday 2022/47
November 27, 2022
R & Great Britain & map & museum & Data Visualization
Number of FIFA World Cup titles for this week’s #TidyTuesday Code on GitHub
TidyTuesday 2022/47
November 27, 2022
R & Great Britain & map & museum & Data Visualization
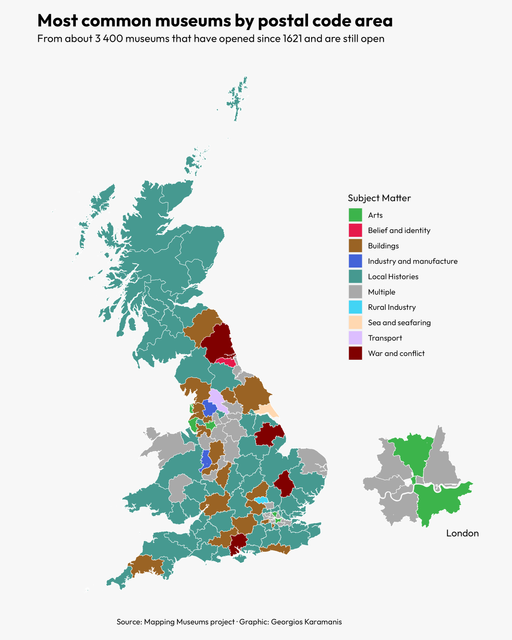 Most common types of museums for this week’s #TidyTuesday Code on GitHub
TidyTuesday 2022/46
November 20, 2022
webpages & Internet & speed & TidyTuesday & R & Data Visualization
Most common types of museums for this week’s #TidyTuesday Code on GitHub
TidyTuesday 2022/46
November 20, 2022
webpages & Internet & speed & TidyTuesday & R & Data Visualization
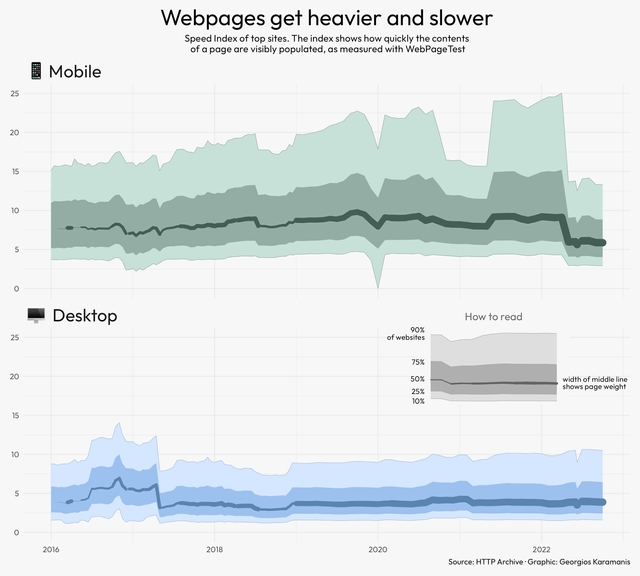 Webpages speed for this week’s #TidyTuesday code on GitHub
TidyTuesday 2022/45
November 8, 2022
radio stations & FM & US & Data Visualization
Webpages speed for this week’s #TidyTuesday code on GitHub
TidyTuesday 2022/45
November 8, 2022
radio stations & FM & US & Data Visualization
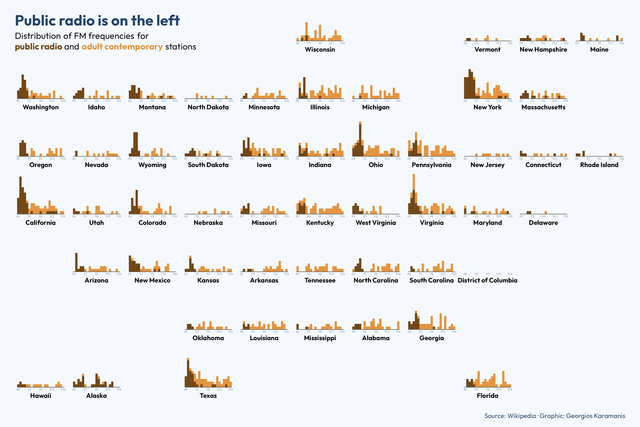 For this week’s #TidyTuesday I plotted the distribution of FM frequencies for public radio and adult contemporary stations by state Code on GitHub
TidyTuesday 2022/44
November 6, 2022
zombie & horror movies & TidyTuesday & Data Visualization
For this week’s #TidyTuesday I plotted the distribution of FM frequencies for public radio and adult contemporary stations by state Code on GitHub
TidyTuesday 2022/44
November 6, 2022
zombie & horror movies & TidyTuesday & Data Visualization
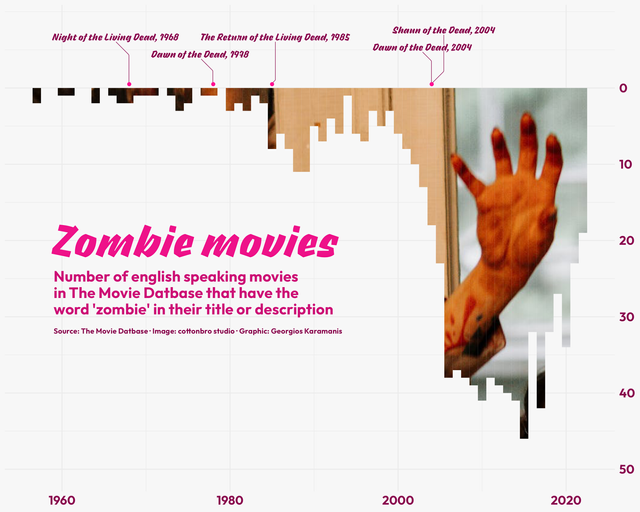 Zombie movies for this week’s #TidyTuesday Code on GitHub
TidyTuesday 2022/43
October 27, 2022
R & British Bake Off & anchor chart & TV & Data Visualization
Zombie movies for this week’s #TidyTuesday Code on GitHub
TidyTuesday 2022/43
October 27, 2022
R & British Bake Off & anchor chart & TV & Data Visualization
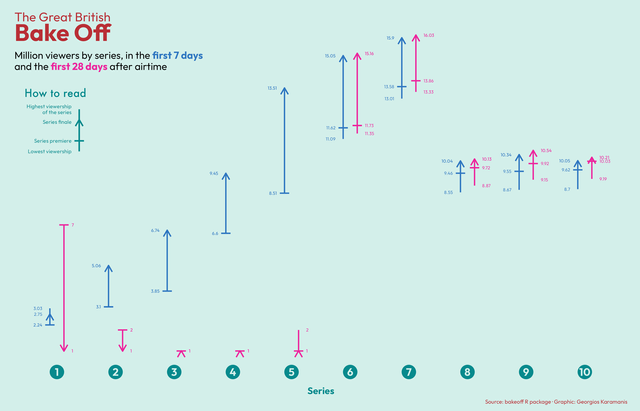 For this week’s #TidyTuesday I made an… anchor chart (as seen in this post). Code on GitHub
TidyTuesday 2022/42
October 23, 2022
TV & Stranger Things & R & TidyTuesday & Data Visualization
For this week’s #TidyTuesday I made an… anchor chart (as seen in this post). Code on GitHub
TidyTuesday 2022/42
October 23, 2022
TV & Stranger Things & R & TidyTuesday & Data Visualization
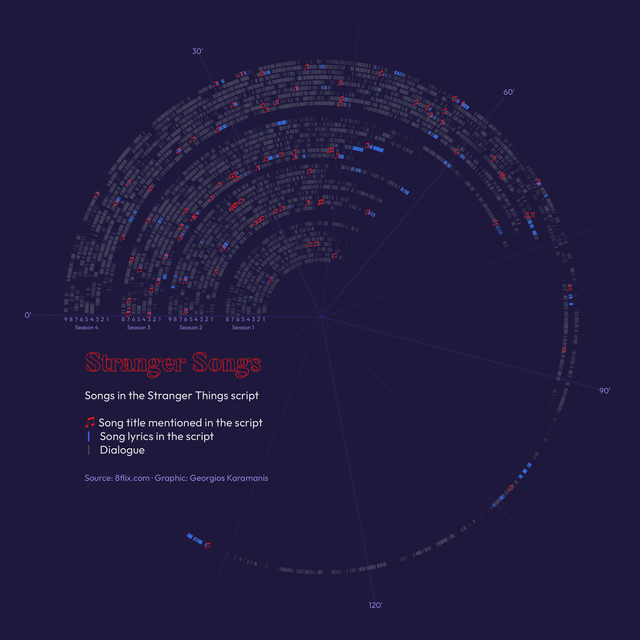 For this week’s #TidyTuesday I plotted the songs of Stranger Things Code on GitHub
TidyTuesday 2022/41
October 16, 2022
yarn & knitting & Ravelry & TidyTuesday & Data Visualization
For this week’s #TidyTuesday I plotted the songs of Stranger Things Code on GitHub
TidyTuesday 2022/41
October 16, 2022
yarn & knitting & Ravelry & TidyTuesday & Data Visualization
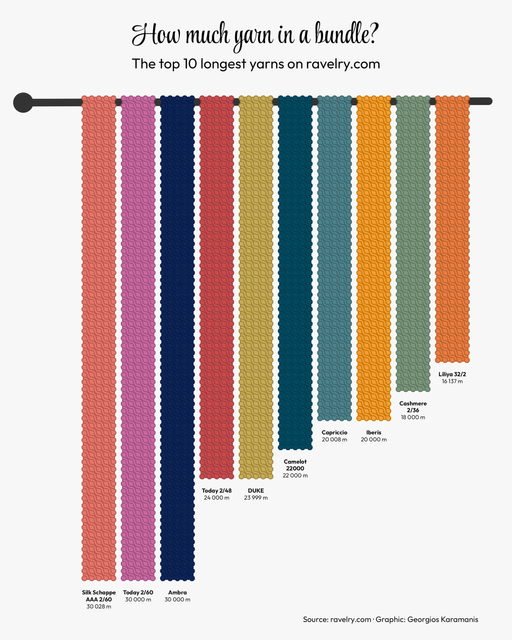 For this week’s #TidyTuesday I knitted the longest yarn bundles on ravelry.com Code on GitHub
TidyTuesday 2022/40
October 7, 2022
emoji & Product Hunt & waffle & R & TidyTuesday & Data Visualization
For this week’s #TidyTuesday I knitted the longest yarn bundles on ravelry.com Code on GitHub
TidyTuesday 2022/40
October 7, 2022
emoji & Product Hunt & waffle & R & TidyTuesday & Data Visualization
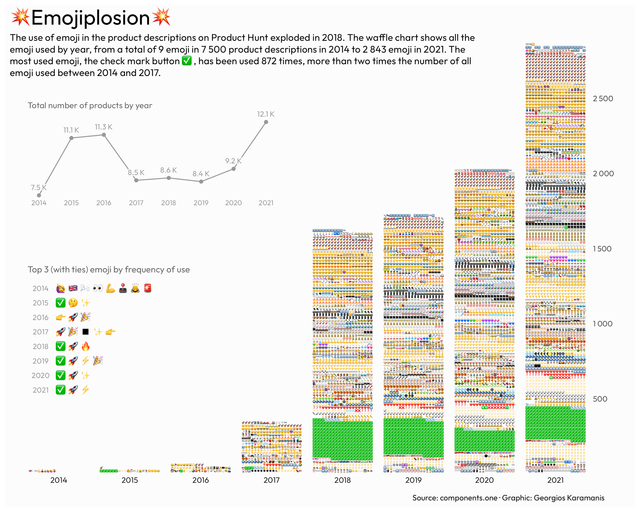 For this week’s #TidyTuesday I made a ✅ waffle chart and ✅ two more charts ✅ with all the emoji used in Product Hunt product descriptions code on
TidyTuesday 2022/39
September 28, 2022
artists & map & US & R & TidyTuesday & Data Visualization
For this week’s #TidyTuesday I made a ✅ waffle chart and ✅ two more charts ✅ with all the emoji used in Product Hunt product descriptions code on
TidyTuesday 2022/39
September 28, 2022
artists & map & US & R & TidyTuesday & Data Visualization
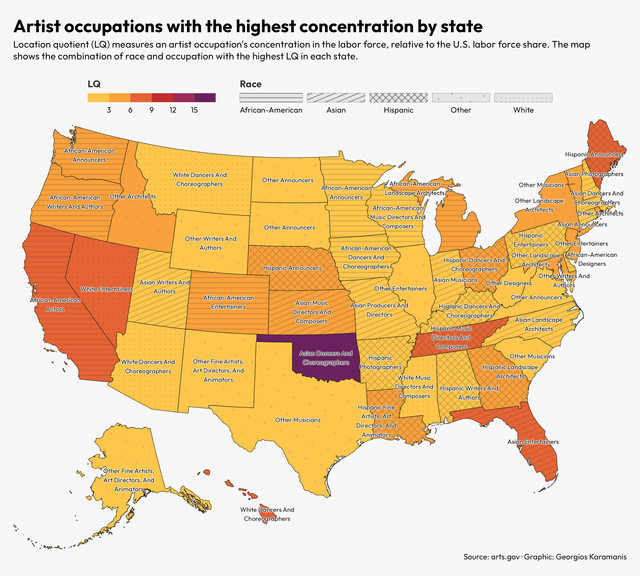 For this week’s #TidyTuesday I created a map of the combination of race and artist occupation with the highest concentration by state code on GitHub
TidyTuesday 2022/38
September 24, 2022
wastewater treatment plants & R & map & Mediterranean sea & Data Visualization
For this week’s #TidyTuesday I created a map of the combination of race and artist occupation with the highest concentration by state code on GitHub
TidyTuesday 2022/38
September 24, 2022
wastewater treatment plants & R & map & Mediterranean sea & Data Visualization
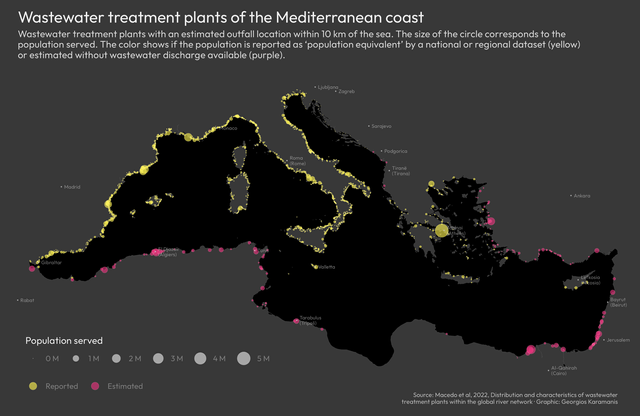 For this week’s #TidyTuesday I created a map of the wastewater treatment plants around the Mediterranean code on GitHub
TidyTuesday 2022/37
September 16, 2022
Bigfoot & bear & US & map & R & Data Visualization
For this week’s #TidyTuesday I created a map of the wastewater treatment plants around the Mediterranean code on GitHub
TidyTuesday 2022/37
September 16, 2022
Bigfoot & bear & US & map & R & Data Visualization
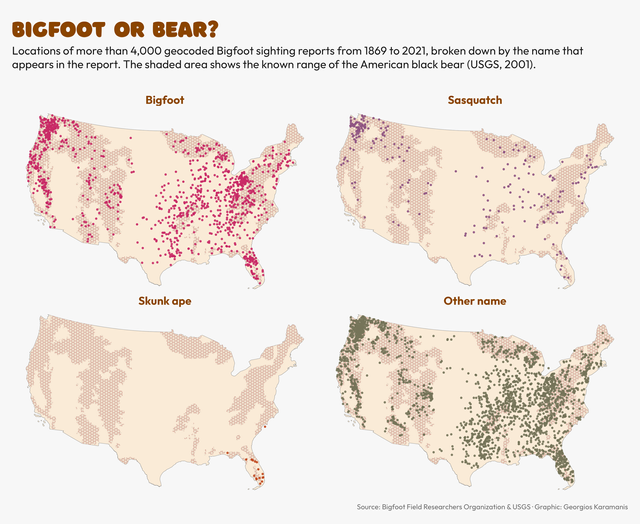 Bigfoot or bear for this week’s #TidyTuesday code on GitHub
TidyTuesday 2022/35
September 1, 2022
R & Pell grant & mekko & Data Visualization
Bigfoot or bear for this week’s #TidyTuesday code on GitHub
TidyTuesday 2022/35
September 1, 2022
R & Pell grant & mekko & Data Visualization
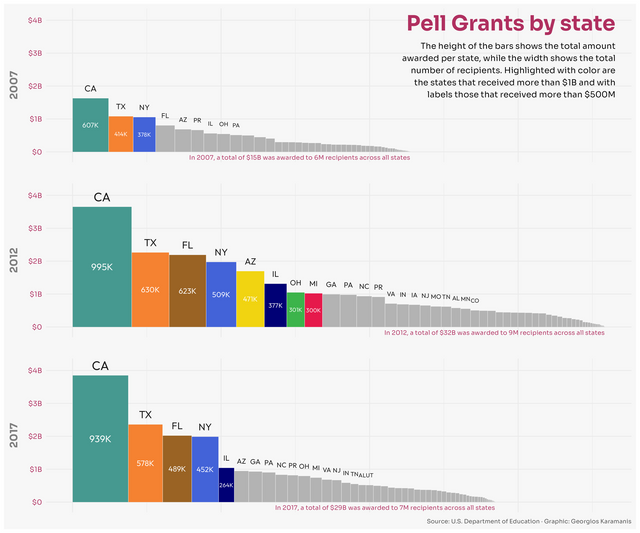 For this week’s #TidyTuesday I made a bar Mekko chart of the Pell grants by state for 2007, 2012 and 2017. It was too late in the process when I
TidyTuesday 2022/34
August 27, 2022
chips & PlayStation & Xbox & console & Data Visualization
For this week’s #TidyTuesday I made a bar Mekko chart of the Pell grants by state for 2007, 2012 and 2017. It was too late in the process when I
TidyTuesday 2022/34
August 27, 2022
chips & PlayStation & Xbox & console & Data Visualization
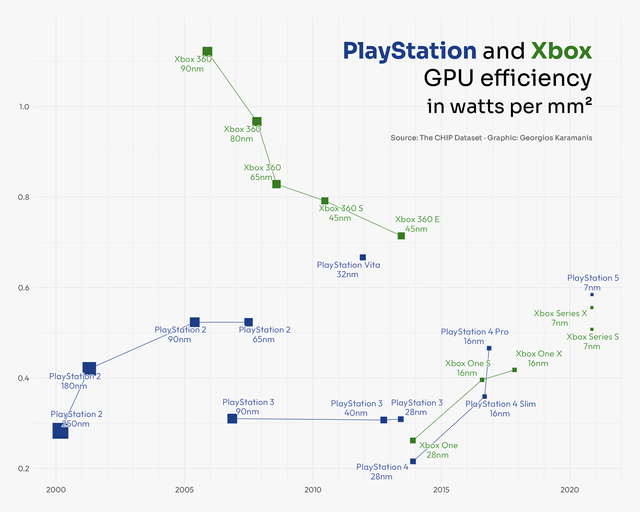 For this week’s #TidyTuesday I plotted the efficiency of GPUs in watts/mm2 for PlayStation and Xbox consoles. code on GitHub
TidyTuesday 2022/33
August 21, 2022
personality & R & Data Visualization
For this week’s #TidyTuesday I plotted the efficiency of GPUs in watts/mm2 for PlayStation and Xbox consoles. code on GitHub
TidyTuesday 2022/33
August 21, 2022
personality & R & Data Visualization
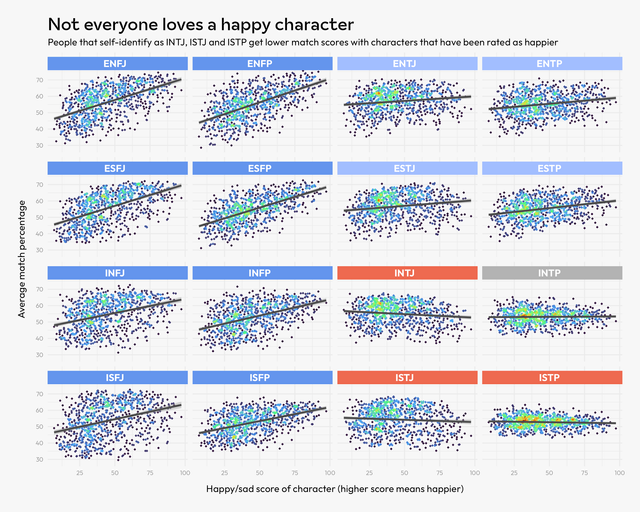 For this week’s #TidyTuesday I plotted the average match score with a character vs. the happy/sad rating of the character. The plots show the
TidyTuesday 2022/32
August 12, 2022
R & Ferris wheels & Data Visualization
For this week’s #TidyTuesday I plotted the average match score with a character vs. the happy/sad rating of the character. The plots show the
TidyTuesday 2022/32
August 12, 2022
R & Ferris wheels & Data Visualization
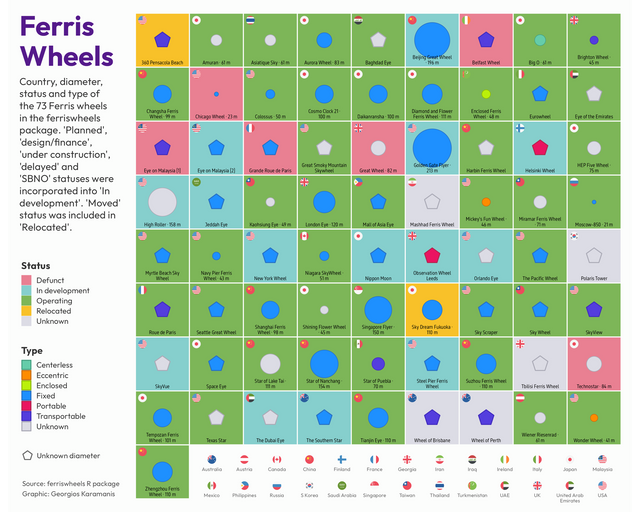 For this week’s #TidyTuesday I plotted the country, diameter, status and type of the 73 Ferris wheels in the ferriswheels R package by Emil
TidyTuesday 2022/31
August 7, 2022
R & frogs & heatmap & map & Data Visualization
For this week’s #TidyTuesday I plotted the country, diameter, status and type of the 73 Ferris wheels in the ferriswheels R package by Emil
TidyTuesday 2022/31
August 7, 2022
R & frogs & heatmap & map & Data Visualization
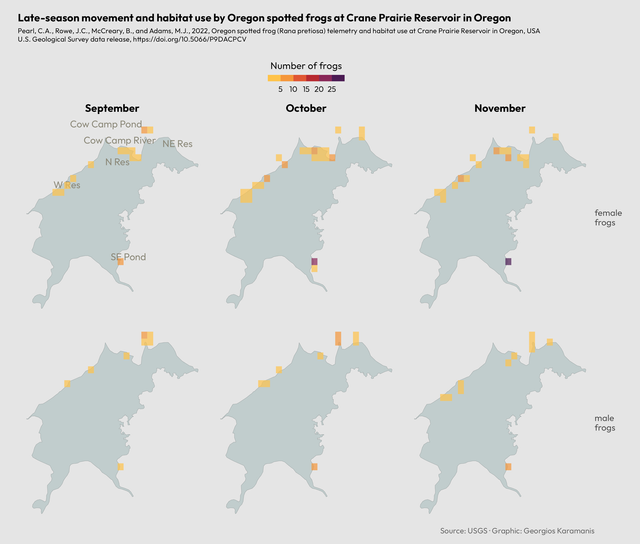 For this week’s #TidyTuesday I made a simple heatmap of frog observations by month and sex code on GitHub
TidyTuesday 2022/29
July 24, 2022
TidyTuesday & Nordics & beds & healthcare & Data Visualization
For this week’s #TidyTuesday I made a simple heatmap of frog observations by month and sex code on GitHub
TidyTuesday 2022/29
July 24, 2022
TidyTuesday & Nordics & beds & healthcare & Data Visualization
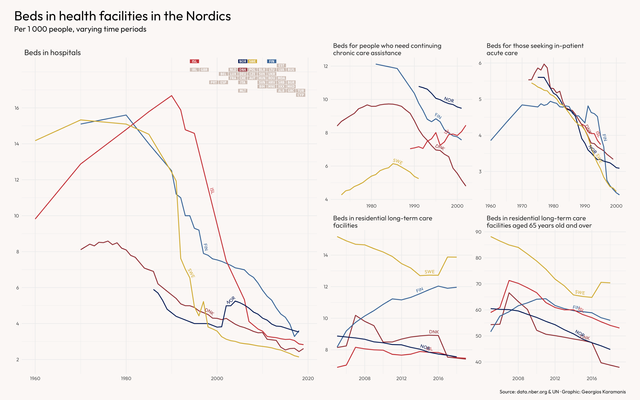 For this week’s #TidyTuesday I looked at the number of beds in hospitals and other health facilities in the Nordics code on GitHub
TidyTuesday 2022/28
July 15, 2022
Greece & flights & R & Data Visualization
For this week’s #TidyTuesday I looked at the number of beds in hospitals and other health facilities in the Nordics code on GitHub
TidyTuesday 2022/28
July 15, 2022
Greece & flights & R & Data Visualization
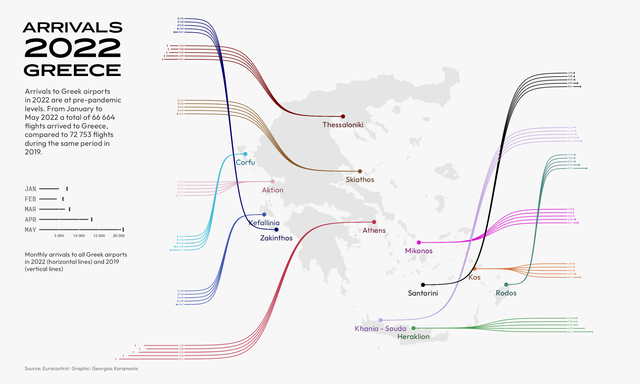 For this week’s #TidyTuesday I plotted the arrivals to Greek airports in 2022 compared to 2019. code on GitHub
TidyTuesday 2022/27
July 7, 2022
San Francisco & map & rent & Data Visualization
For this week’s #TidyTuesday I plotted the arrivals to Greek airports in 2022 compared to 2019. code on GitHub
TidyTuesday 2022/27
July 7, 2022
San Francisco & map & rent & Data Visualization
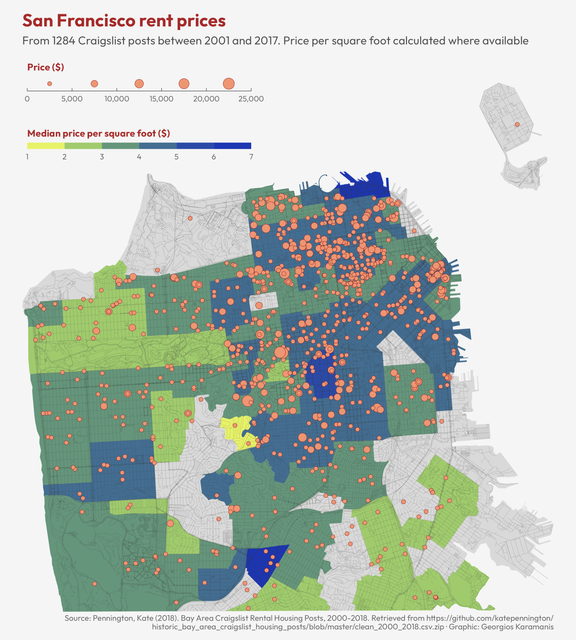 San Francisco rent prices for this week’s #TidyTuesday. Data source: katepennington.org Inspiration and code from Phil Massicotte’s SF trees plot
TidyTuesday 2022/26
July 2, 2022
TidyTuesday & gender & pay gap & map & Data Visualization
San Francisco rent prices for this week’s #TidyTuesday. Data source: katepennington.org Inspiration and code from Phil Massicotte’s SF trees plot
TidyTuesday 2022/26
July 2, 2022
TidyTuesday & gender & pay gap & map & Data Visualization
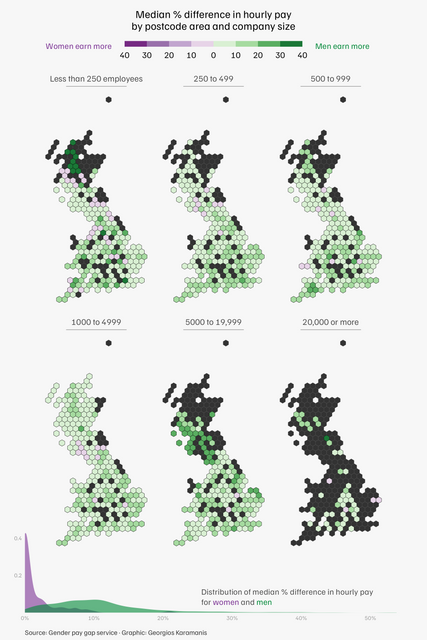 Gender pay gap by company size and postcode area for this week’s #TidyTuesday, using the geogrid package to create a hex grid from a gpkg file. Code
What’s the most common type of livestock in each county - Swedish version
June 24, 2022
animal & livestock & map & Sweden & people & Data Visualization
Gender pay gap by company size and postcode area for this week’s #TidyTuesday, using the geogrid package to create a hex grid from a gpkg file. Code
What’s the most common type of livestock in each county - Swedish version
June 24, 2022
animal & livestock & map & Sweden & people & Data Visualization
 When I saw Erin’s post a couple of days ago, I immediately wanted to do same for Sweden and started searching for data sources. Screenshot from
TidyTuesday 2022/25
June 23, 2022
slavery & TidyTuesday & Data Visualization
When I saw Erin’s post a couple of days ago, I immediately wanted to do same for Sweden and started searching for data sources. Screenshot from
TidyTuesday 2022/25
June 23, 2022
slavery & TidyTuesday & Data Visualization
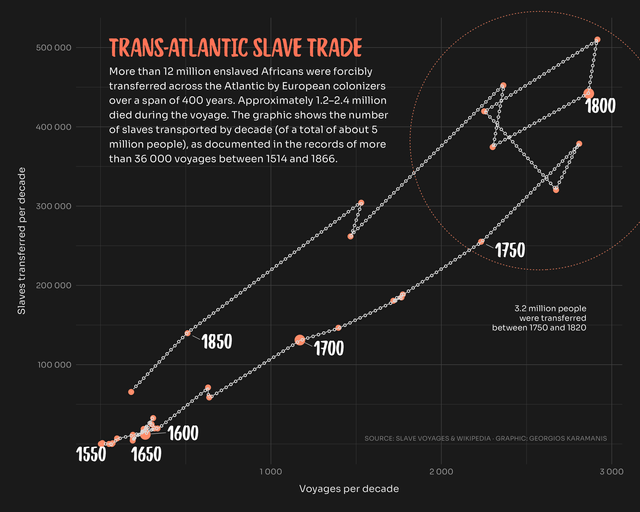 For this week’s #TidyTuesday I revisited a plot about the Trans-Atlantic slave trade I did two years ago. Code on GitHub
TidyTuesday 2022/24
June 16, 2022
drought & US & map & R & Data Visualization
For this week’s #TidyTuesday I revisited a plot about the Trans-Atlantic slave trade I did two years ago. Code on GitHub
TidyTuesday 2022/24
June 16, 2022
drought & US & map & R & Data Visualization
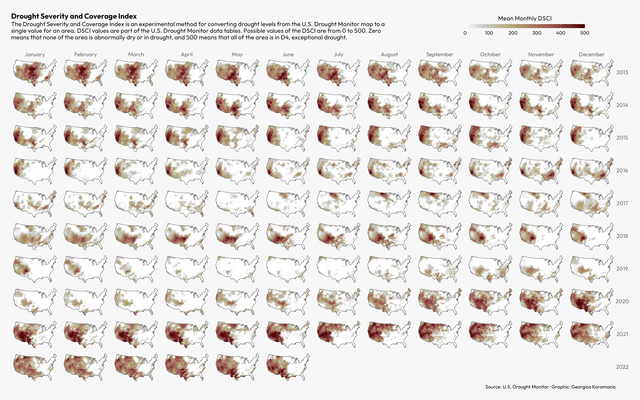 Small multiples mapping the Drought Severity and Coverage Index the last 10 years for this week’s #TidyTuesday. The subtitle text was taken from the
TidyTuesday 2022/23
June 10, 2022
Pride & R & corporate & donations & Data Visualization
Small multiples mapping the Drought Severity and Coverage Index the last 10 years for this week’s #TidyTuesday. The subtitle text was taken from the
TidyTuesday 2022/23
June 10, 2022
Pride & R & corporate & donations & Data Visualization
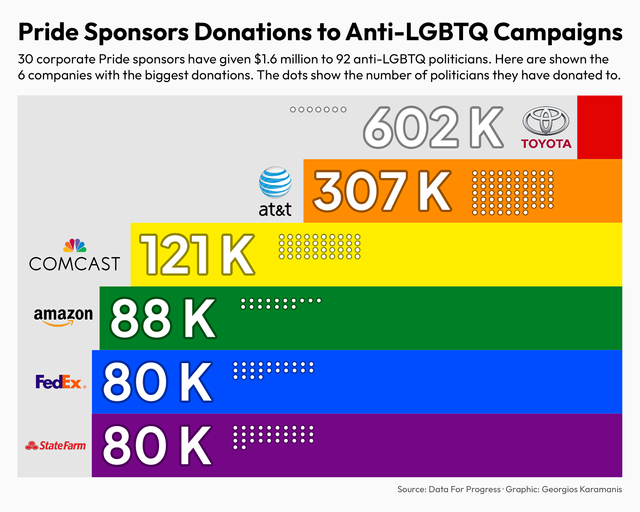 Pride Sponsors Donations to Anti-LGBTQ Campaigns for this week’s #TidyTuesday Source: Data for Progress code on GitHub
TidyTuesday 2022/22
June 3, 2022
table & reputation & Axios & reactable & Data Visualization
Pride Sponsors Donations to Anti-LGBTQ Campaigns for this week’s #TidyTuesday Source: Data for Progress code on GitHub
TidyTuesday 2022/22
June 3, 2022
table & reputation & Axios & reactable & Data Visualization
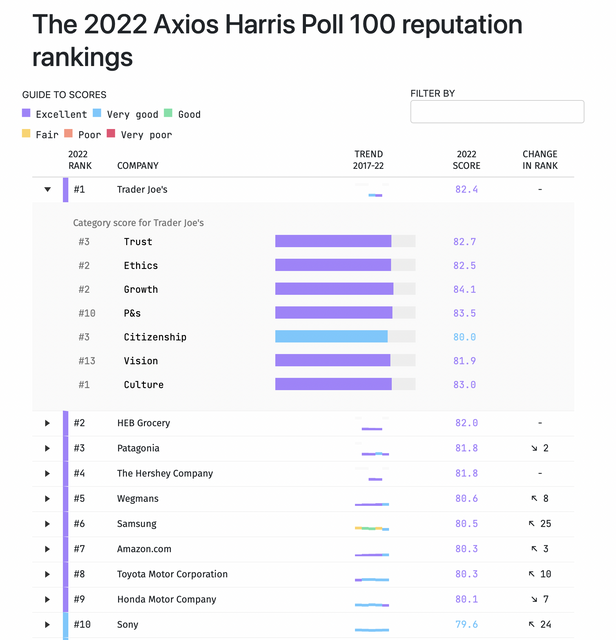 For this week’s #TidyTuesday I recreated most parts of the Axios original table with the reactable and reactablefmtr packages. code on GitHub
TidyTuesday 2022/21
May 29, 2022
rugby & TidyTuesday & map & Europe & Sweden & sports & Data Visualization
For this week’s #TidyTuesday I recreated most parts of the Axios original table with the reactable and reactablefmtr packages. code on GitHub
TidyTuesday 2022/21
May 29, 2022
rugby & TidyTuesday & map & Europe & Sweden & sports & Data Visualization
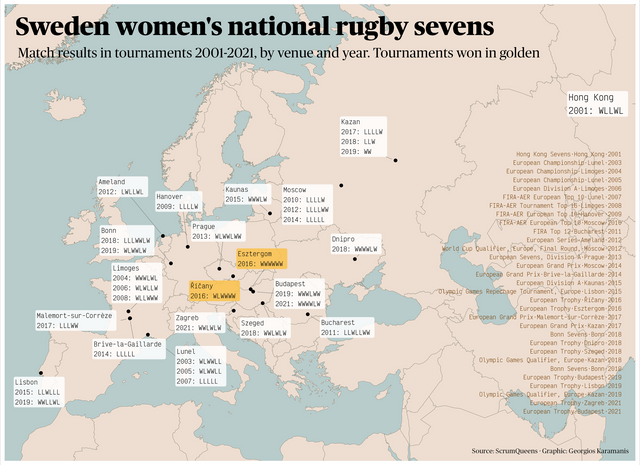 Match results of Sweden women’s national rugby sevens for this week’s #TidyTuesday code on GitHub
TidyTuesday 2022/20
May 19, 2022
Eurovision & scoreboard & R & tutorial & Data Visualization
Match results of Sweden women’s national rugby sevens for this week’s #TidyTuesday code on GitHub
TidyTuesday 2022/20
May 19, 2022
Eurovision & scoreboard & R & tutorial & Data Visualization
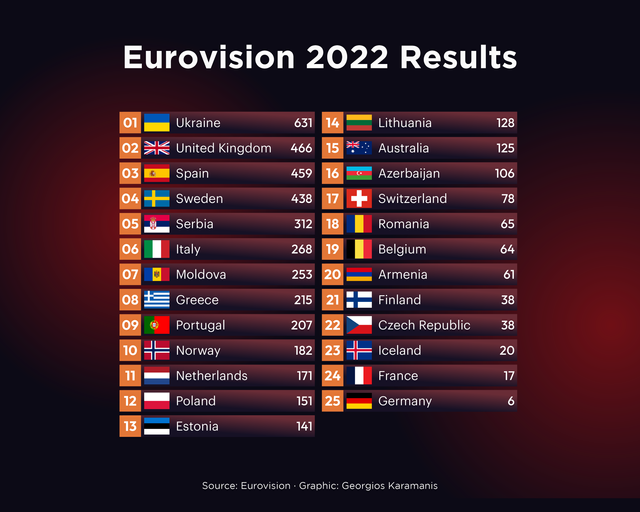 For this week’s #TidyTuesday I recreated the scoreboard from this year’s Eurovision with ggplot. code on GitHub Here is a mini tutorial: I used
TidyTuesday 2022/19
May 11, 2022
R & TidyTuesday & books & New York Times & bestsellers & Data Visualization
For this week’s #TidyTuesday I recreated the scoreboard from this year’s Eurovision with ggplot. code on GitHub Here is a mini tutorial: I used
TidyTuesday 2022/19
May 11, 2022
R & TidyTuesday & books & New York Times & bestsellers & Data Visualization
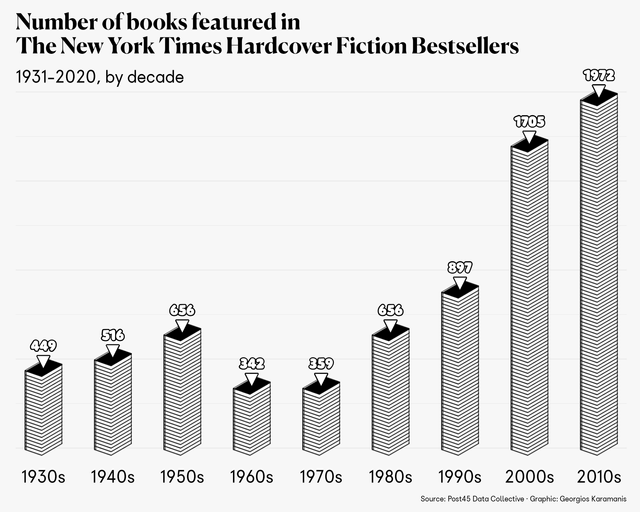 Number of books featured in The New York Times Hardcover Fiction Bestsellers for this week’s #TidyTuesday. First “published” plot using {ggsvg} Code
TidyTuesday 2022/18
May 8, 2022
R & energy & solar & wind & TidyTuesday & Data Visualization
Number of books featured in The New York Times Hardcover Fiction Bestsellers for this week’s #TidyTuesday. First “published” plot using {ggsvg} Code
TidyTuesday 2022/18
May 8, 2022
R & energy & solar & wind & TidyTuesday & Data Visualization
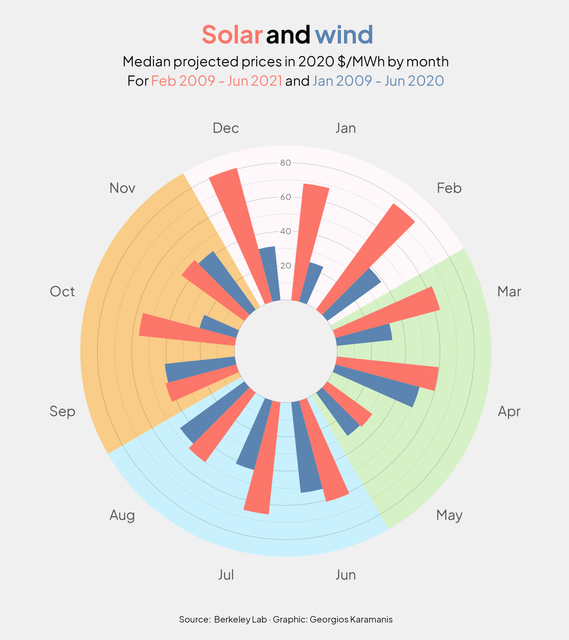 Solar and wind costs by month of year for this week’s #TidyTuesday Code on GitHub
TidyTuesday 2022/17
April 29, 2022
R & Kaggle & people & Data Visualization
Solar and wind costs by month of year for this week’s #TidyTuesday Code on GitHub
TidyTuesday 2022/17
April 29, 2022
R & Kaggle & people & Data Visualization
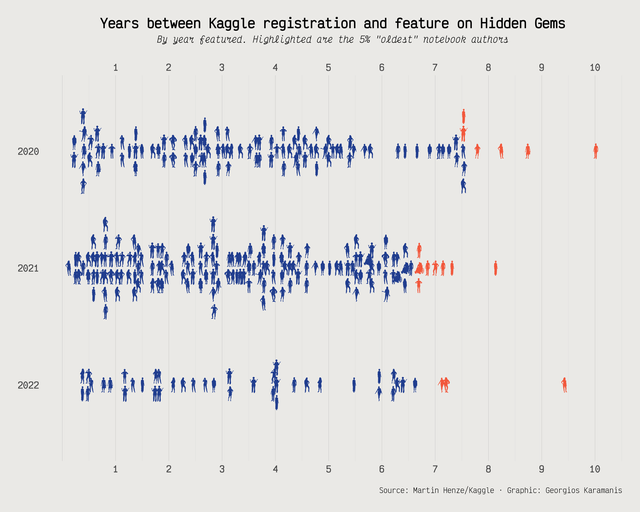 For this week’s #TidyTuesday I used the new family aesthetic of ggdist::geom_dots() to plot the Kaggle age of the notebook authors featured on
TidyTuesday 2022/16
April 22, 2022
crossword & The Times & Jumbo & cryptic & R & Data Visualization
For this week’s #TidyTuesday I used the new family aesthetic of ggdist::geom_dots() to plot the Kaggle age of the notebook authors featured on
TidyTuesday 2022/16
April 22, 2022
crossword & The Times & Jumbo & cryptic & R & Data Visualization
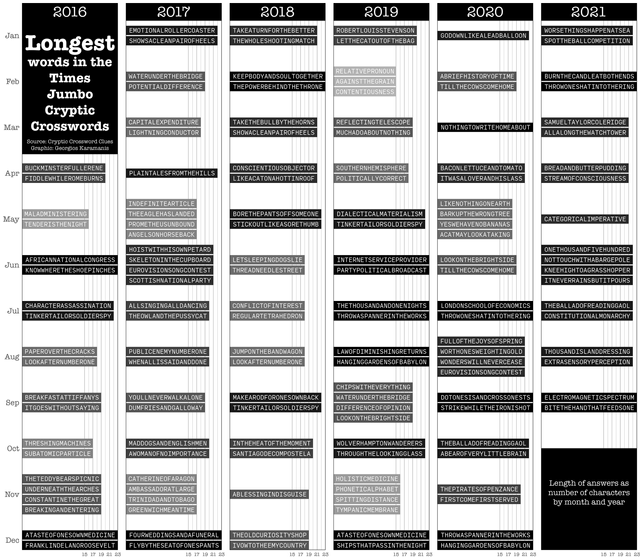 For this week’s #TidyTuesday I looked at the longest answers in The Times Jumbo Cryptic Crosswords. code and full-size image on GitHub
TidyTuesday 2022/15
April 14, 2022
indoor air pollution & R & world & Data Visualization
For this week’s #TidyTuesday I looked at the longest answers in The Times Jumbo Cryptic Crosswords. code and full-size image on GitHub
TidyTuesday 2022/15
April 14, 2022
indoor air pollution & R & world & Data Visualization
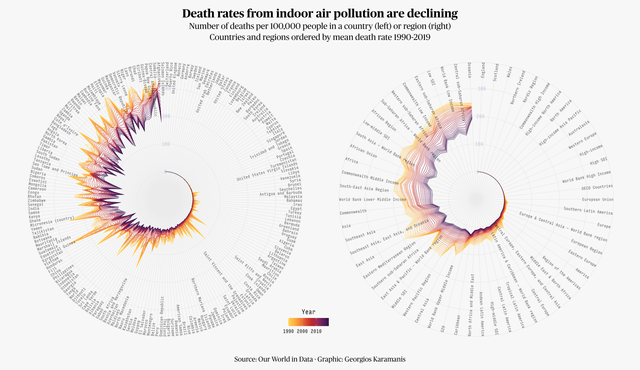 Deaths from indoor air pollution for this week’s #TidyTuesday. Not the most readable chart but I got a little too excited making it, used two hacks
TidyTuesday 2022/14
April 8, 2022
news organizations & R & characters & Data Visualization
Deaths from indoor air pollution for this week’s #TidyTuesday. Not the most readable chart but I got a little too excited making it, used two hacks
TidyTuesday 2022/14
April 8, 2022
news organizations & R & characters & Data Visualization
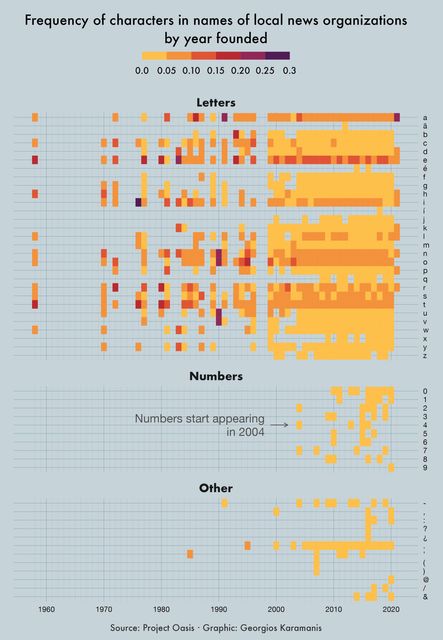 For this week’s #TidyTuesday I looked at the frequency of characters in names of U.S. local news organizations by the year they were founded.
TidyTuesday 2022/13
April 1, 2022
sports & US & map & R & Data Visualization
For this week’s #TidyTuesday I looked at the frequency of characters in names of U.S. local news organizations by the year they were founded.
TidyTuesday 2022/13
April 1, 2022
sports & US & map & R & Data Visualization
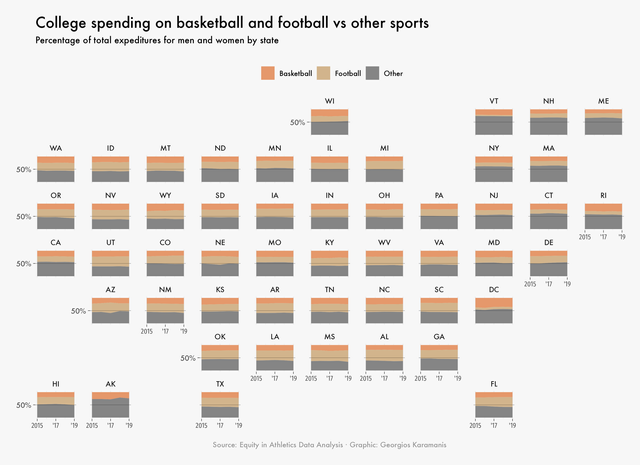 College spending on basketball and football vs other sports for this week’s #TidyTuesday Code on GitHub
TidyTuesday 2022/12
March 23, 2022
names & R & Data Visualization
College spending on basketball and football vs other sports for this week’s #TidyTuesday Code on GitHub
TidyTuesday 2022/12
March 23, 2022
names & R & Data Visualization
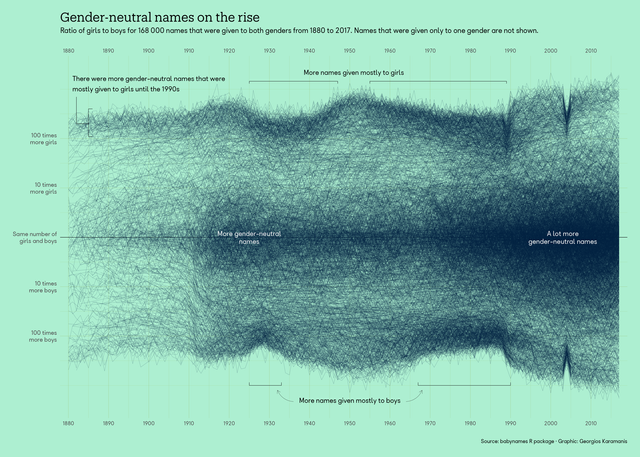 For this week’s #TidyTuesday I plotted the ratio of girls to boys for names that were given to both genders between 1880 and 2017 in the US. There
TidyTuesday 2022/11
March 19, 2022
R & packages & CRAN & Data Visualization
For this week’s #TidyTuesday I plotted the ratio of girls to boys for names that were given to both genders between 1880 and 2017 in the US. There
TidyTuesday 2022/11
March 19, 2022
R & packages & CRAN & Data Visualization
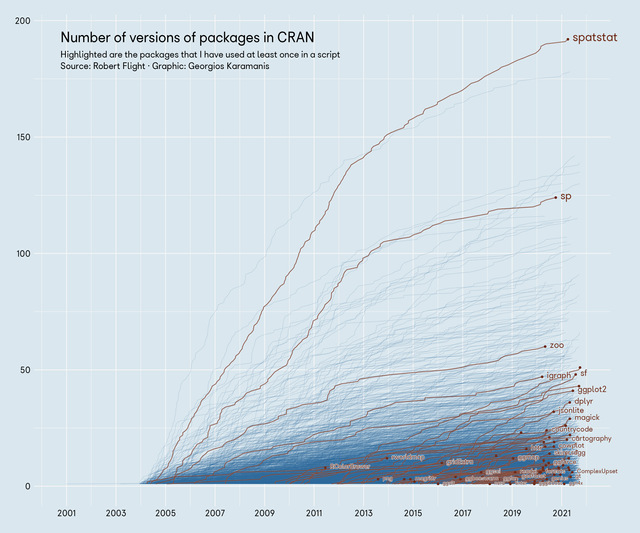 For this #TidyTuesday I plotted the number of versions of packages in CRAN and highlighted those I have used at least once. code on GitHub
TidyTuesday 2022/10
March 12, 2022
Erasmus & exchange & students & Europe & R & Data Visualization
For this #TidyTuesday I plotted the number of versions of packages in CRAN and highlighted those I have used at least once. code on GitHub
TidyTuesday 2022/10
March 12, 2022
Erasmus & exchange & students & Europe & R & Data Visualization
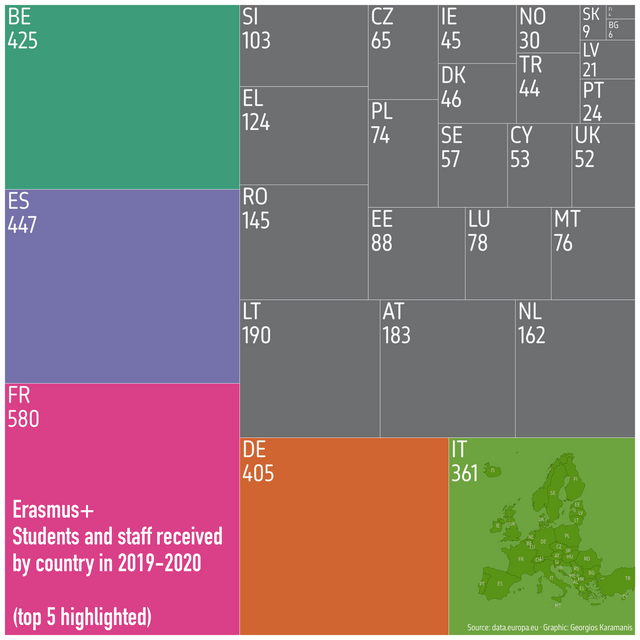 For this #TidyTuesday I made a tree map about the Erasmus+ students and staff received by each country in 2019-2020 code on GitHub
TidyTuesday 2022/09
March 2, 2022
R & EV & charging stations & US & map & TidyTuesday & Data Visualization
For this #TidyTuesday I made a tree map about the Erasmus+ students and staff received by each country in 2019-2020 code on GitHub
TidyTuesday 2022/09
March 2, 2022
R & EV & charging stations & US & map & TidyTuesday & Data Visualization
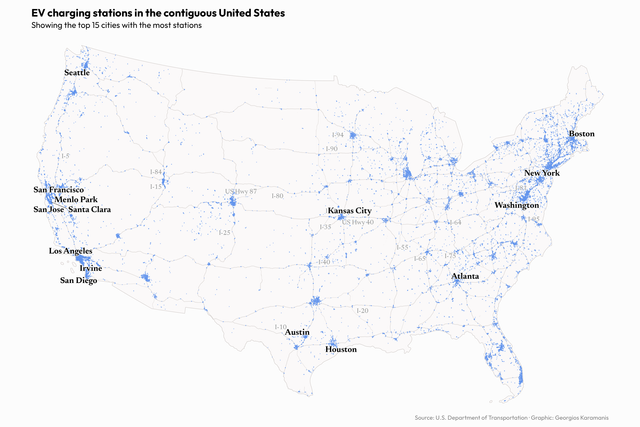 A map about EV charging stations in the US for this week’s #TidyTuesday. I wanted to make a simple and good-looking map, used another shapefile for
TidyTuesday 2022/08
February 25, 2022
R & Africa & political rights & civil liberties & map & Data Visualization
A map about EV charging stations in the US for this week’s #TidyTuesday. I wanted to make a simple and good-looking map, used another shapefile for
TidyTuesday 2022/08
February 25, 2022
R & Africa & political rights & civil liberties & map & Data Visualization
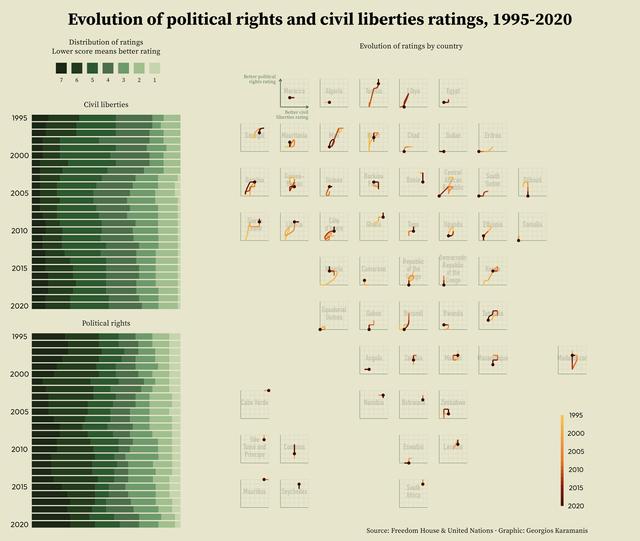 Political rights and civil liberties in Africa for this week’s #TidyTuesday code on GitHub
TidyTuesday 2022/07
February 17, 2022
R & DuBois & US & map & triangle & Data Visualization
Political rights and civil liberties in Africa for this week’s #TidyTuesday code on GitHub
TidyTuesday 2022/07
February 17, 2022
R & DuBois & US & map & triangle & Data Visualization
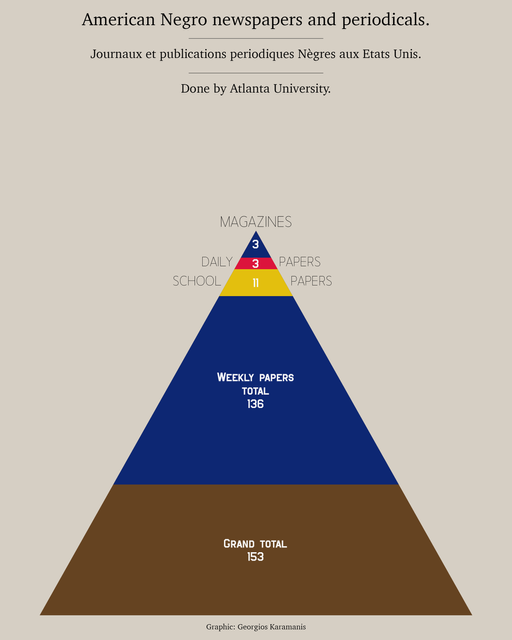 Two plots for this week’s #TidyTuesday and #DuBoisChallenge2022, recreating plates 61 and 42 Code on GitHub
TidyTuesday 2022/06
February 12, 2022
Tuskegee Airmen & R & TidyTuesday & Data Visualization
Two plots for this week’s #TidyTuesday and #DuBoisChallenge2022, recreating plates 61 and 42 Code on GitHub
TidyTuesday 2022/06
February 12, 2022
Tuskegee Airmen & R & TidyTuesday & Data Visualization
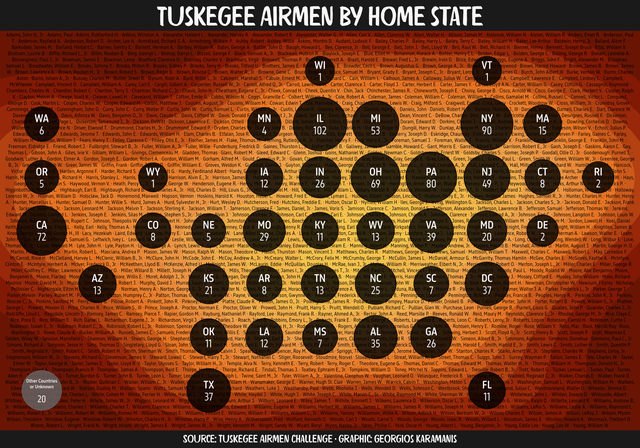 Home state of the Tuskegee Airmen for this week’s #TidyTuesday with data from the #TuskegeeAirmenChallenge Code on GitHub
Tallest buildings in Sweden
February 9, 2022
Sweden & buildings & dataviz & Data Visualization
Home state of the Tuskegee Airmen for this week’s #TidyTuesday with data from the #TuskegeeAirmenChallenge Code on GitHub
Tallest buildings in Sweden
February 9, 2022
Sweden & buildings & dataviz & Data Visualization
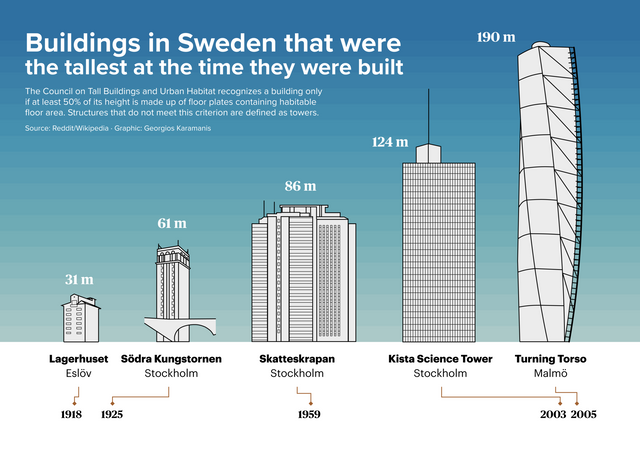 Wanted to try my hand at Figma, so I made this graphic about the tallest buildings in Sweden Idea from a post in r/Sweden
TidyTuesday 2022/05
February 1, 2022
R & dogs & dog breeds & Data Visualization
Wanted to try my hand at Figma, so I made this graphic about the tallest buildings in Sweden Idea from a post in r/Sweden
TidyTuesday 2022/05
February 1, 2022
R & dogs & dog breeds & Data Visualization
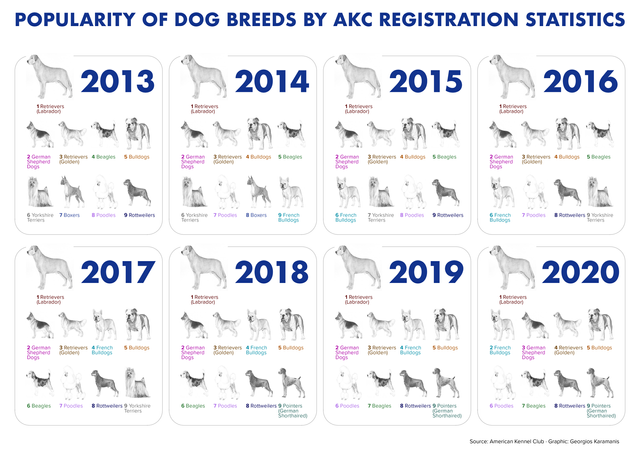 Popular dog breeds for this week’s #TidyTuesday with data from the American Kennel Club. Made with ggplot2, ggimage, ggtext and grid code on GitHub
TidyTuesday 2022/04
January 26, 2022
R & board games & Data Visualization
Popular dog breeds for this week’s #TidyTuesday with data from the American Kennel Club. Made with ggplot2, ggimage, ggtext and grid code on GitHub
TidyTuesday 2022/04
January 26, 2022
R & board games & Data Visualization
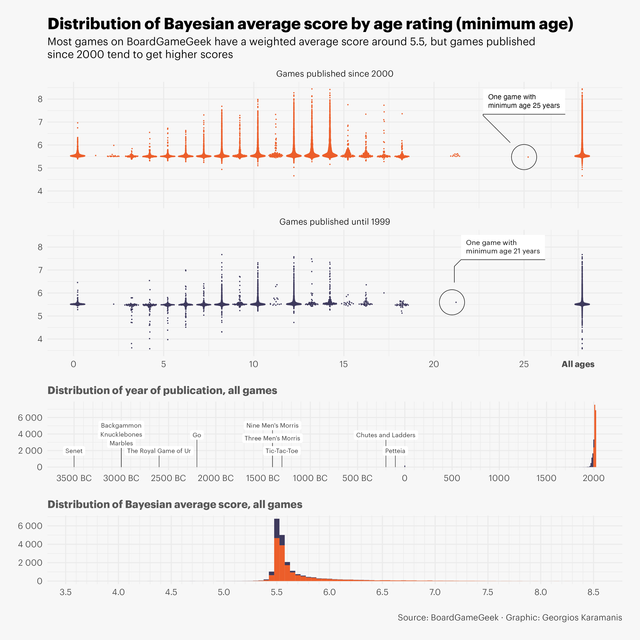 Board games for this week’s #TidyTuesday with data from @BoardGameGeek. Used a few packages to show different distributions and combine them into
TidyTuesday 2022/03
January 21, 2022
R & chocolate & cocoa & Data Visualization
Board games for this week’s #TidyTuesday with data from @BoardGameGeek. Used a few packages to show different distributions and combine them into
TidyTuesday 2022/03
January 21, 2022
R & chocolate & cocoa & Data Visualization
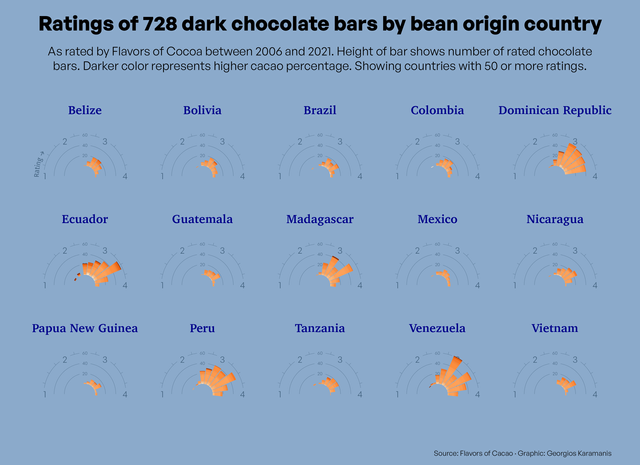 Dark chocolate bar ratings for this week’s #TidyTuesday. code: https://github.com/gkaramanis/tidytuesday/tree/master/2022/2022-week_03
TidyTuesday 2022/02
January 14, 2022
R & bees & Data Visualization
Dark chocolate bar ratings for this week’s #TidyTuesday. code: https://github.com/gkaramanis/tidytuesday/tree/master/2022/2022-week_03
TidyTuesday 2022/02
January 14, 2022
R & bees & Data Visualization
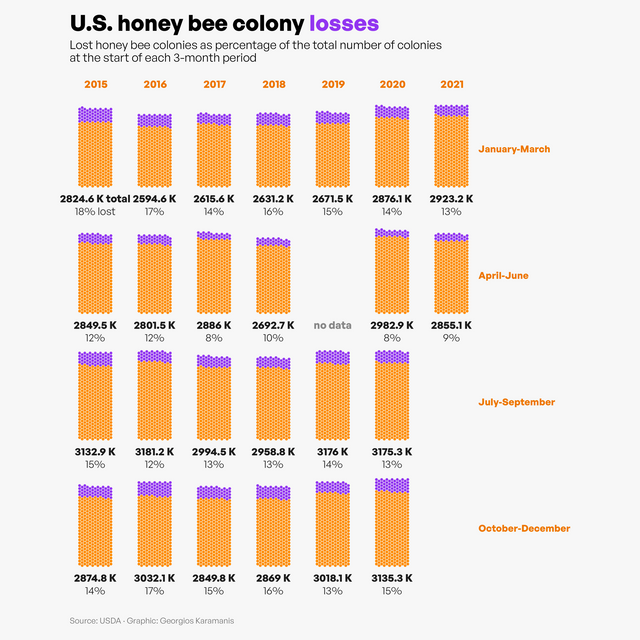 Honey bee colony losses for this week’s #TidyTuesday Code and plots for every state on GitHub
TidyTuesday 2022/01
January 5, 2022
R & hate crime & transphobic & Sweden & Data Visualization
Honey bee colony losses for this week’s #TidyTuesday Code and plots for every state on GitHub
TidyTuesday 2022/01
January 5, 2022
R & hate crime & transphobic & Sweden & Data Visualization
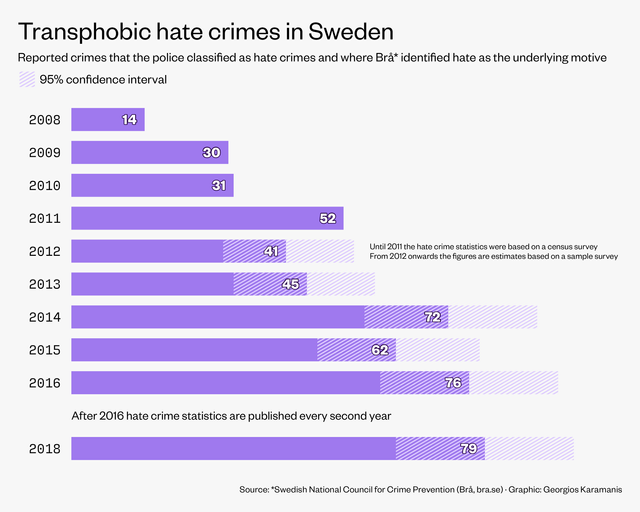 Transphobic hate crimes in Sweden for this week’s Bring Your Own Data #TidyTuesday. The inspiration was a plot made by @thomasoide for an Axios
TidyTuesday 2021/51
December 24, 2021
Starbucks & coffee & R & TidyTuesday & Data Visualization
Transphobic hate crimes in Sweden for this week’s Bring Your Own Data #TidyTuesday. The inspiration was a plot made by @thomasoide for an Axios
TidyTuesday 2021/51
December 24, 2021
Starbucks & coffee & R & TidyTuesday & Data Visualization
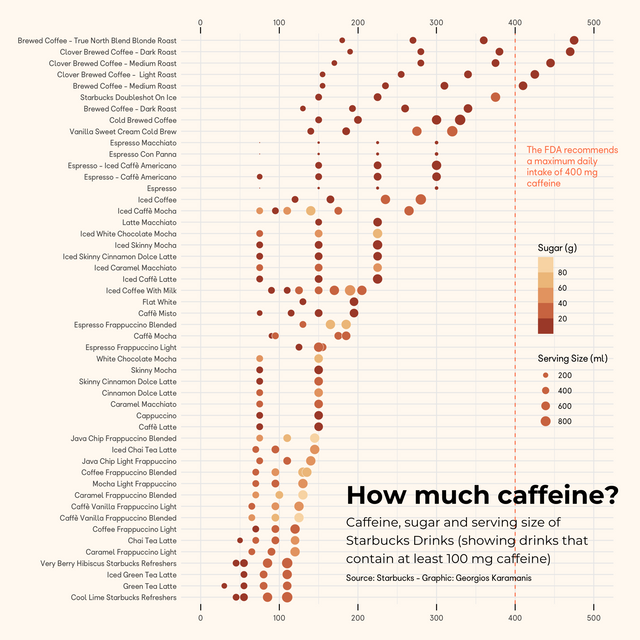 Caffeine, sugar and serving size of Starbucks drinks for this week’s #TidyTuesday. code on GitHub
TidyTuesday 2021/50
December 15, 2021
Spice Girls & Spotify & TidyTuesday & Data Visualization
Caffeine, sugar and serving size of Starbucks drinks for this week’s #TidyTuesday. code on GitHub
TidyTuesday 2021/50
December 15, 2021
Spice Girls & Spotify & TidyTuesday & Data Visualization
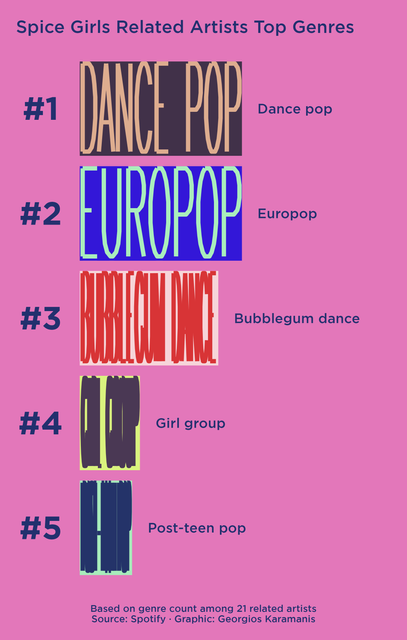 Spice Girls related artists top genres for this week’s #TidyTuesday, in the style of Spotify Wrapped 2021. The text inside the bars was made with
TidyTuesday 2021/49
December 10, 2021
R & spiders & TidyTuesday & Data Visualization
Spice Girls related artists top genres for this week’s #TidyTuesday, in the style of Spotify Wrapped 2021. The text inside the bars was made with
TidyTuesday 2021/49
December 10, 2021
R & spiders & TidyTuesday & Data Visualization
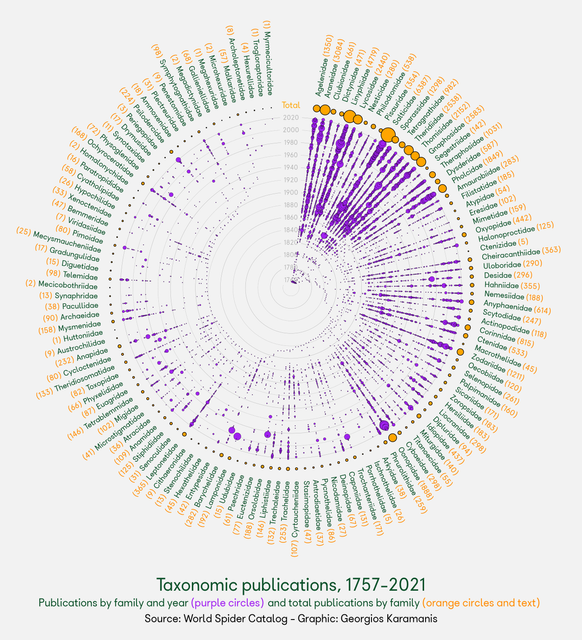 Spider taxonomy publications for this week’s #TidyTuesday with data from the World Spider Catalog. Not very easy to read but looks nice code and big
TidyTuesday 2021/48
December 1, 2021
R & cricket & Notabilia & Data Visualization
Spider taxonomy publications for this week’s #TidyTuesday with data from the World Spider Catalog. Not very easy to read but looks nice code and big
TidyTuesday 2021/48
December 1, 2021
R & cricket & Notabilia & Data Visualization
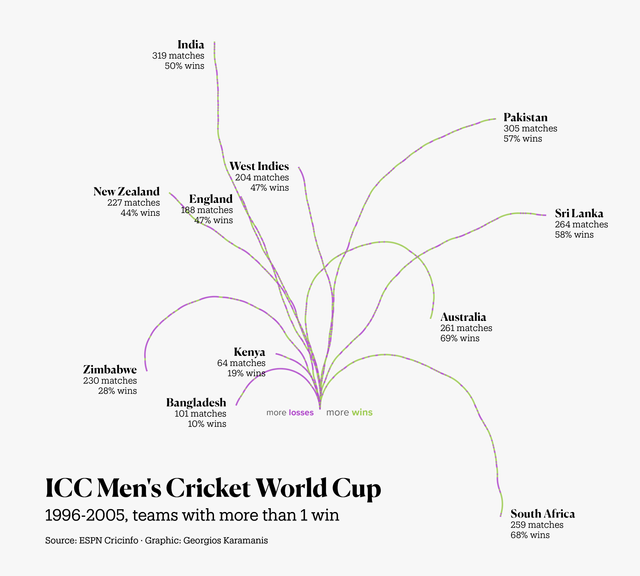 Cricket World Cup team wins for this week’s #TidyTuesday. I got a little lazy this week and reused the code I wrote some time ago to recreate Moritz
TidyTuesday 2021/47
November 28, 2021
Doctor Who & scarf & IMDB & R & Data Visualization
Cricket World Cup team wins for this week’s #TidyTuesday. I got a little lazy this week and reused the code I wrote some time ago to recreate Moritz
TidyTuesday 2021/47
November 28, 2021
Doctor Who & scarf & IMDB & R & Data Visualization
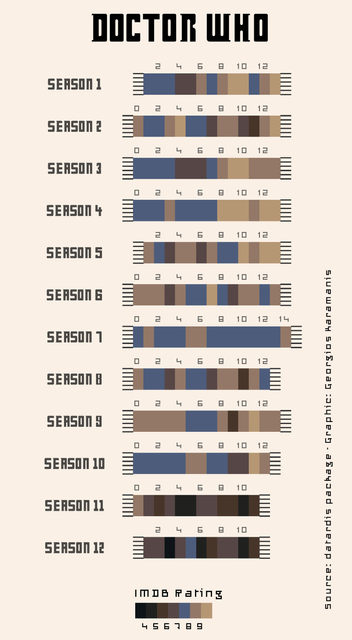 Doctor Who IMDB ratings for this week’s #TidyTuesday, in the style of the 4th Doctor’s scarf code on GitHub
30DayMapChallenge 2021
November 27, 2021
R & 30DayMapChallenge & Greece & map & Map & Data Visualization
Doctor Who IMDB ratings for this week’s #TidyTuesday, in the style of the 4th Doctor’s scarf code on GitHub
30DayMapChallenge 2021
November 27, 2021
R & 30DayMapChallenge & Greece & map & Map & Data Visualization
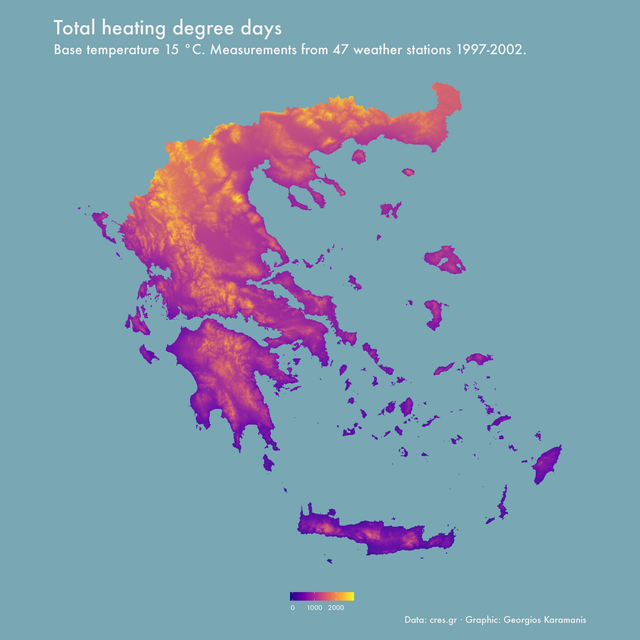 This post is going to be continuously updated with submissions to the 2021 #30DayMapChallenge. The code for all plots is on GitHub. For day 1, I
TidyTuesday 2021/45
November 10, 2021
R & Africa & map & 30DayMapChallenge & population & Data Visualization & Map
This post is going to be continuously updated with submissions to the 2021 #30DayMapChallenge. The code for all plots is on GitHub. For day 1, I
TidyTuesday 2021/45
November 10, 2021
R & Africa & map & 30DayMapChallenge & population & Data Visualization & Map
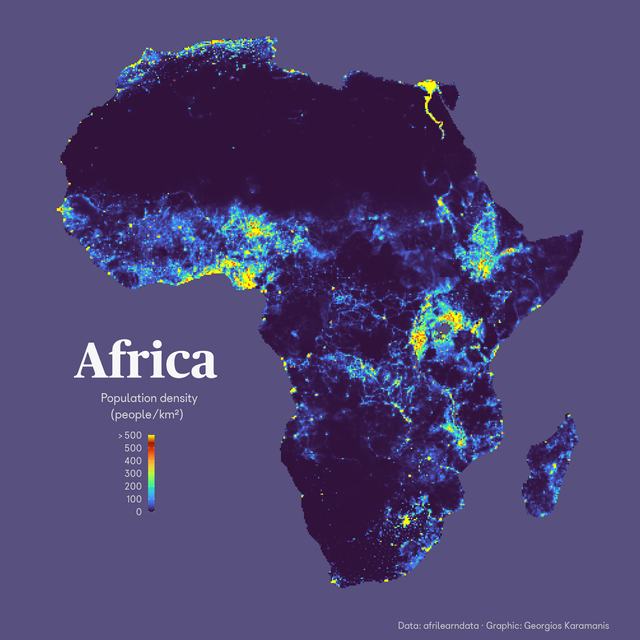 Cross post for this week’s #TidyTuesday and day 10 of #30daymapchallenge, raster. Population density in Africa with raster data from @afrimapr Code
TidyTuesday 2021/44
November 6, 2021
R & plot & Earth & Globe & life expectancy & Data Visualization
Cross post for this week’s #TidyTuesday and day 10 of #30daymapchallenge, raster. Population density in Africa with raster data from @afrimapr Code
TidyTuesday 2021/44
November 6, 2021
R & plot & Earth & Globe & life expectancy & Data Visualization
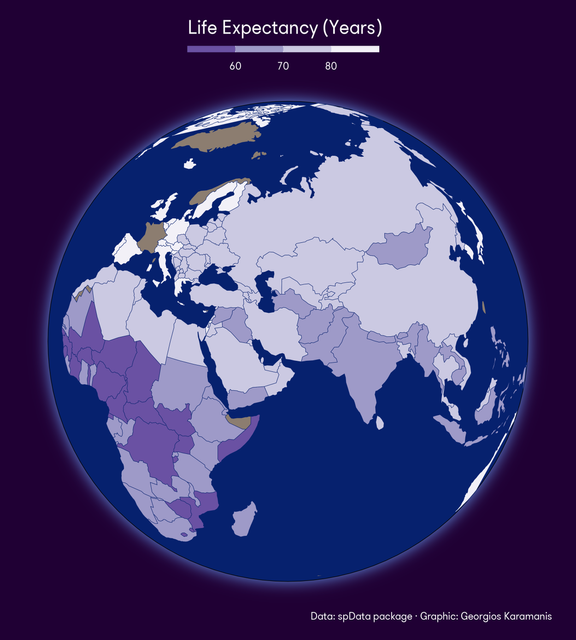 A map for this week’s #TidyTuesday, showing life expectancy on a globe with data from the spData package code on GitHub
TidyTuesday 2021/43
October 30, 2021
trail running & R & plot & TidyTuesday & Data Visualization
Trail running for this week’s #TidyTuesday. A lollipop chart showing the difference of median pace between men and women for 85 nationalities. code
TidyTuesday 2021/42
October 23, 2021
R & pumpkins & Venn & Data Visualization
A map for this week’s #TidyTuesday, showing life expectancy on a globe with data from the spData package code on GitHub
TidyTuesday 2021/43
October 30, 2021
trail running & R & plot & TidyTuesday & Data Visualization
Trail running for this week’s #TidyTuesday. A lollipop chart showing the difference of median pace between men and women for 85 nationalities. code
TidyTuesday 2021/42
October 23, 2021
R & pumpkins & Venn & Data Visualization
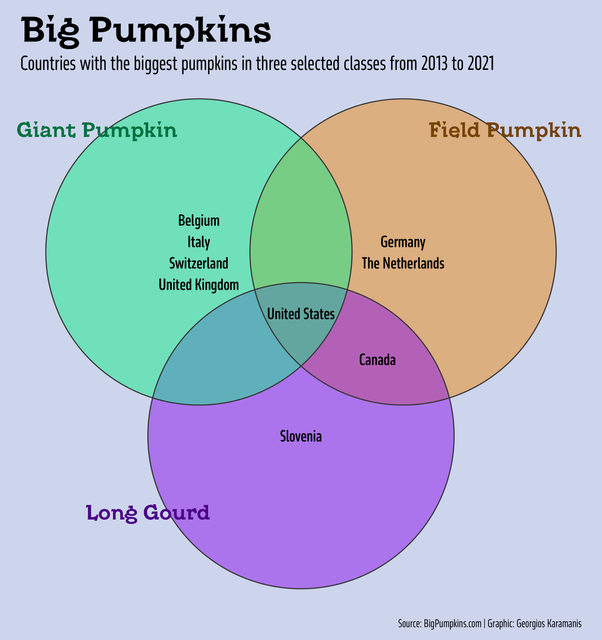 Giant pumpkins for this week’s #TidyTuesday. I decided to make a Venn diagram after seeing a tweet by Andy Kirk, tried 2-3 packages but in the end I
TidyTuesday 2021/41
October 12, 2021
R & Greece & seafood & Data Visualization
Seafood production in Greece for this week’s TidyTuesday. The inspiration for the plot was a data visualization from 1906 from this tweet. code and
TidyTuesday 2021/40
October 6, 2021
R & nurses & Data Visualization
Giant pumpkins for this week’s #TidyTuesday. I decided to make a Venn diagram after seeing a tweet by Andy Kirk, tried 2-3 packages but in the end I
TidyTuesday 2021/41
October 12, 2021
R & Greece & seafood & Data Visualization
Seafood production in Greece for this week’s TidyTuesday. The inspiration for the plot was a data visualization from 1906 from this tweet. code and
TidyTuesday 2021/40
October 6, 2021
R & nurses & Data Visualization
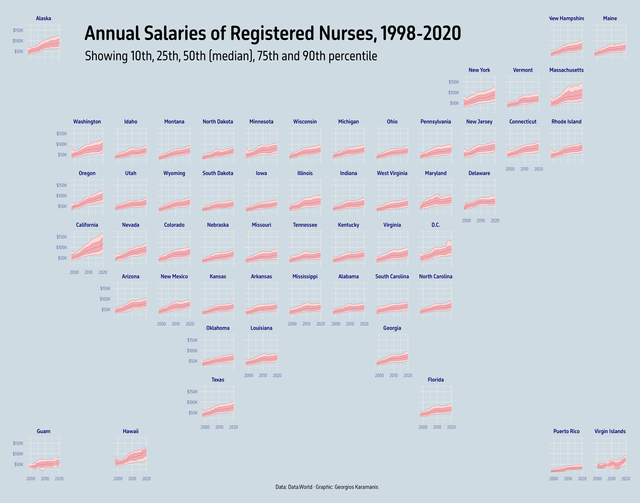 For this week’s #TidyTuesday I used {ggfan} to show the median salaries (and other percentiles) of US registered nurses from 1998 to 2020. [ ](The
TidyTuesday 2021/39
October 4, 2021
R & papers & NBER & Data Visualization
For last week’s #TidyTuesday I combined two plots (actually three with the legend) showing the number and proportion of papers distributed by NBER
TidyTuesday 2021/38
September 26, 2021
plot & Emmys & TV & Data Visualization
For this week’s #TidyTuesday I used {ggfan} to show the median salaries (and other percentiles) of US registered nurses from 1998 to 2020. [ ](The
TidyTuesday 2021/39
October 4, 2021
R & papers & NBER & Data Visualization
For last week’s #TidyTuesday I combined two plots (actually three with the legend) showing the number and proportion of papers distributed by NBER
TidyTuesday 2021/38
September 26, 2021
plot & Emmys & TV & Data Visualization
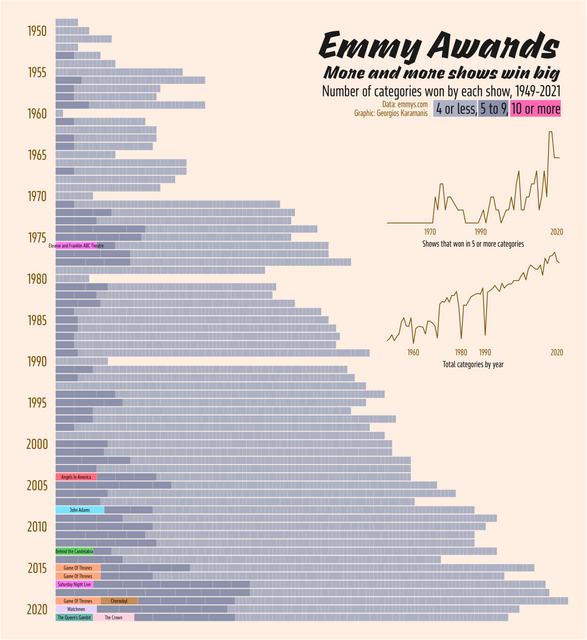 Big Emmy award winners for this week’s #TidyTuesday. The dataset seemed to have missing categories for many years so I merged it with a Kaggle
TidyTuesday 2021/37
September 17, 2021
Spotify & music & Billboard & R & code & Data Visualization
Big Emmy award winners for this week’s #TidyTuesday. The dataset seemed to have missing categories for many years so I merged it with a Kaggle
TidyTuesday 2021/37
September 17, 2021
Spotify & music & Billboard & R & code & Data Visualization
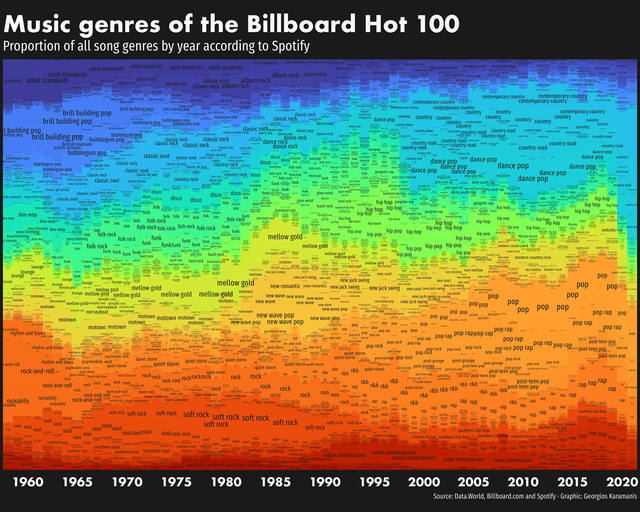 Spotify music genres of the Billboard Hot 100 for this week’s #TidyTuesday. Code and big image on GitHub
TidyTuesday 2021/36
September 10, 2021
Formula 1 & R & plot & Data Visualization
Spotify music genres of the Billboard Hot 100 for this week’s #TidyTuesday. Code and big image on GitHub
TidyTuesday 2021/36
September 10, 2021
Formula 1 & R & plot & Data Visualization
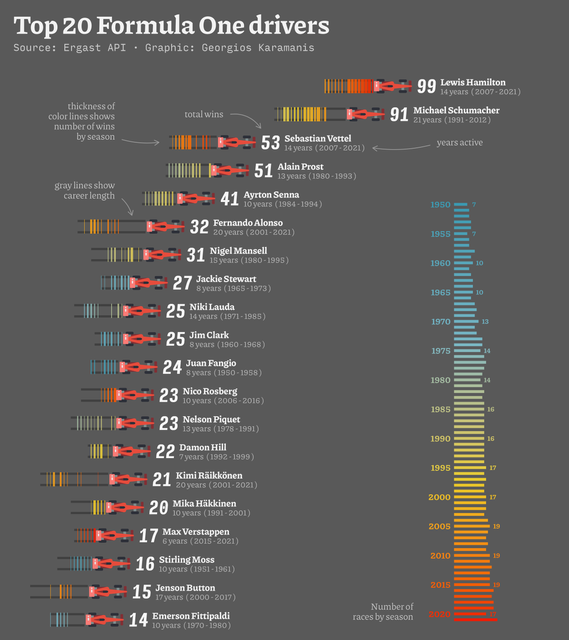 Top 20 Formula 1 drivers by total wins for this week’s #TidyTuesday code on GitHub
TidyTuesday 2021/35
September 3, 2021
birds & Australia & plot & R & Data Visualization
Top 20 Formula 1 drivers by total wins for this week’s #TidyTuesday code on GitHub
TidyTuesday 2021/35
September 3, 2021
birds & Australia & plot & R & Data Visualization
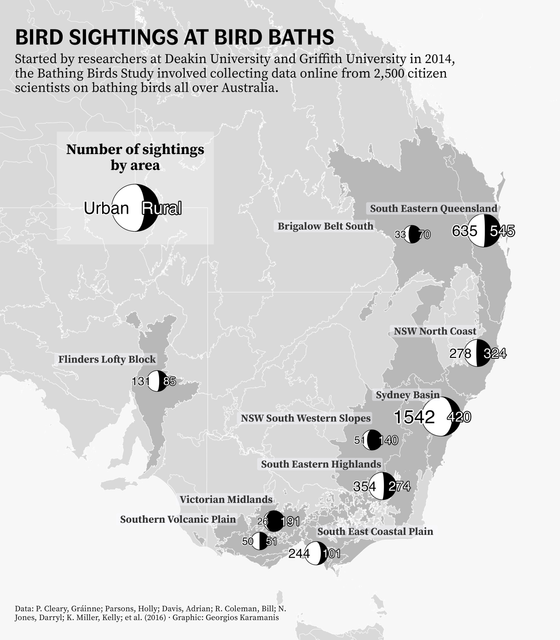 Bird sightings at Australian bird baths for this week’s #TidyTuesday. I really liked the grayscale look while I was working with the map and decided
TidyTuesday 2021/34
August 29, 2021
R & lemurs & plot & Data Visualization
Bird sightings at Australian bird baths for this week’s #TidyTuesday. I really liked the grayscale look while I was working with the map and decided
TidyTuesday 2021/34
August 29, 2021
R & lemurs & plot & Data Visualization
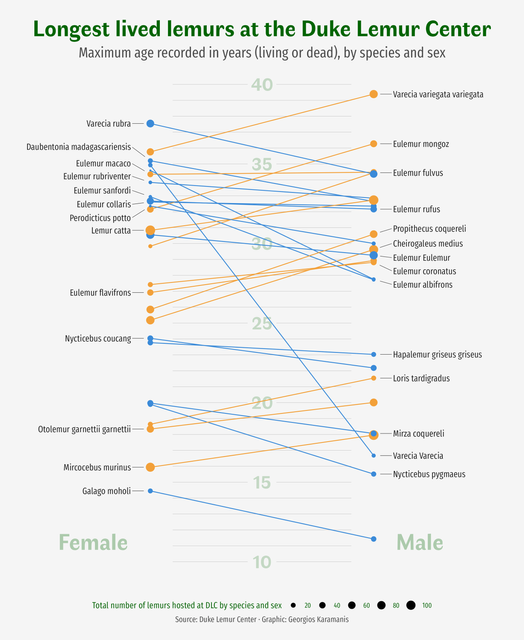 For this week’s #TidyTuesday I plotted the maximum age of all the lemurs hosted at the Duke Lemur Center by species and sex. code on GitHub
TidyTuesday 2021/33
August 22, 2021
Star Trek & R & letters & Data Visualization
For this week’s #TidyTuesday I plotted the maximum age of all the lemurs hosted at the Duke Lemur Center by species and sex. code on GitHub
TidyTuesday 2021/33
August 22, 2021
Star Trek & R & letters & Data Visualization
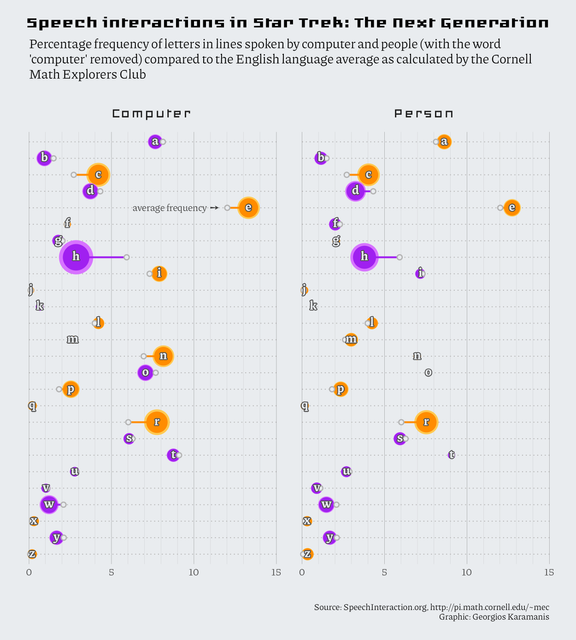 Speech interactions in Star Trek TNG for this week’s #TidyTuesday. I plotted the letter frequencies for lines spoken by computer and people compared
TidyTuesday 2021/32
August 15, 2021
R & plot & infrastructure & Data Visualization
Speech interactions in Star Trek TNG for this week’s #TidyTuesday. I plotted the letter frequencies for lines spoken by computer and people compared
TidyTuesday 2021/32
August 15, 2021
R & plot & infrastructure & Data Visualization
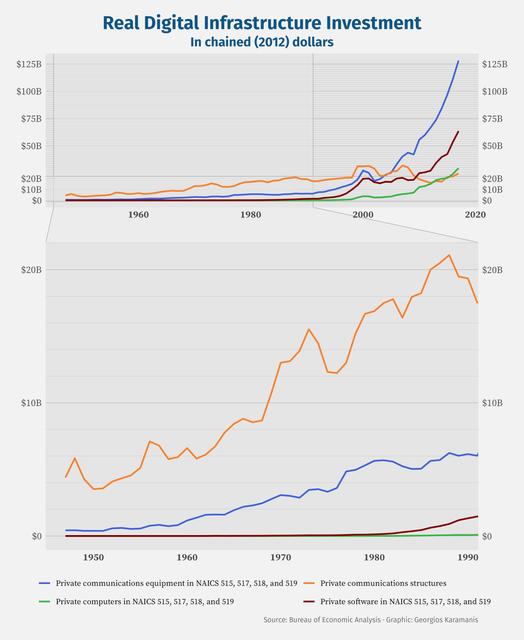 A relatively quick plot for this #TidyTuesday. I started by recreating chart 14 in the BEA Working Paper but then I thought to try facet_zoom of
TidyTuesday 2021/31
August 11, 2021
R & Paralympics & medals & Greece & Data Visualization
A relatively quick plot for this #TidyTuesday. I started by recreating chart 14 in the BEA Working Paper but then I thought to try facet_zoom of
TidyTuesday 2021/31
August 11, 2021
R & Paralympics & medals & Greece & Data Visualization
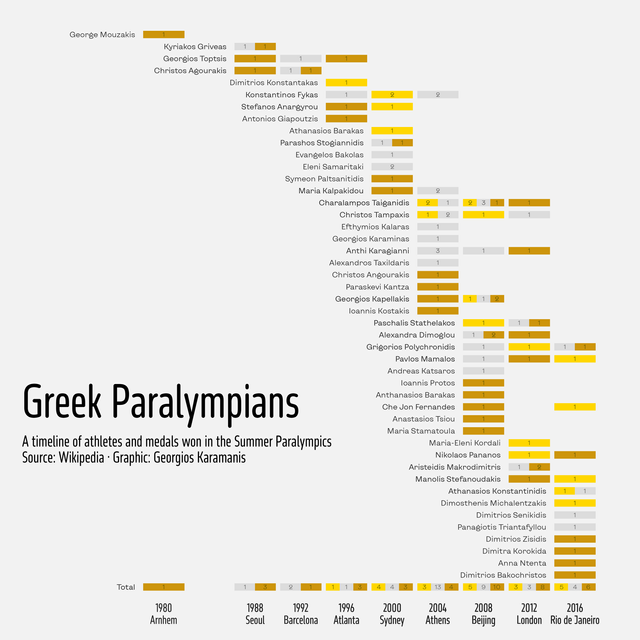 A timeline of the Greek athletes that have won a medal in the Summer Paralympics for last week’s #TidyTuesday. code on GitHub
TidyTuesday 2021/30
August 1, 2021
Olympic games & weight & BMI & R & Data Visualization
A timeline of the Greek athletes that have won a medal in the Summer Paralympics for last week’s #TidyTuesday. code on GitHub
TidyTuesday 2021/30
August 1, 2021
Olympic games & weight & BMI & R & Data Visualization
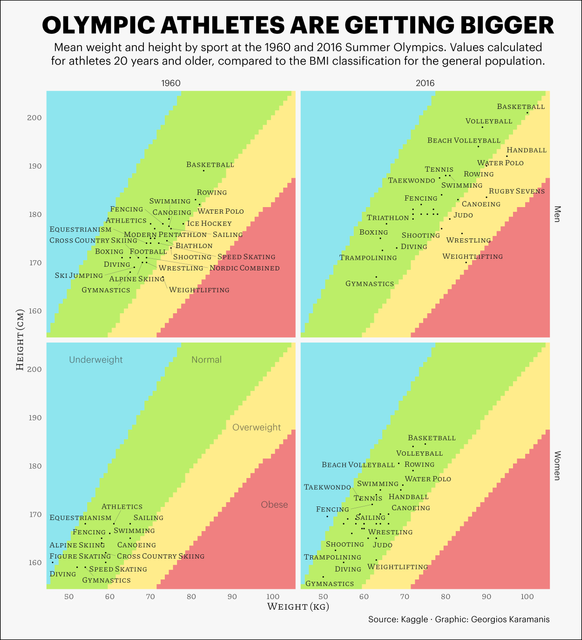 Evolution of olympic athletes’ weight and height from 1960 to 2016 for this week’s #TidyTuesday. Inspiration and reading about the limitations of
TidyTuesday 2021/29
July 26, 2021
R & drought & US & Data Visualization
Evolution of olympic athletes’ weight and height from 1960 to 2016 for this week’s #TidyTuesday. Inspiration and reading about the limitations of
TidyTuesday 2021/29
July 26, 2021
R & drought & US & Data Visualization
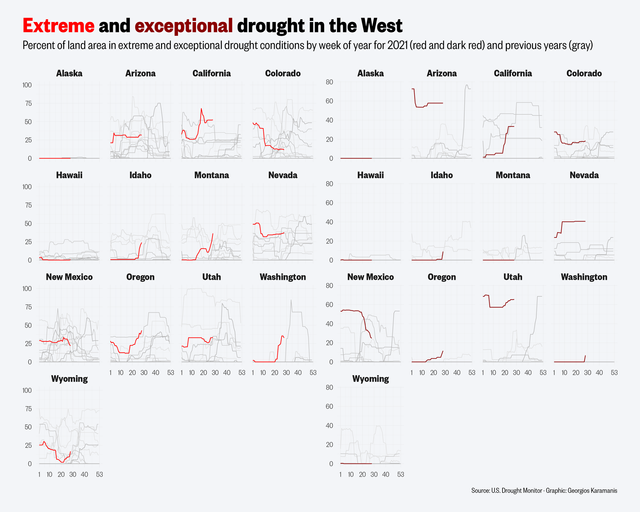 Extreme and exceptional drought in the West US for this week’s #TidyTuesday, comparing 2021 to previous years. Data from @DroughtCenter code:
TidyTuesday 2021/28
July 22, 2021
R & Scooby-Doo & Data Visualization
Extreme and exceptional drought in the West US for this week’s #TidyTuesday, comparing 2021 to previous years. Data from @DroughtCenter code:
TidyTuesday 2021/28
July 22, 2021
R & Scooby-Doo & Data Visualization
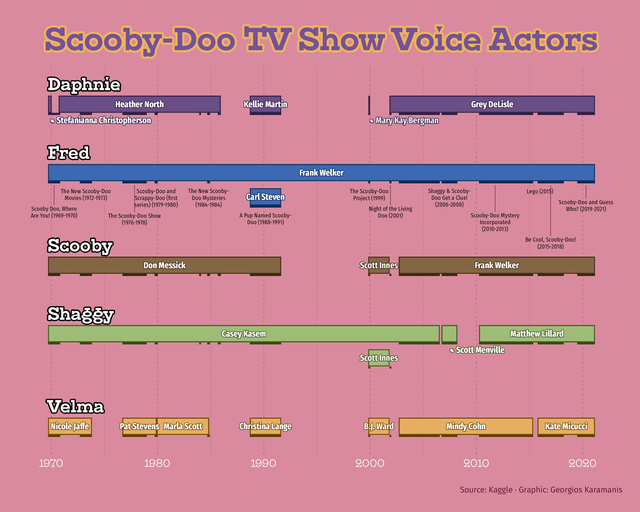 Timeline of the voice actors for the main characters of the Scooby-doo TV show (series and extras) for last week’s #TidyTuesday. code:
TidyTuesday 2021/27
July 11, 2021
TidyTuesday & R & Data Visualization
Timeline of the voice actors for the main characters of the Scooby-doo TV show (series and extras) for last week’s #TidyTuesday. code:
TidyTuesday 2021/27
July 11, 2021
TidyTuesday & R & Data Visualization
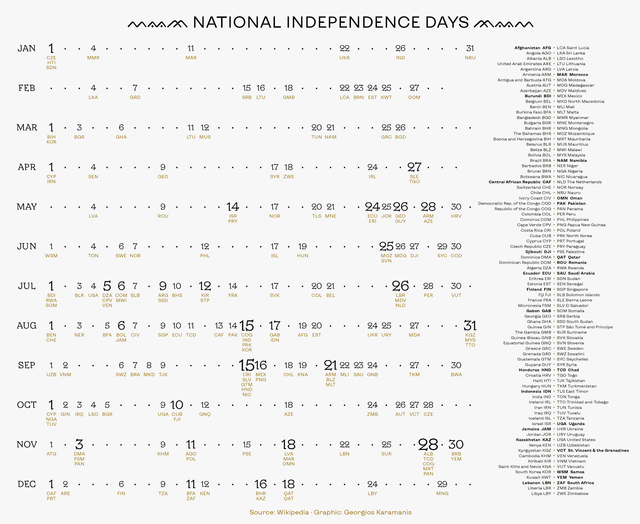 A text-heavy plot for this week’s #TidyTuesday, showing the distribution of national independence days by month and day of month R code:
TidyTuesday 2021/26
July 3, 2021
R & cats & fire brigade & Data Visualization
A text-heavy plot for this week’s #TidyTuesday, showing the distribution of national independence days by month and day of month R code:
TidyTuesday 2021/26
July 3, 2021
R & cats & fire brigade & Data Visualization
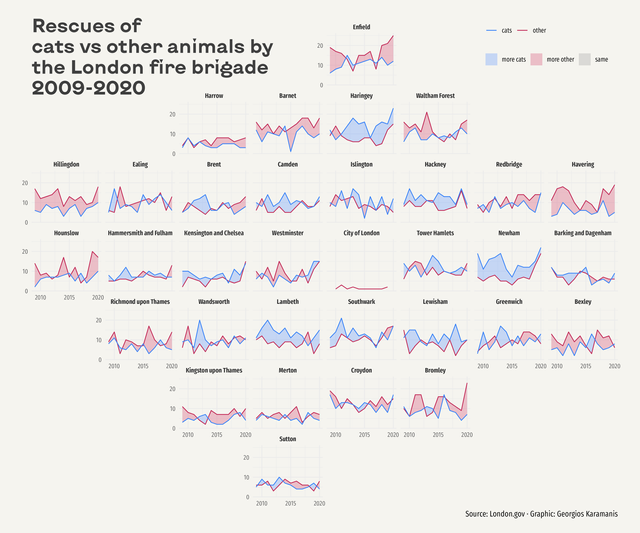 Rescues of cats vs other animals by the London fire brigade for this week’s #TidyTuesday. Used stat_difference() of the ggh4x package for the first
TidyTuesday 2021/25
June 27, 2021
R & parks & dataviz & Data Visualization
Rescues of cats vs other animals by the London fire brigade for this week’s #TidyTuesday. Used stat_difference() of the ggh4x package for the first
TidyTuesday 2021/25
June 27, 2021
R & parks & dataviz & Data Visualization
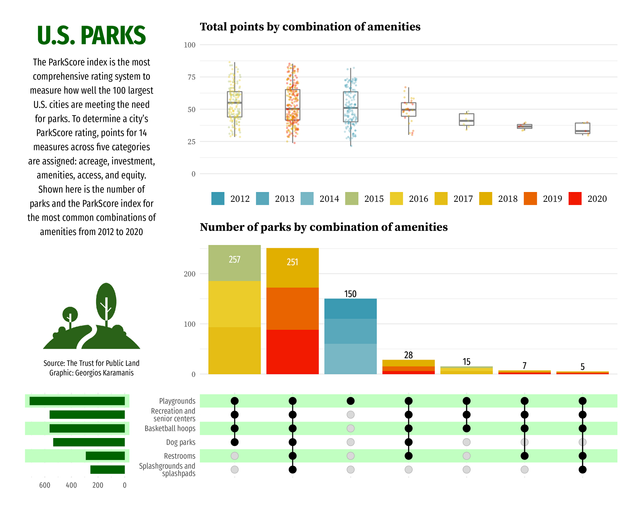 For this week’s #TidyTuesday I used the ComplexUpset package to plot the most common combinations of park amenities from 2018 to 2020, according to
All the blend modes of blend_with()
June 21, 2021
R & dataviz & Data Visualization
For this week’s #TidyTuesday I used the ComplexUpset package to plot the most common combinations of park amenities from 2018 to 2020, according to
All the blend modes of blend_with()
June 21, 2021
R & dataviz & Data Visualization
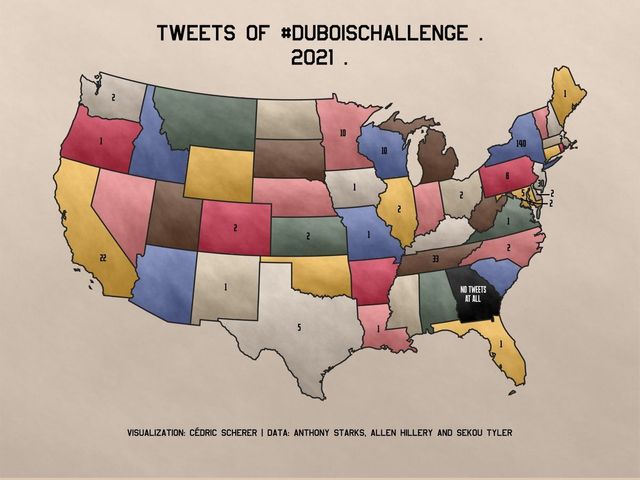 Cédric and I had a little chat when he was making his #DuBoisChallenge map (tweet) and wanted a hand-painted effect for the fill color. My
Commercial Fishing plot breakdown
June 17, 2021
dataviz & tutorial & R & Data Visualization
Cédric and I had a little chat when he was making his #DuBoisChallenge map (tweet) and wanted a hand-painted effect for the fill color. My
Commercial Fishing plot breakdown
June 17, 2021
dataviz & tutorial & R & Data Visualization
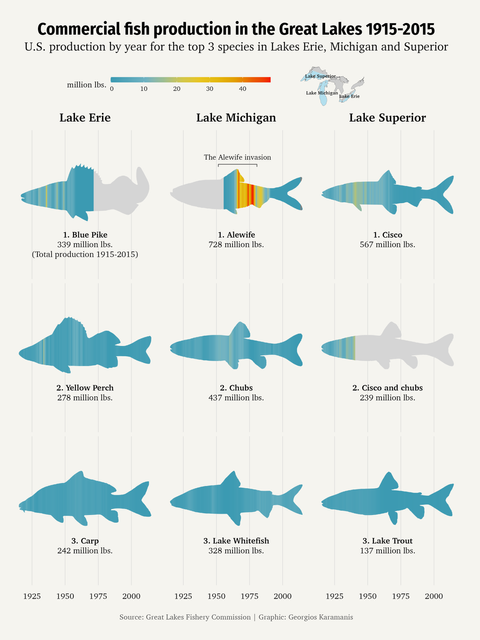 This post is not really a tutorial but more of a visual breakdown of the Commercial Fishing plot I did for last week’s TidyTuesday. The image below
TidyTuesday 2021/24
June 16, 2021
R & dataviz & DuBois & TidyTuesday & Data Visualization
This post is not really a tutorial but more of a visual breakdown of the Commercial Fishing plot I did for last week’s TidyTuesday. The image below
TidyTuesday 2021/24
June 16, 2021
R & dataviz & DuBois & TidyTuesday & Data Visualization
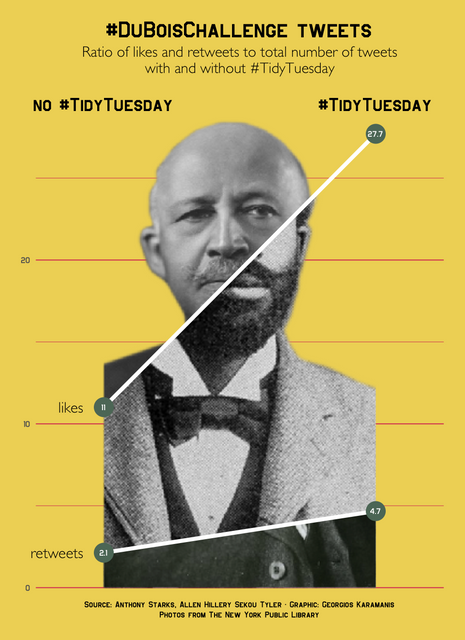 For this #TidyTuesday I was once again inspired by Gabrielle Merite’s (website, Twitter) work, as seen on the Data Viz Today Podcast. I looked at
TidyTuesday 2021/23
June 9, 2021
R & fishing & plot & Data Visualization
For this #TidyTuesday I was once again inspired by Gabrielle Merite’s (website, Twitter) work, as seen on the Data Viz Today Podcast. I looked at
TidyTuesday 2021/23
June 9, 2021
R & fishing & plot & Data Visualization
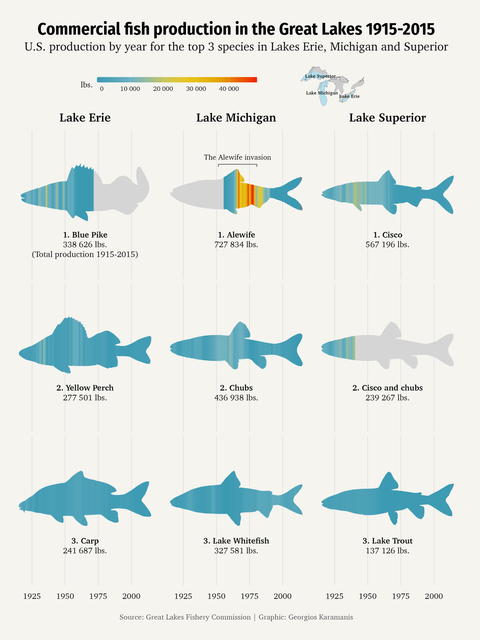 Commercial fish catch data for 3 of the Big Lakes with data by @LampreyControl for this week’s #TidyTuesday. Used, among others, {ggfx} with
tidytuesday 2020⁄32
August 8, 2020
R & plot & energy & Data Visualization
Commercial fish catch data for 3 of the Big Lakes with data by @LampreyControl for this week’s #TidyTuesday. Used, among others, {ggfx} with
tidytuesday 2020⁄32
August 8, 2020
R & plot & energy & Data Visualization
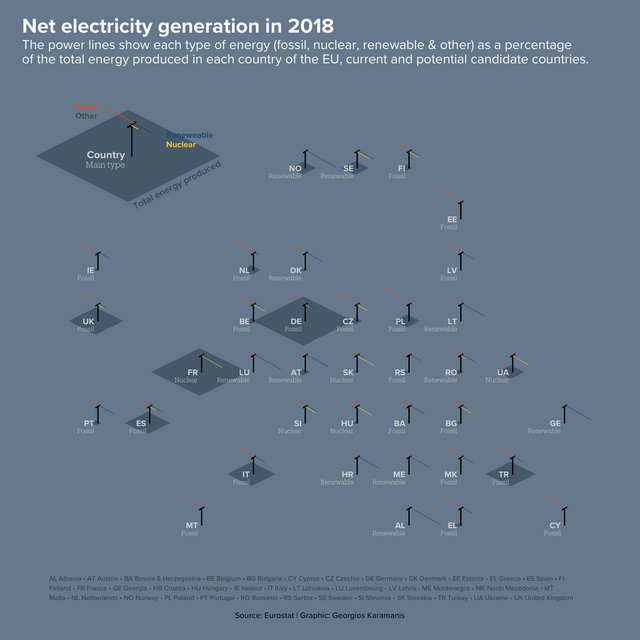 European energy for this week’s #TidyTuesday code: https://github.com/gkaramanis/tidytuesday/tree/master/2020-week32
tidytuesday 2020⁄31
July 29, 2020
R & penguins & plot & Data Visualization
European energy for this week’s #TidyTuesday code: https://github.com/gkaramanis/tidytuesday/tree/master/2020-week32
tidytuesday 2020⁄31
July 29, 2020
R & penguins & plot & Data Visualization
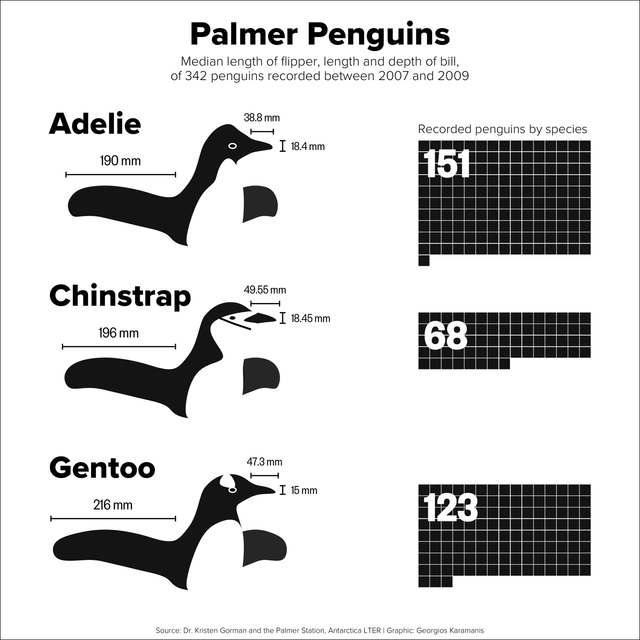 Palmer penguins for #TidyTuesday, happy to get the penguins almost right with geom_bspline_closed() from {ggforce} 😊 code:
tidytuesday
February 21, 2020
food & footprint & co2 & R & Data Visualization
Palmer penguins for #TidyTuesday, happy to get the penguins almost right with geom_bspline_closed() from {ggforce} 😊 code:
tidytuesday
February 21, 2020
food & footprint & co2 & R & Data Visualization
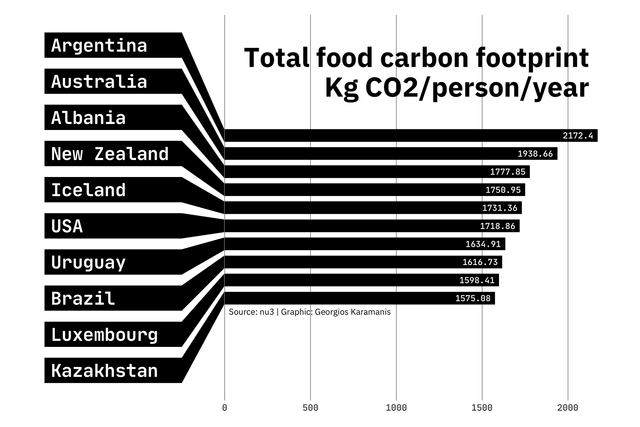 Food carbon footprint for this #TidyTuesday. I saw something and I wanted to replicate it with ggplot, I didn’t stop to think if I should. code:
tidytuesday
February 15, 2020
hotels & plot & R & Data Visualization
Food carbon footprint for this #TidyTuesday. I saw something and I wanted to replicate it with ggplot, I didn’t stop to think if I should. code:
tidytuesday
February 15, 2020
hotels & plot & R & Data Visualization
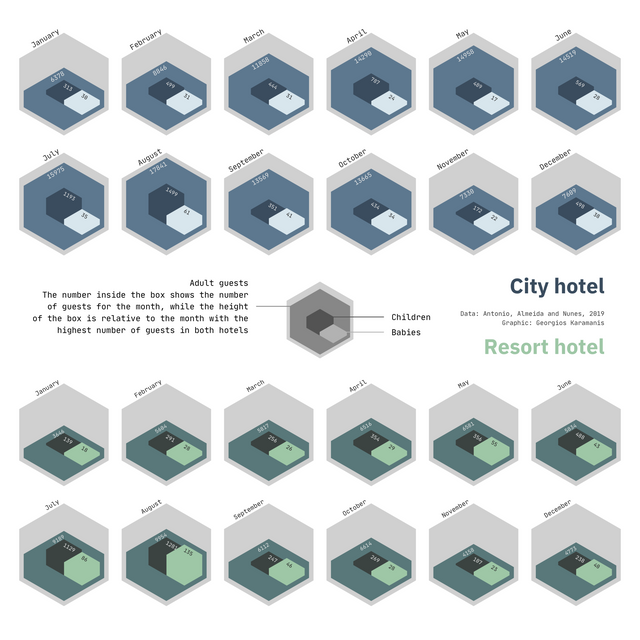 Hotels for this week’s #TidyTuesday. I had a lot of fun making the plot, many things I like and some that don’t work as well, so I’ll just leave
tidytuesday
February 2, 2020
trees & San Francisco & plot & R & Data Visualization
Hotels for this week’s #TidyTuesday. I had a lot of fun making the plot, many things I like and some that don’t work as well, so I’ll just leave
tidytuesday
February 2, 2020
trees & San Francisco & plot & R & Data Visualization
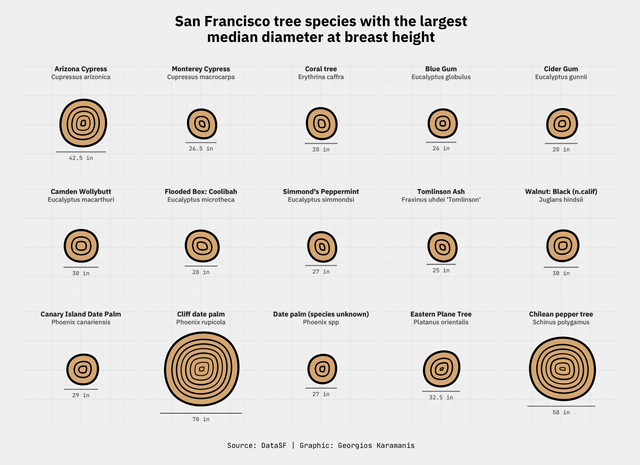 A quick plot for this week’s #TidyTuesday, looking at the streets with most trees, with the location of #rstudioconf for reference 😊 And another
tidytuesday
January 9, 2020
R & Australia & rainfall & plot & Data Visualization
A quick plot for this week’s #TidyTuesday, looking at the streets with most trees, with the location of #rstudioconf for reference 😊 And another
tidytuesday
January 9, 2020
R & Australia & rainfall & plot & Data Visualization
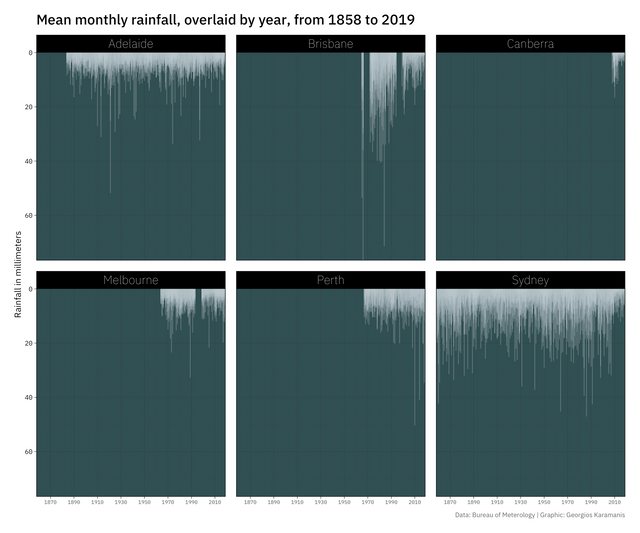 Plotting rainfall in Australia for this week’s #TidyTuesday. code: https://github.com/gkaramanis/tidytuesday/tree/master/2020-week02
tidytuesday
December 27, 2019
R & Christmas & plot & Data Visualization
Plotting rainfall in Australia for this week’s #TidyTuesday. code: https://github.com/gkaramanis/tidytuesday/tree/master/2020-week02
tidytuesday
December 27, 2019
R & Christmas & plot & Data Visualization
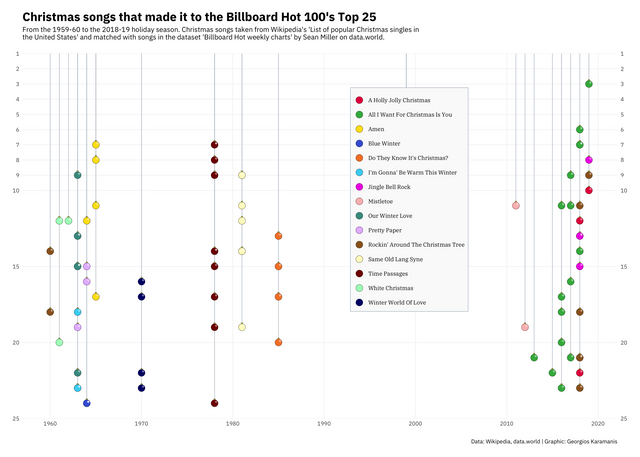 For this #TidyTuesday I made my own (and a little different) dataset from Wikipedia and the updated Billboard dataset by @HipsterVizNinja. The