TidyTuesday 2021/39
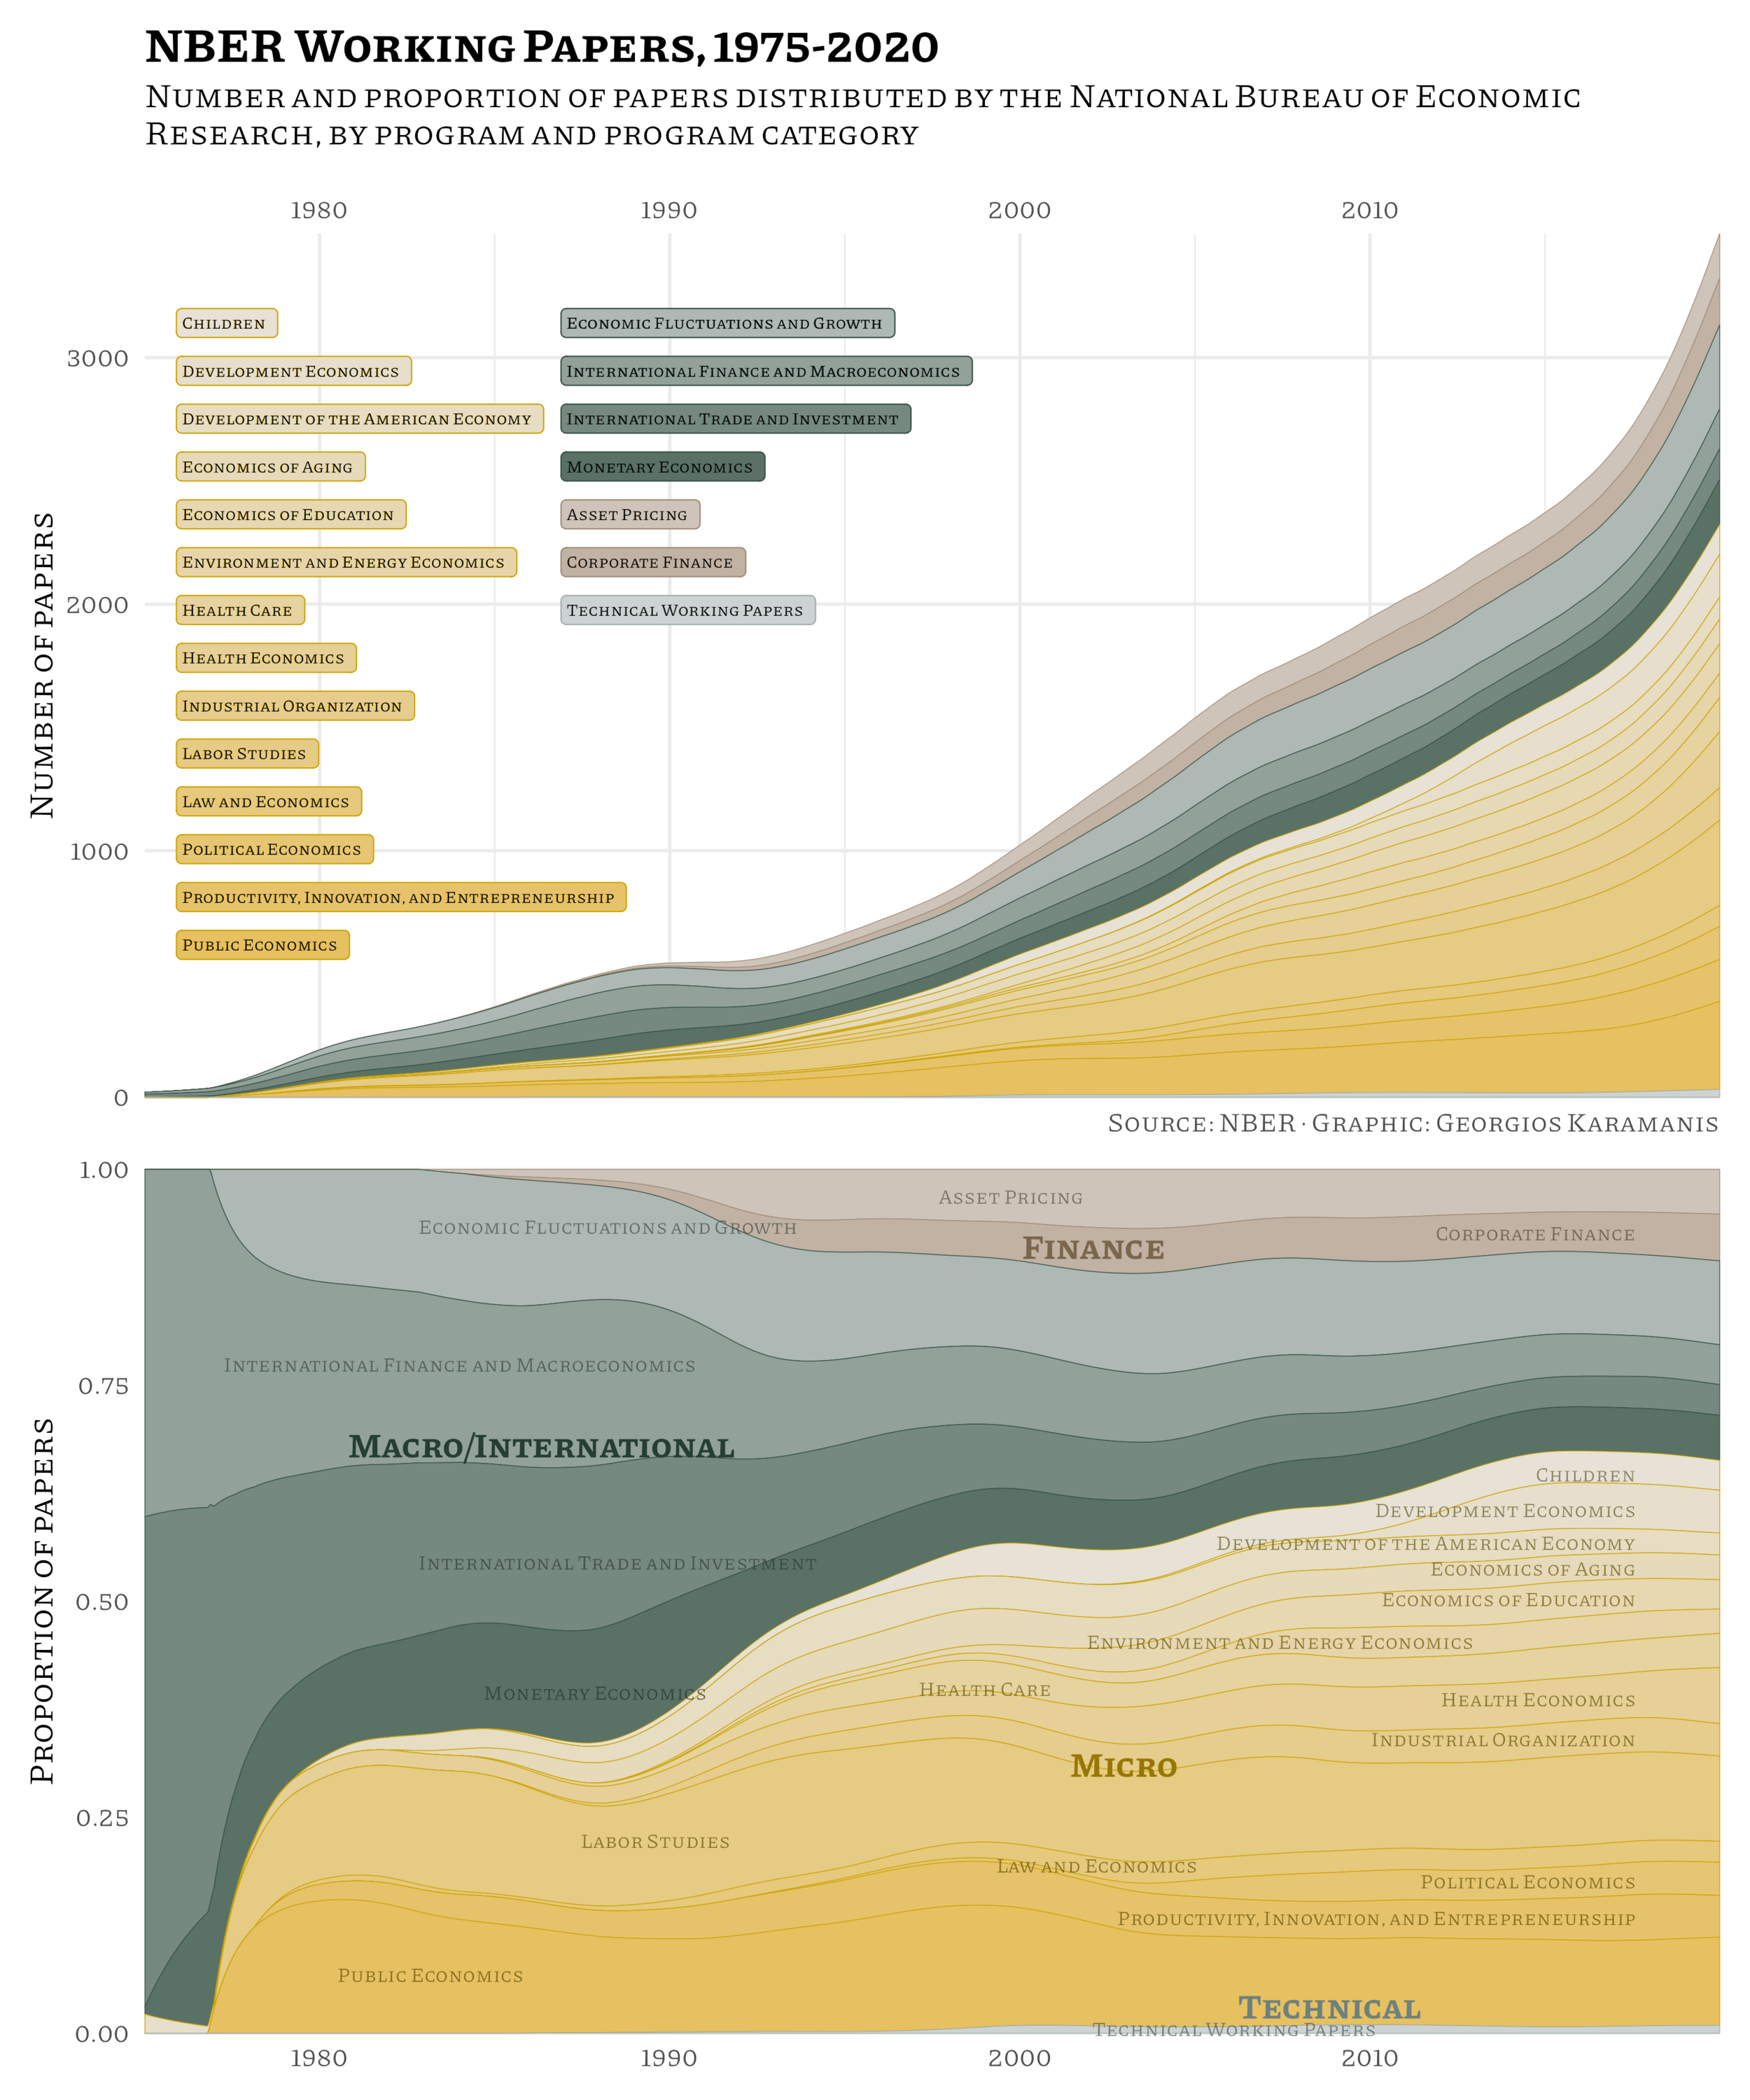
For last week’s #TidyTuesday I combined two plots (actually three with the legend) showing the number and proportion of papers distributed by NBER by program and program category.
code and full size image on GitHub
Latest posts
TidyTuesday 2025/37
TidyTuesday 2025/36
TidyTuesday 2025/35
TidyTuesday 2025/34
TidyTuesday 2025/33
TidyTuesday 2025/32
TidyTuesday 2025/31
TidyTuesday 2025/30
TidyTuesday 2025/29
TidyTuesday 2025/28
TidyTuesday 2025/27
TidyTuesday 2025/26
TidyTuesday 2025/25
TidyTuesday 2025/24
TidyTuesday 2025/23
TidyTuesday 2025/22
TidyTuesday 2025/21
TidyTuesday 2025/20
TidyTuesday 2025/19
TidyTuesday 2025/18
TidyTuesday 2025/17
30DayChartChallenge 2025
TidyTuesday 2025/16
TidyTuesday 2025/15
TidyTuesday 2025/14
TidyTuesday 2025/13
TidyTuesday 2025/12
TidyTuesday 2025/11
TidyTuesday 2025/10
TidyTuesday 2025/09
TidyTuesday 2025/08


