TidyTuesday 2025/37
September 12, 2025
TidyTuesday & R & world & passport & visa
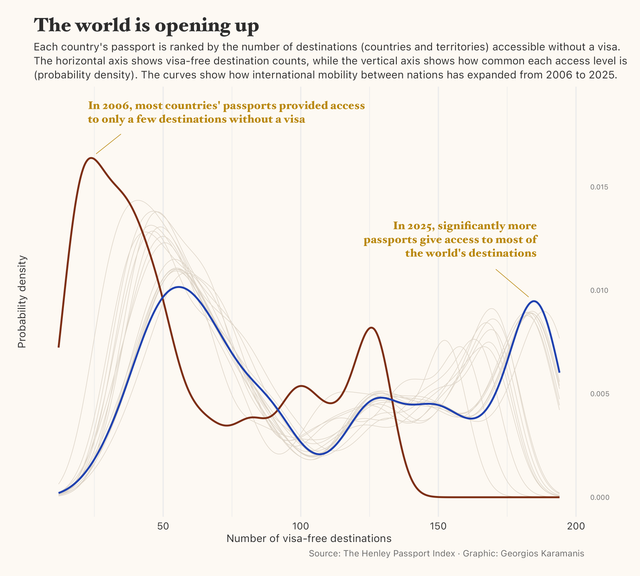 For this week’s #TidyTuesday, a visualization showing how more and more countries allow visa-free travel to most of the world’s destinations Code on
TidyTuesday 2025/36
September 7, 2025
TidyTuesday & R & Australia & frogs & map
For this week’s #TidyTuesday, a visualization showing how more and more countries allow visa-free travel to most of the world’s destinations Code on
TidyTuesday 2025/36
September 7, 2025
TidyTuesday & R & Australia & frogs & map
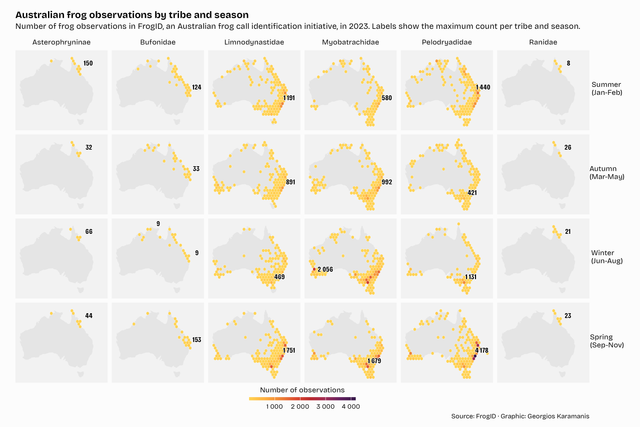 For this week’s #TidyTuesday, hex grid maps showing seasonal shifts in frog observations across Australia Code on GitHub
TidyTuesday 2025/35
August 31, 2025
Billboard & TidyTuesday & R & songs & music
For this week’s #TidyTuesday, hex grid maps showing seasonal shifts in frog observations across Australia Code on GitHub
TidyTuesday 2025/35
August 31, 2025
Billboard & TidyTuesday & R & songs & music
 For this week’s #TidyTuesday I looked at summer Billboard Hot 100 number one songs. Since the 90s fewer song debut at #1 in summer but those that do
TidyTuesday 2025/34
August 24, 2025
TidyTuesday & R & map & Munro & Scotland
For this week’s #TidyTuesday I looked at summer Billboard Hot 100 number one songs. Since the 90s fewer song debut at #1 in summer but those that do
TidyTuesday 2025/34
August 24, 2025
TidyTuesday & R & map & Munro & Scotland
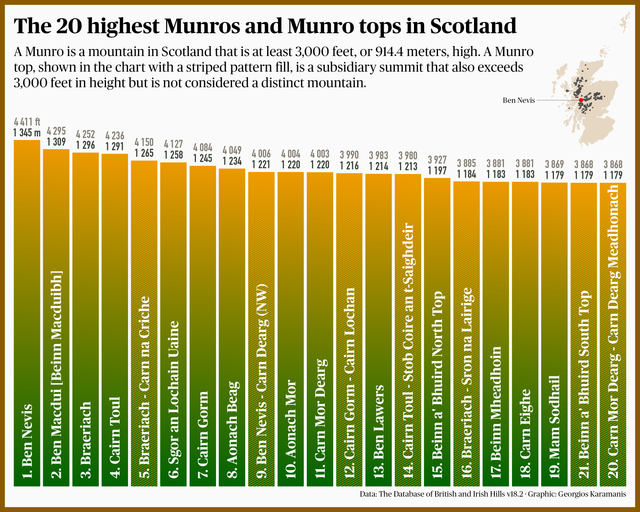 Explore Scotland’s tallest Munros and Munro tops with this week’s #TidyTuesday Code on GitHub
TidyTuesday 2025/33
August 17, 2025
TidyTuesday & Shiny & R & Data Visualization & map & world & climate
Explore Scotland’s tallest Munros and Munro tops with this week’s #TidyTuesday Code on GitHub
TidyTuesday 2025/33
August 17, 2025
TidyTuesday & Shiny & R & Data Visualization & map & world & climate
 Explore extreme weather attribution studies with a Shiny app for this week’s #TidyTuesday App at shinyapps.io Code on GitHub
TidyTuesday 2025/32
August 10, 2025
TidyTuesday & income inequality & Gini & data visualization & R
Explore extreme weather attribution studies with a Shiny app for this week’s #TidyTuesday App at shinyapps.io Code on GitHub
TidyTuesday 2025/32
August 10, 2025
TidyTuesday & income inequality & Gini & data visualization & R
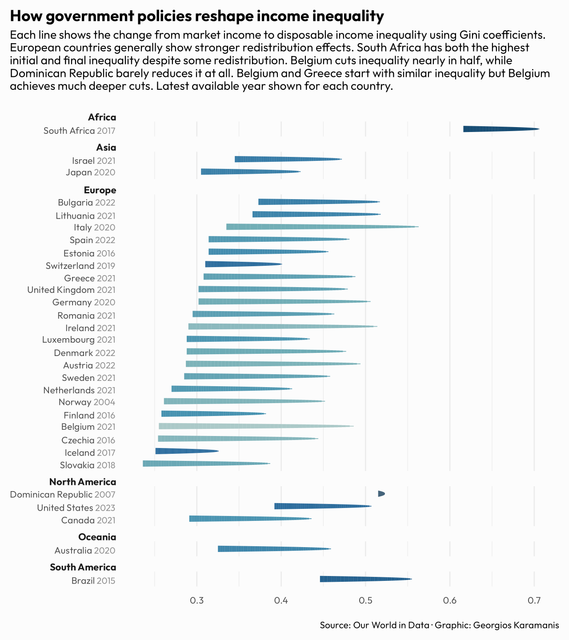 Income inequality for this week’s #TidyTuesday. How do countries redistribute income through taxes and transfers? Code on GitHub
TidyTuesday 2025/30
July 28, 2025
TidyTuesday & Shiny & R & New York & subway & art
Income inequality for this week’s #TidyTuesday. How do countries redistribute income through taxes and transfers? Code on GitHub
TidyTuesday 2025/30
July 28, 2025
TidyTuesday & Shiny & R & New York & subway & art
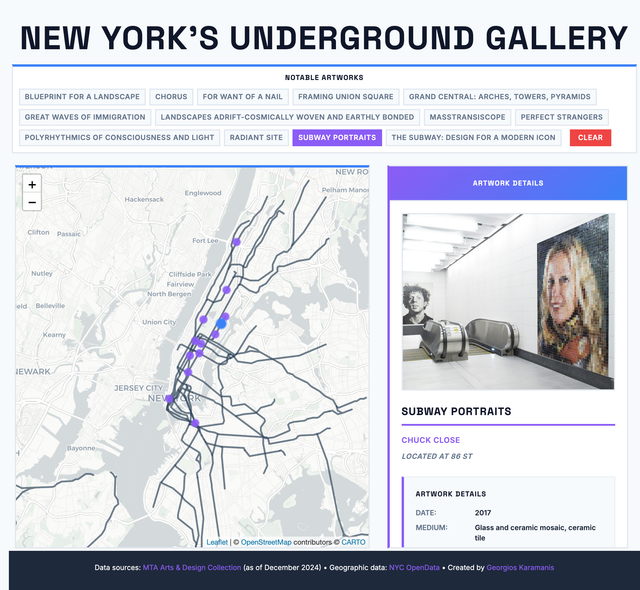 A Shiny app for last week’s #TidyTuesday. Explore and learn about selected NYC subway artworks App on shinyapps.io Code on GitHub
TidyTuesday 2025/29
July 18, 2025
British Library & TidyTuesday & R & data visualization
A Shiny app for last week’s #TidyTuesday. Explore and learn about selected NYC subway artworks App on shinyapps.io Code on GitHub
TidyTuesday 2025/29
July 18, 2025
British Library & TidyTuesday & R & data visualization
 British Library funding for this week’s #TidyTuesday Code on GitHub
TidyTuesday 2025/28
July 9, 2025
TidyTuesday & xkcd & color & survey & data visualization & R
British Library funding for this week’s #TidyTuesday Code on GitHub
TidyTuesday 2025/28
July 9, 2025
TidyTuesday & xkcd & color & survey & data visualization & R
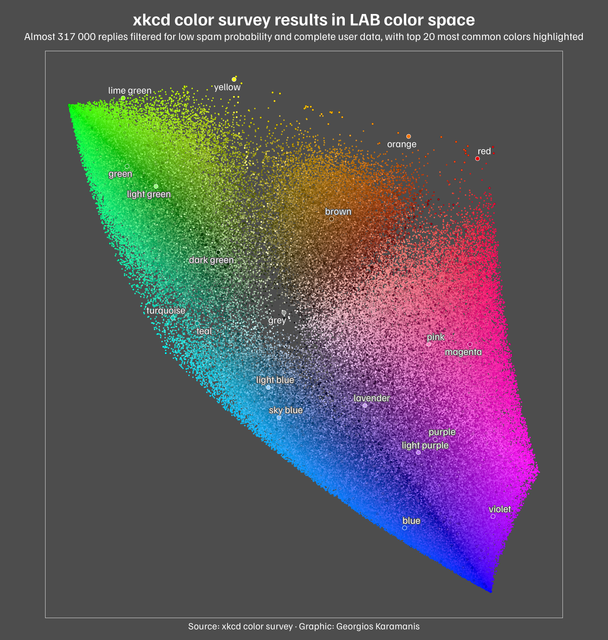 xkcd color survey results for this week’s #TidyTuesday Code on GitHub
TidyTuesday 2025/27
July 6, 2025
TidyTuesday & gas & US & data visualization & R
xkcd color survey results for this week’s #TidyTuesday Code on GitHub
TidyTuesday 2025/27
July 6, 2025
TidyTuesday & gas & US & data visualization & R
 Gas prices in the US for this week’s #TidyTuesday Code on GitHub
TidyTuesday 2025/26
June 25, 2025
TidyTuesday & data visualization & R & measles & WHO
Gas prices in the US for this week’s #TidyTuesday Code on GitHub
TidyTuesday 2025/26
June 25, 2025
TidyTuesday & data visualization & R & measles & WHO
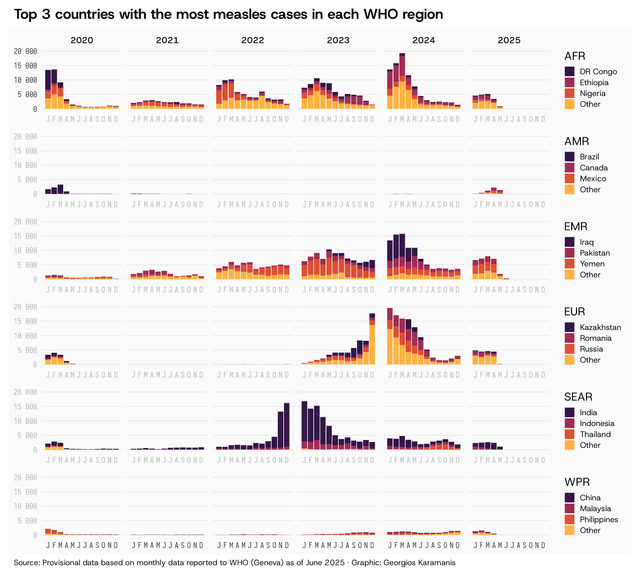 Measles cases by WHO region for this week’s #TidyTuesday Code on GitHub
TidyTuesday 2025/25
June 22, 2025
TidyTuesday & curves & data visualization & R & API
Measles cases by WHO region for this week’s #TidyTuesday Code on GitHub
TidyTuesday 2025/25
June 22, 2025
TidyTuesday & curves & data visualization & R & API
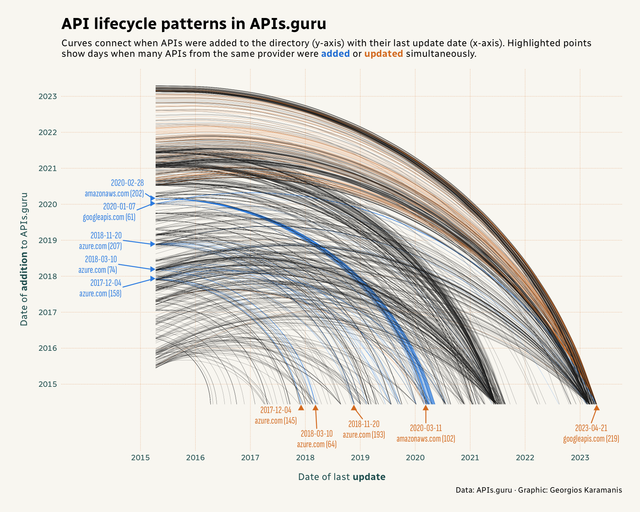 For this week’s #TidyTuesday I explored when APIs are added and updated in the APIs.guru directory Code on GitHub
TidyTuesday 2025/24
June 15, 2025
TidyTuesday & Dataviz & R & president & US & judges
For this week’s #TidyTuesday I explored when APIs are added and updated in the APIs.guru directory Code on GitHub
TidyTuesday 2025/24
June 15, 2025
TidyTuesday & Dataviz & R & president & US & judges
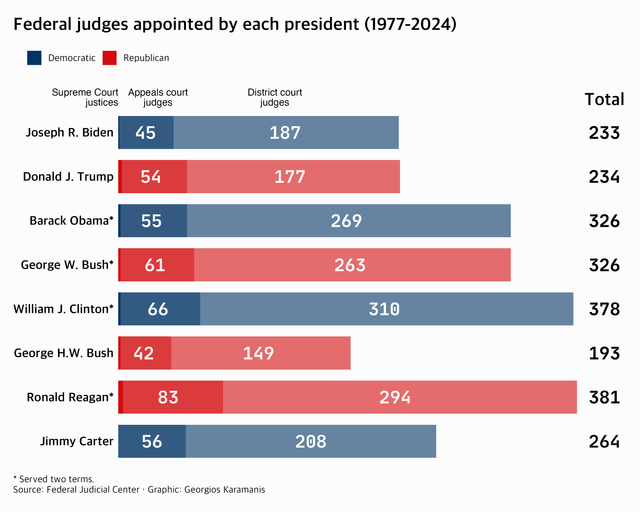 For this week’s #TidyTuesday I recreated two of the charts made by the Pew Research Center Code on GitHub
TidyTuesday 2025/22
June 1, 2025
Dungeons & Dragons & TidyTuesday & R & Data Visualization & Shiny & radar
For this week’s #TidyTuesday I recreated two of the charts made by the Pew Research Center Code on GitHub
TidyTuesday 2025/22
June 1, 2025
Dungeons & Dragons & TidyTuesday & R & Data Visualization & Shiny & radar
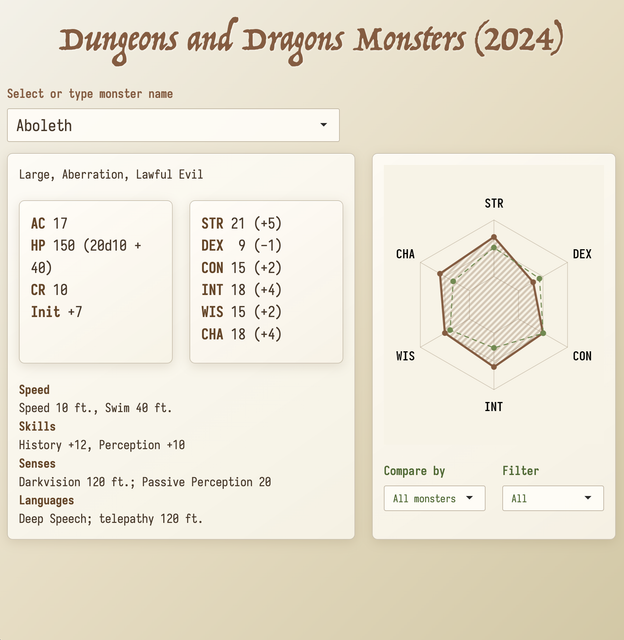 Dungeons & Dragons monsters for this week’s #TidyTuesday A Shiny app for exploring monster stats with interactive radar chart Code on GitHub
TidyTuesday 2025/18
May 4, 2025
TidyTuesday & useR & conference & R & data visualization & program & schedule
Dungeons & Dragons monsters for this week’s #TidyTuesday A Shiny app for exploring monster stats with interactive radar chart Code on GitHub
TidyTuesday 2025/18
May 4, 2025
TidyTuesday & useR & conference & R & data visualization & program & schedule
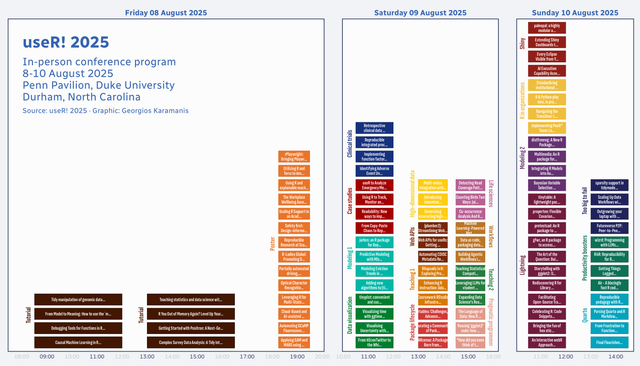 useR2025 in-person program for this week’s #TidyTuesday
TidyTuesday 2025/17
April 27, 2025
TidyTuesday & R & DataViz & car accidents & USA
useR2025 in-person program for this week’s #TidyTuesday
TidyTuesday 2025/17
April 27, 2025
TidyTuesday & R & DataViz & car accidents & USA
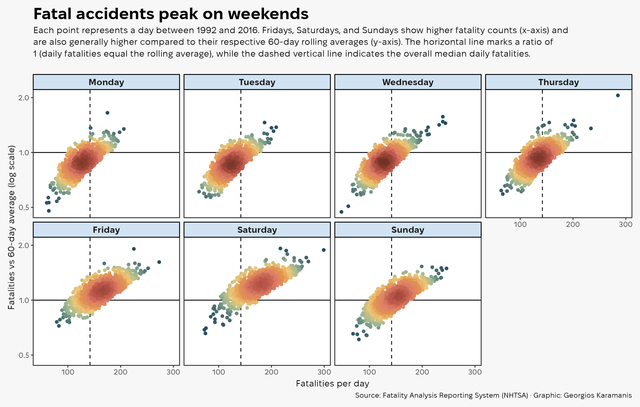 Daily road accidents for this week’s #TidyTuesday Code on GitHub
30DayChartChallenge 2025
April 22, 2025
30DayChartChallenge & Sweden & health & mortality & death & age & cancer & population & R & data visualization & complications & hospitalizations & births & healthcare & antibiotics & drugs
Daily road accidents for this week’s #TidyTuesday Code on GitHub
30DayChartChallenge 2025
April 22, 2025
30DayChartChallenge & Sweden & health & mortality & death & age & cancer & population & R & data visualization & complications & hospitalizations & births & healthcare & antibiotics & drugs
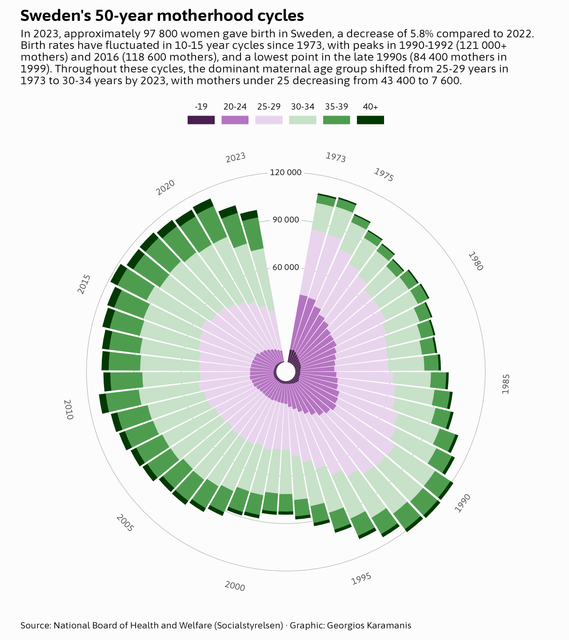 Share of deaths by age group in Sweden, 1950-2023 Lung cancer diagnoses and deaths in Sweden, 1973-2023 Sweden’s motherhood cycles BIG PRIVATE vs
TidyTuesday 2025/16
April 19, 2025
TidyTuesday & penguins & R & dataviz & remake
Share of deaths by age group in Sweden, 1950-2023 Lung cancer diagnoses and deaths in Sweden, 1973-2023 Sweden’s motherhood cycles BIG PRIVATE vs
TidyTuesday 2025/16
April 19, 2025
TidyTuesday & penguins & R & dataviz & remake
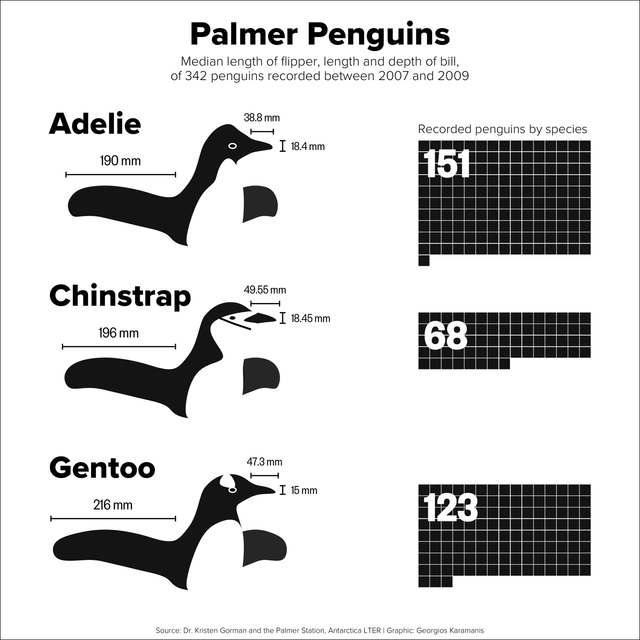
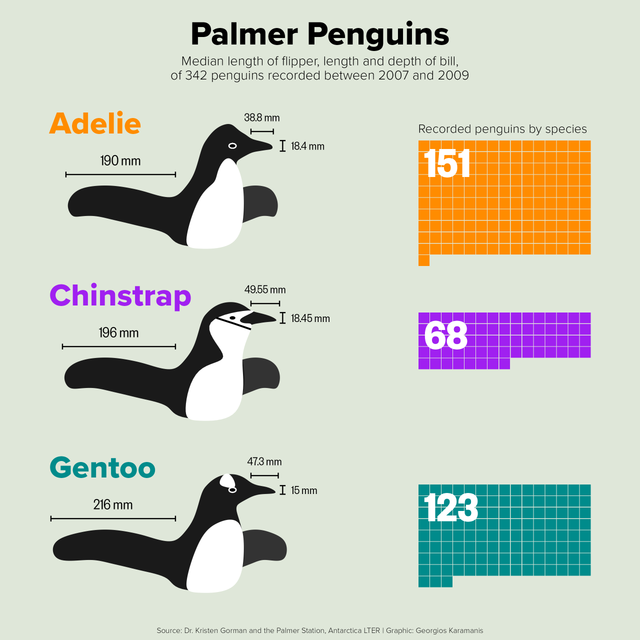 Palmer penguins for this week’s #TidyTuesday. A remake of the original plot, now with color Code on GitHub Original plot
TidyTuesday 2024/16
April 21, 2024
R & Shiny & CRAN & TidyTuesday & Data Visualization
Palmer penguins for this week’s #TidyTuesday. A remake of the original plot, now with color Code on GitHub Original plot
TidyTuesday 2024/16
April 21, 2024
R & Shiny & CRAN & TidyTuesday & Data Visualization
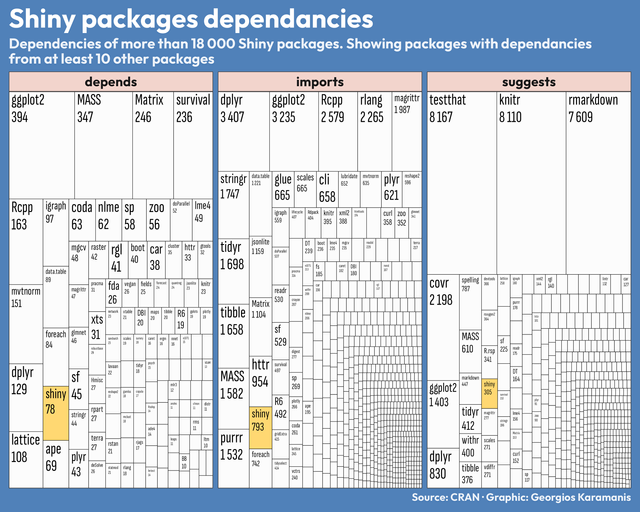 Shiny packages dependencies for this week’s #TidyTuesday Code on GitHub
TidyTuesday 2023/52
December 31, 2023
TidyTuesday & network & ggplot2 & R & Data Visualization
Shiny packages dependencies for this week’s #TidyTuesday Code on GitHub
TidyTuesday 2023/52
December 31, 2023
TidyTuesday & network & ggplot2 & R & Data Visualization
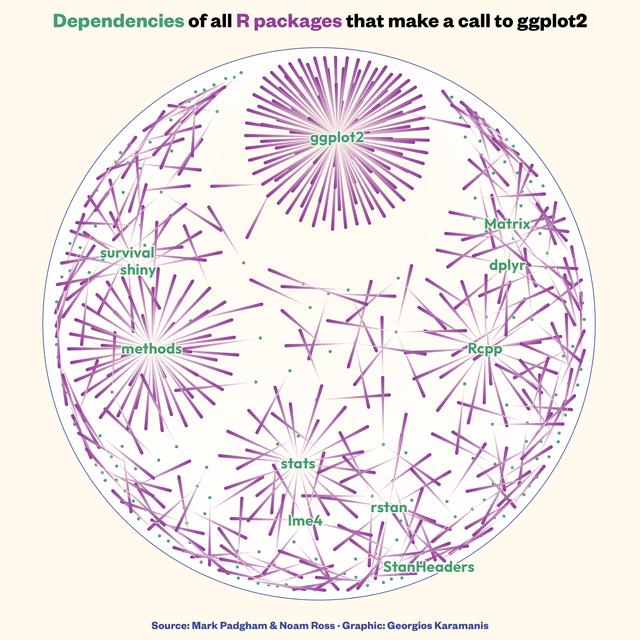 For this week’s #TidyTuesday I made a network graph of the dependencies of all R packages that make a call to ggplot2 Code on GitHub
TidyTuesday 2023/12
March 26, 2023
R & programming languages & Data Visualization
For this week’s #TidyTuesday I made a network graph of the dependencies of all R packages that make a call to ggplot2 Code on GitHub
TidyTuesday 2023/12
March 26, 2023
R & programming languages & Data Visualization
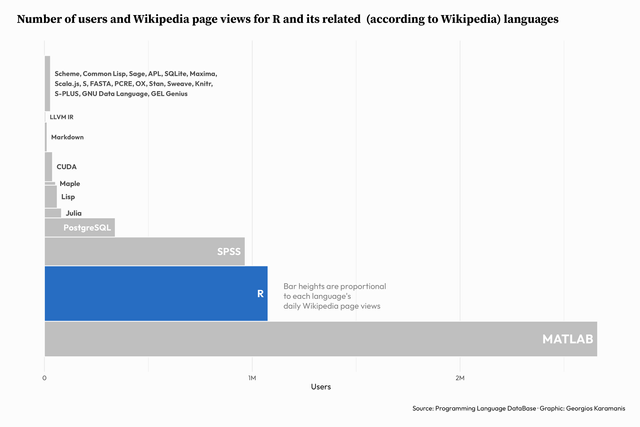 Two charts about R for this week’s #TidyTuesday Code on Github
TidyTuesday 2022/52
January 1, 2023
Star Trek & R & timeline & Data Visualization
Two charts about R for this week’s #TidyTuesday Code on Github
TidyTuesday 2022/52
January 1, 2023
Star Trek & R & timeline & Data Visualization
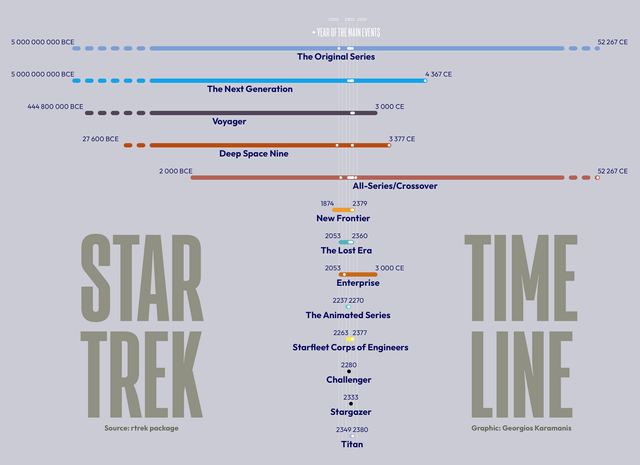 Star Trek timelines for this week’s #TidyTuesday. code at GitHub
TidyTuesday 2022/51
December 23, 2022
R & US & map & weather & wind & Data Visualization
Star Trek timelines for this week’s #TidyTuesday. code at GitHub
TidyTuesday 2022/51
December 23, 2022
R & US & map & weather & wind & Data Visualization
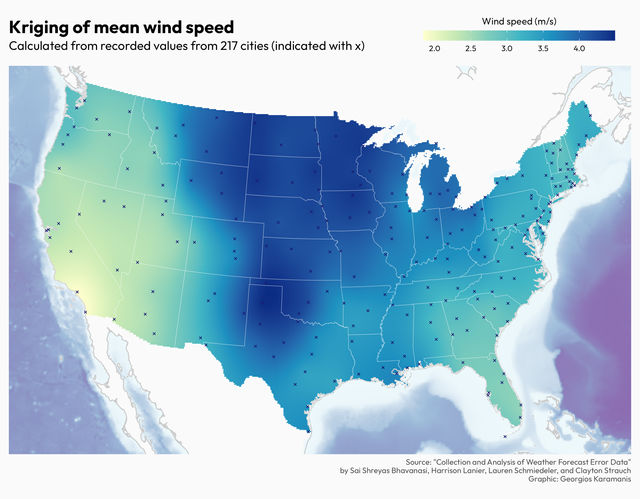 Mean wind speed for this week’s #TidyTuesday. First time using kriging interpolaration, inspired by the plots in the poster at the source of the
TidyTuesday 2022/50
December 17, 2022
R & retail & sales & US & Data Visualization
Mean wind speed for this week’s #TidyTuesday. First time using kriging interpolaration, inspired by the plots in the poster at the source of the
TidyTuesday 2022/50
December 17, 2022
R & retail & sales & US & Data Visualization
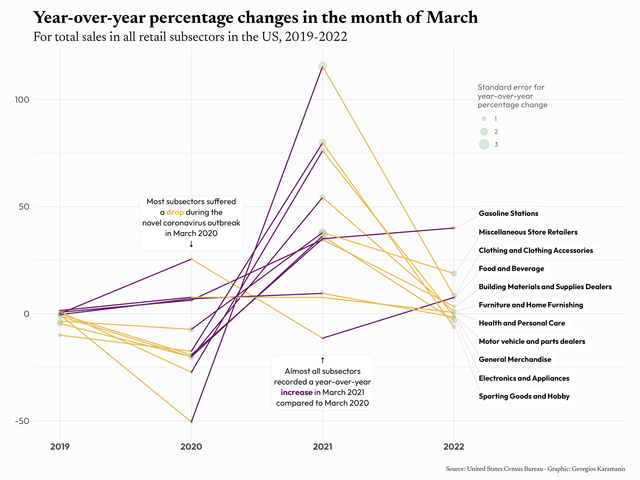 Retail sales for this week’s #TidyTuesday, comparing the YOY changes in March 2019-2022. Code on GitHub
TidyTuesday 2022/49
December 9, 2022
R & Manhattan & New York & map & elevators & buildings & Data Visualization
Retail sales for this week’s #TidyTuesday, comparing the YOY changes in March 2019-2022. Code on GitHub
TidyTuesday 2022/49
December 9, 2022
R & Manhattan & New York & map & elevators & buildings & Data Visualization
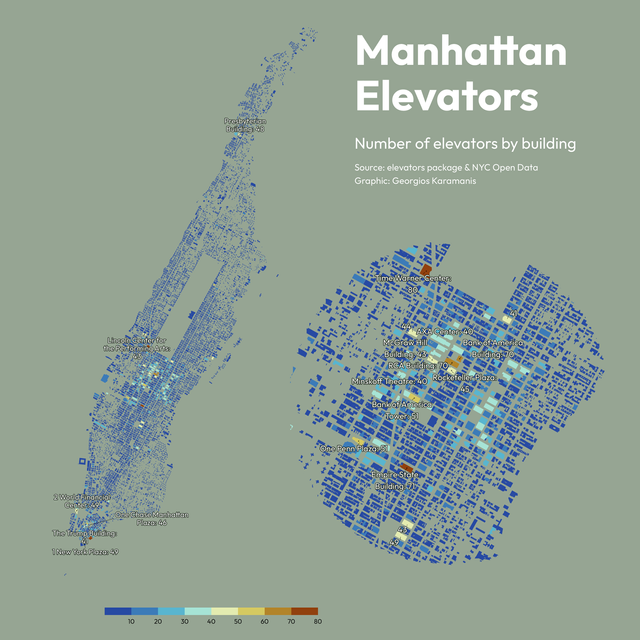 Number of elevators by building for this week’s #TidyTuesday, combining the elevator dataset with the building footprints spatial file from NYC Open
TidyTuesday 2022/48
December 3, 2022
R & TidyTuesday & football & FIFA & Data Visualization
Number of elevators by building for this week’s #TidyTuesday, combining the elevator dataset with the building footprints spatial file from NYC Open
TidyTuesday 2022/48
December 3, 2022
R & TidyTuesday & football & FIFA & Data Visualization
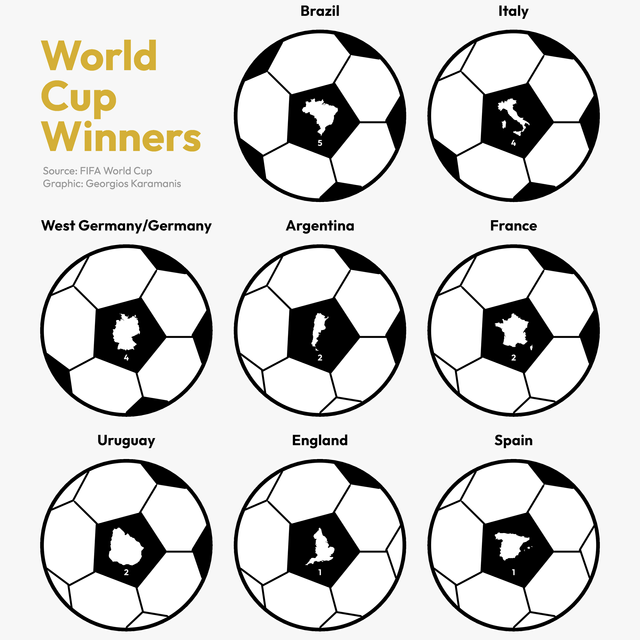 Number of FIFA World Cup titles for this week’s #TidyTuesday Code on GitHub
TidyTuesday 2022/47
November 27, 2022
R & Great Britain & map & museum & Data Visualization
Number of FIFA World Cup titles for this week’s #TidyTuesday Code on GitHub
TidyTuesday 2022/47
November 27, 2022
R & Great Britain & map & museum & Data Visualization
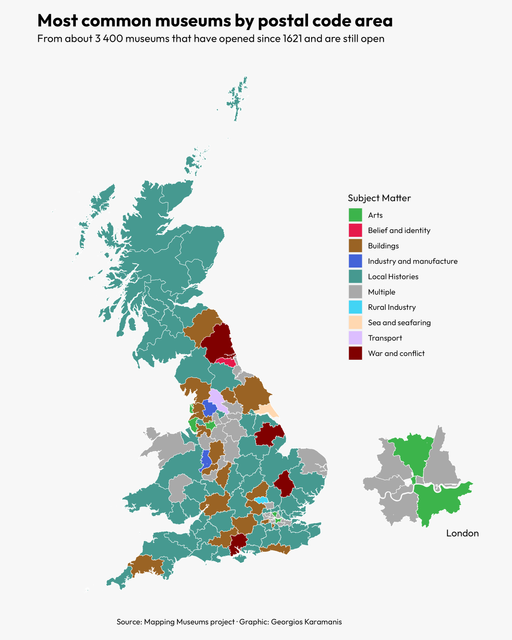 Most common types of museums for this week’s #TidyTuesday Code on GitHub
TidyTuesday 2022/46
November 20, 2022
webpages & Internet & speed & TidyTuesday & R & Data Visualization
Most common types of museums for this week’s #TidyTuesday Code on GitHub
TidyTuesday 2022/46
November 20, 2022
webpages & Internet & speed & TidyTuesday & R & Data Visualization
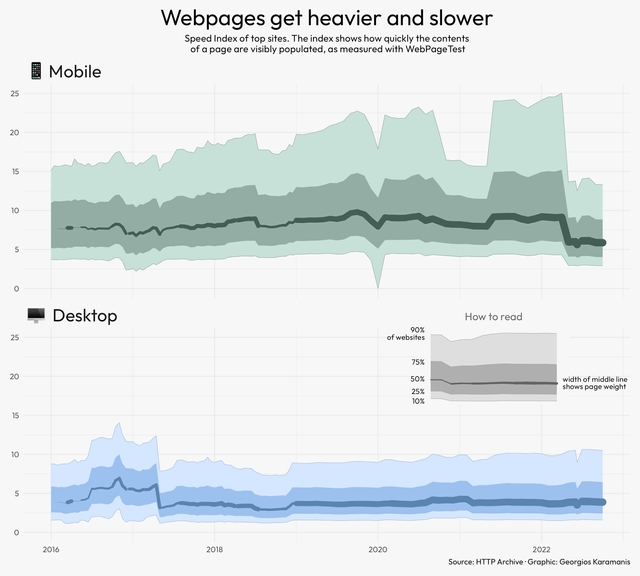 Webpages speed for this week’s #TidyTuesday code on GitHub
TidyTuesday 2022/43
October 27, 2022
R & British Bake Off & anchor chart & TV & Data Visualization
Webpages speed for this week’s #TidyTuesday code on GitHub
TidyTuesday 2022/43
October 27, 2022
R & British Bake Off & anchor chart & TV & Data Visualization
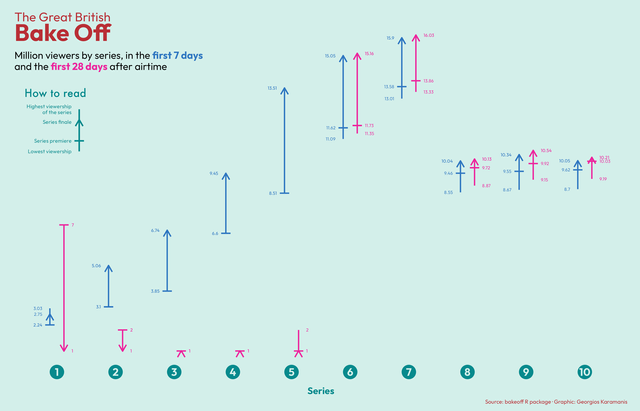 For this week’s #TidyTuesday I made an… anchor chart (as seen in this post). Code on GitHub
TidyTuesday 2022/42
October 23, 2022
TV & Stranger Things & R & TidyTuesday & Data Visualization
For this week’s #TidyTuesday I made an… anchor chart (as seen in this post). Code on GitHub
TidyTuesday 2022/42
October 23, 2022
TV & Stranger Things & R & TidyTuesday & Data Visualization
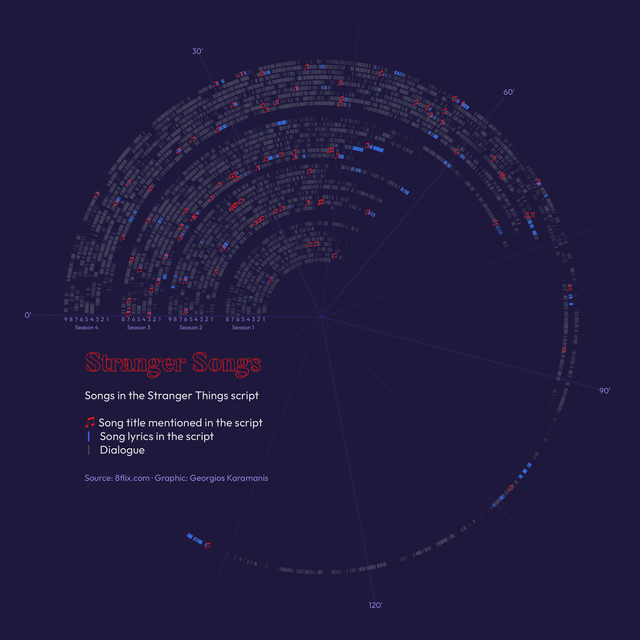 For this week’s #TidyTuesday I plotted the songs of Stranger Things Code on GitHub
TidyTuesday 2022/40
October 7, 2022
emoji & Product Hunt & waffle & R & TidyTuesday & Data Visualization
For this week’s #TidyTuesday I plotted the songs of Stranger Things Code on GitHub
TidyTuesday 2022/40
October 7, 2022
emoji & Product Hunt & waffle & R & TidyTuesday & Data Visualization
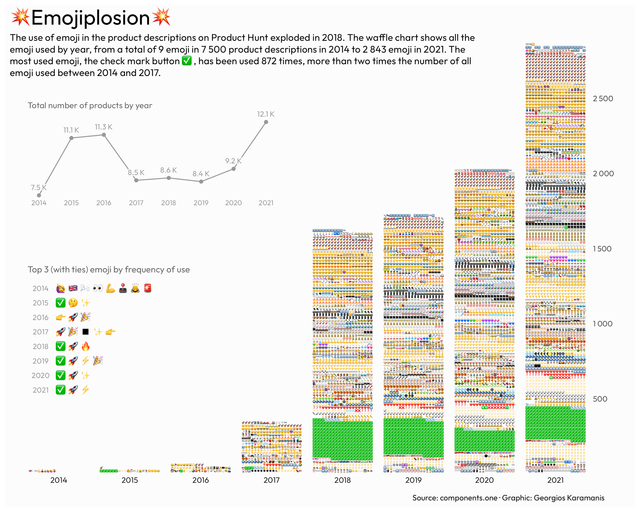 For this week’s #TidyTuesday I made a ✅ waffle chart and ✅ two more charts ✅ with all the emoji used in Product Hunt product descriptions code on
TidyTuesday 2022/39
September 28, 2022
artists & map & US & R & TidyTuesday & Data Visualization
For this week’s #TidyTuesday I made a ✅ waffle chart and ✅ two more charts ✅ with all the emoji used in Product Hunt product descriptions code on
TidyTuesday 2022/39
September 28, 2022
artists & map & US & R & TidyTuesday & Data Visualization
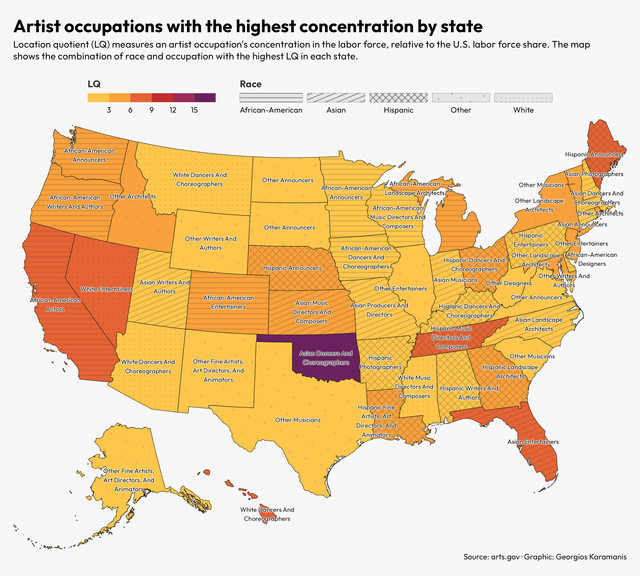 For this week’s #TidyTuesday I created a map of the combination of race and artist occupation with the highest concentration by state code on GitHub
TidyTuesday 2022/38
September 24, 2022
wastewater treatment plants & R & map & Mediterranean sea & Data Visualization
For this week’s #TidyTuesday I created a map of the combination of race and artist occupation with the highest concentration by state code on GitHub
TidyTuesday 2022/38
September 24, 2022
wastewater treatment plants & R & map & Mediterranean sea & Data Visualization
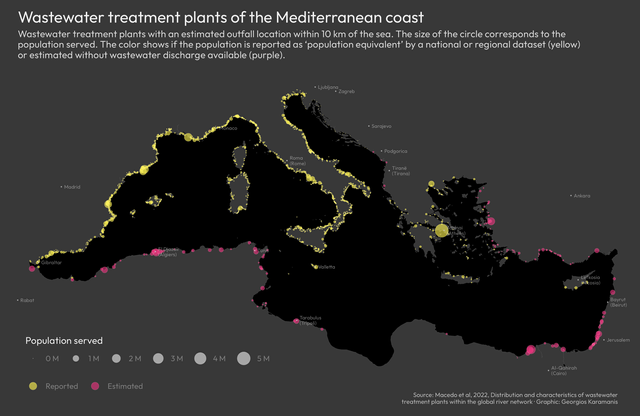 For this week’s #TidyTuesday I created a map of the wastewater treatment plants around the Mediterranean code on GitHub
TidyTuesday 2022/37
September 16, 2022
Bigfoot & bear & US & map & R & Data Visualization
For this week’s #TidyTuesday I created a map of the wastewater treatment plants around the Mediterranean code on GitHub
TidyTuesday 2022/37
September 16, 2022
Bigfoot & bear & US & map & R & Data Visualization
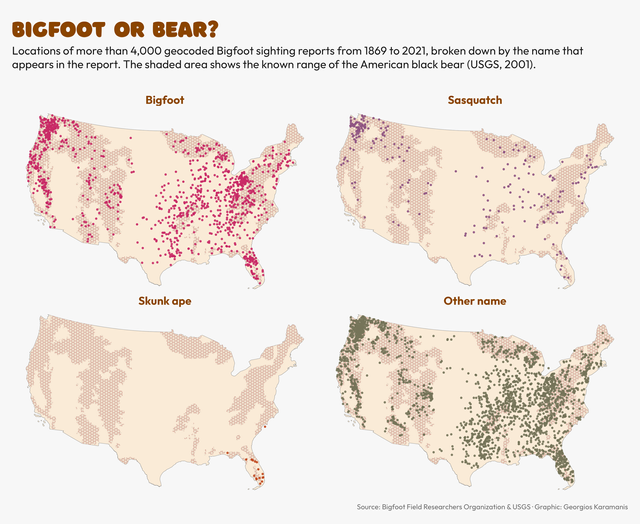 Bigfoot or bear for this week’s #TidyTuesday code on GitHub
NBA games that ended with the same score on the same day
September 12, 2022
R & NBA & EuroBasket & Code
Bigfoot or bear for this week’s #TidyTuesday code on GitHub
NBA games that ended with the same score on the same day
September 12, 2022
R & NBA & EuroBasket & Code
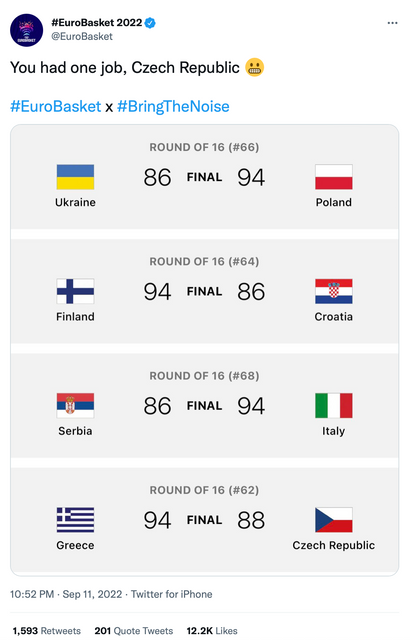 Yesterday, during Round of 16 of the FIBA EuroBasket 2022, three matches ended with the same score, 94-86. [ ]( You had one job, Czech Republic
TidyTuesday 2022/36
September 9, 2022
LEGO & gray & color & R & Code
Yesterday, during Round of 16 of the FIBA EuroBasket 2022, three matches ended with the same score, 94-86. [ ]( You had one job, Czech Republic
TidyTuesday 2022/36
September 9, 2022
LEGO & gray & color & R & Code
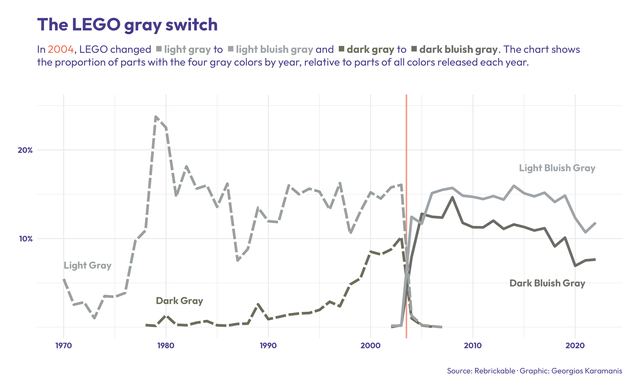 The LEGO gray switch for this week’s #TidyTuesday with data from @Rebrickable. The change was apparently a big thing. Code on GitHub
TidyTuesday 2022/35
September 1, 2022
R & Pell grant & mekko & Data Visualization
The LEGO gray switch for this week’s #TidyTuesday with data from @Rebrickable. The change was apparently a big thing. Code on GitHub
TidyTuesday 2022/35
September 1, 2022
R & Pell grant & mekko & Data Visualization
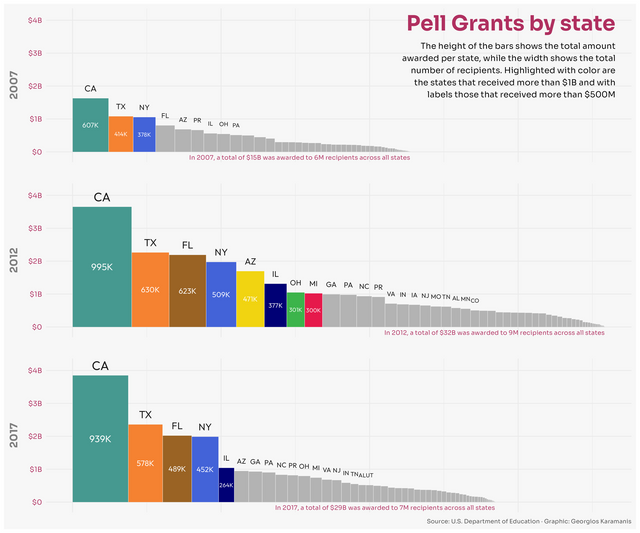 For this week’s #TidyTuesday I made a bar Mekko chart of the Pell grants by state for 2007, 2012 and 2017. It was too late in the process when I
TidyTuesday 2022/33
August 21, 2022
personality & R & Data Visualization
For this week’s #TidyTuesday I made a bar Mekko chart of the Pell grants by state for 2007, 2012 and 2017. It was too late in the process when I
TidyTuesday 2022/33
August 21, 2022
personality & R & Data Visualization
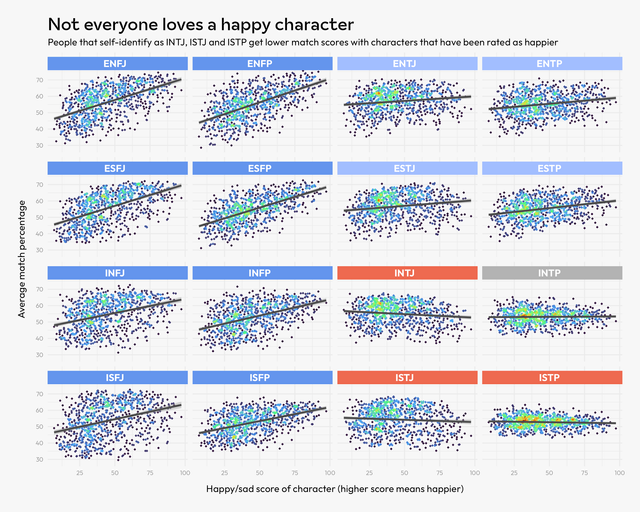 For this week’s #TidyTuesday I plotted the average match score with a character vs. the happy/sad rating of the character. The plots show the
TidyTuesday 2022/32
August 12, 2022
R & Ferris wheels & Data Visualization
For this week’s #TidyTuesday I plotted the average match score with a character vs. the happy/sad rating of the character. The plots show the
TidyTuesday 2022/32
August 12, 2022
R & Ferris wheels & Data Visualization
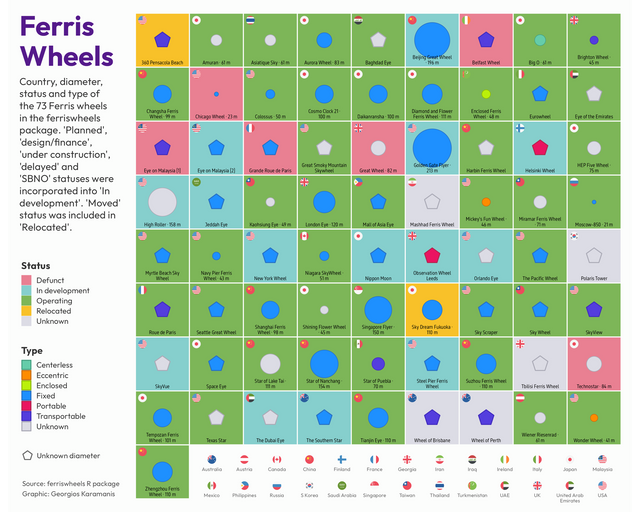 For this week’s #TidyTuesday I plotted the country, diameter, status and type of the 73 Ferris wheels in the ferriswheels R package by Emil
TidyTuesday 2022/31
August 7, 2022
R & frogs & heatmap & map & Data Visualization
For this week’s #TidyTuesday I plotted the country, diameter, status and type of the 73 Ferris wheels in the ferriswheels R package by Emil
TidyTuesday 2022/31
August 7, 2022
R & frogs & heatmap & map & Data Visualization
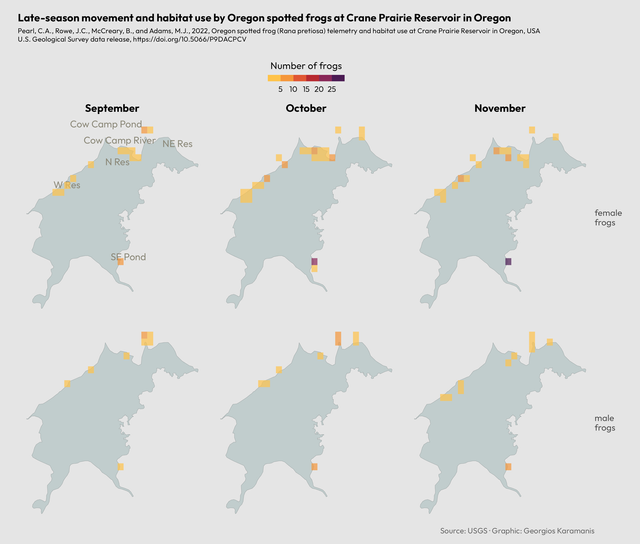 For this week’s #TidyTuesday I made a simple heatmap of frog observations by month and sex code on GitHub
TidyTuesday 2022/28
July 15, 2022
Greece & flights & R & Data Visualization
For this week’s #TidyTuesday I made a simple heatmap of frog observations by month and sex code on GitHub
TidyTuesday 2022/28
July 15, 2022
Greece & flights & R & Data Visualization
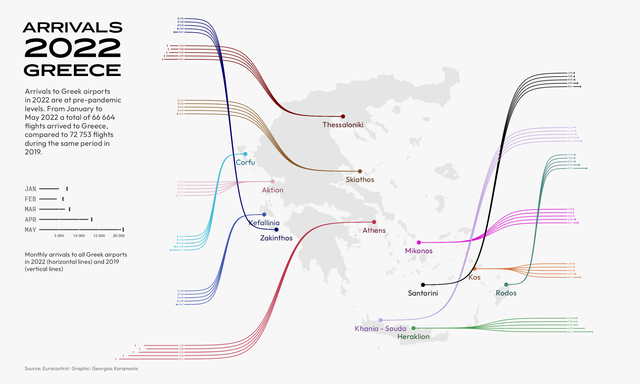 For this week’s #TidyTuesday I plotted the arrivals to Greek airports in 2022 compared to 2019. code on GitHub
TidyTuesday 2022/24
June 16, 2022
drought & US & map & R & Data Visualization
For this week’s #TidyTuesday I plotted the arrivals to Greek airports in 2022 compared to 2019. code on GitHub
TidyTuesday 2022/24
June 16, 2022
drought & US & map & R & Data Visualization
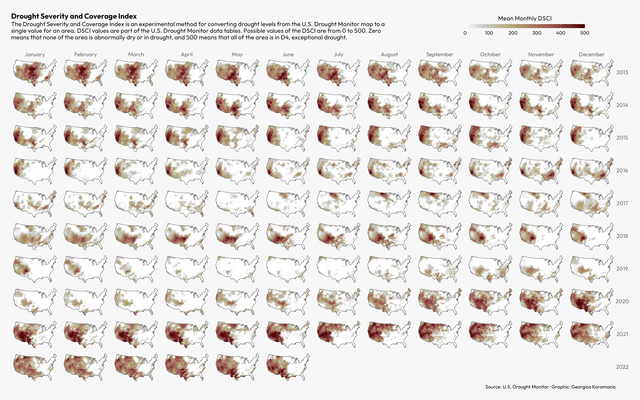 Small multiples mapping the Drought Severity and Coverage Index the last 10 years for this week’s #TidyTuesday. The subtitle text was taken from the
TidyTuesday 2022/23
June 10, 2022
Pride & R & corporate & donations & Data Visualization
Small multiples mapping the Drought Severity and Coverage Index the last 10 years for this week’s #TidyTuesday. The subtitle text was taken from the
TidyTuesday 2022/23
June 10, 2022
Pride & R & corporate & donations & Data Visualization
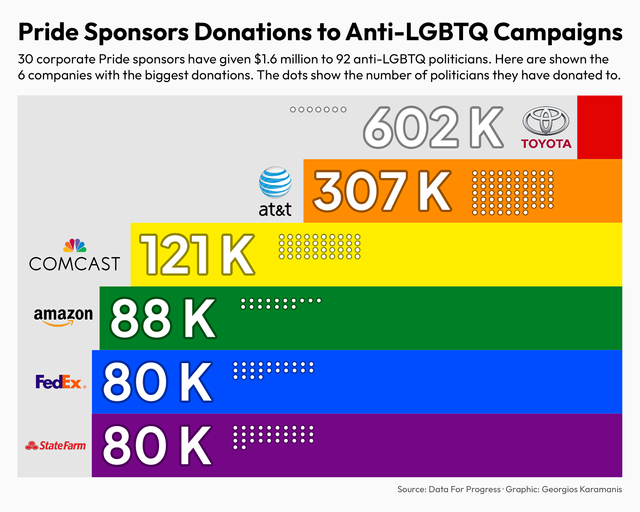 Pride Sponsors Donations to Anti-LGBTQ Campaigns for this week’s #TidyTuesday Source: Data for Progress code on GitHub
TidyTuesday 2022/20
May 19, 2022
Eurovision & scoreboard & R & tutorial & Data Visualization
Pride Sponsors Donations to Anti-LGBTQ Campaigns for this week’s #TidyTuesday Source: Data for Progress code on GitHub
TidyTuesday 2022/20
May 19, 2022
Eurovision & scoreboard & R & tutorial & Data Visualization
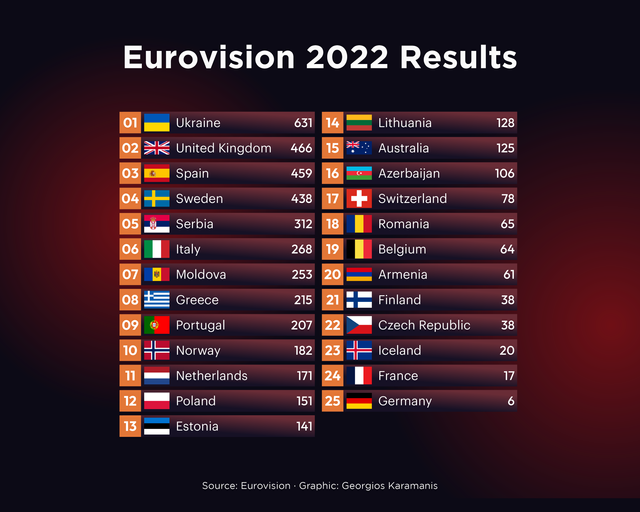 For this week’s #TidyTuesday I recreated the scoreboard from this year’s Eurovision with ggplot. code on GitHub Here is a mini tutorial: I used
TidyTuesday 2022/19
May 11, 2022
R & TidyTuesday & books & New York Times & bestsellers & Data Visualization
For this week’s #TidyTuesday I recreated the scoreboard from this year’s Eurovision with ggplot. code on GitHub Here is a mini tutorial: I used
TidyTuesday 2022/19
May 11, 2022
R & TidyTuesday & books & New York Times & bestsellers & Data Visualization
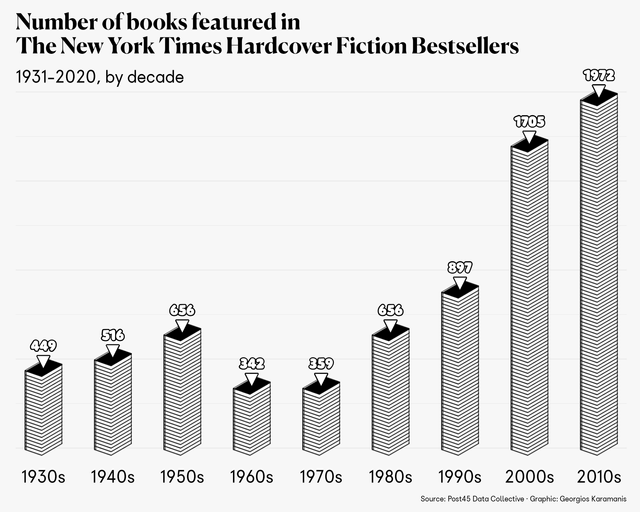 Number of books featured in The New York Times Hardcover Fiction Bestsellers for this week’s #TidyTuesday. First “published” plot using {ggsvg} Code
TidyTuesday 2022/18
May 8, 2022
R & energy & solar & wind & TidyTuesday & Data Visualization
Number of books featured in The New York Times Hardcover Fiction Bestsellers for this week’s #TidyTuesday. First “published” plot using {ggsvg} Code
TidyTuesday 2022/18
May 8, 2022
R & energy & solar & wind & TidyTuesday & Data Visualization
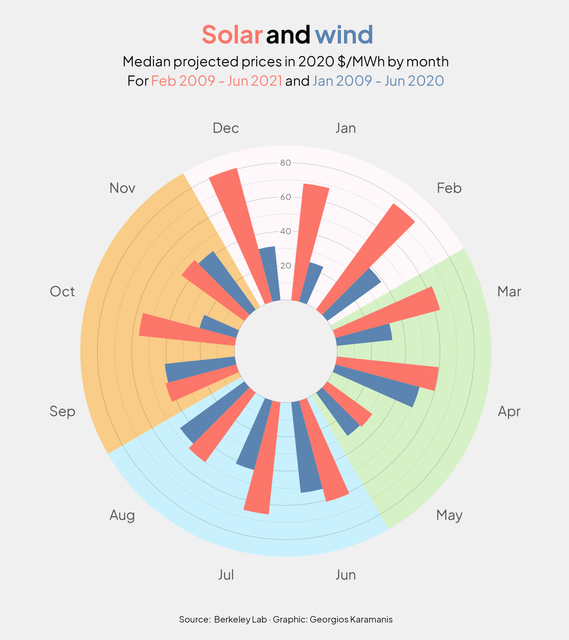 Solar and wind costs by month of year for this week’s #TidyTuesday Code on GitHub
TidyTuesday 2022/17
April 29, 2022
R & Kaggle & people & Data Visualization
Solar and wind costs by month of year for this week’s #TidyTuesday Code on GitHub
TidyTuesday 2022/17
April 29, 2022
R & Kaggle & people & Data Visualization
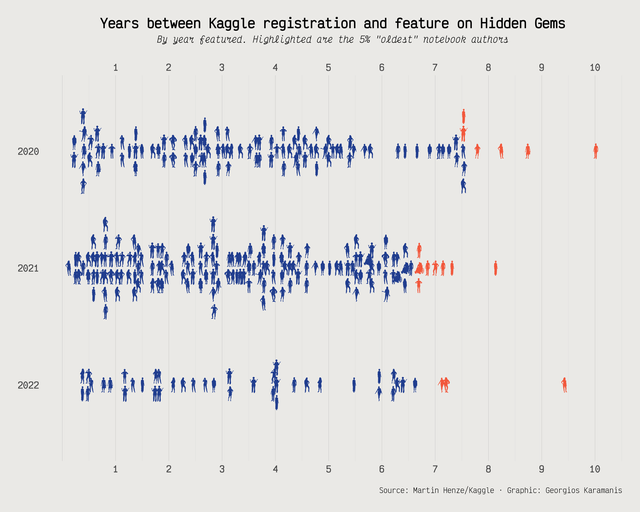 For this week’s #TidyTuesday I used the new family aesthetic of ggdist::geom_dots() to plot the Kaggle age of the notebook authors featured on
TidyTuesday 2022/16
April 22, 2022
crossword & The Times & Jumbo & cryptic & R & Data Visualization
For this week’s #TidyTuesday I used the new family aesthetic of ggdist::geom_dots() to plot the Kaggle age of the notebook authors featured on
TidyTuesday 2022/16
April 22, 2022
crossword & The Times & Jumbo & cryptic & R & Data Visualization
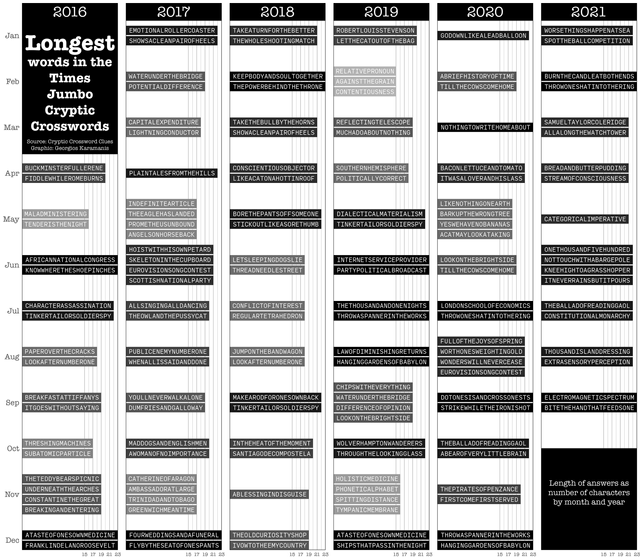 For this week’s #TidyTuesday I looked at the longest answers in The Times Jumbo Cryptic Crosswords. code and full-size image on GitHub
TidyTuesday 2022/15
April 14, 2022
indoor air pollution & R & world & Data Visualization
For this week’s #TidyTuesday I looked at the longest answers in The Times Jumbo Cryptic Crosswords. code and full-size image on GitHub
TidyTuesday 2022/15
April 14, 2022
indoor air pollution & R & world & Data Visualization
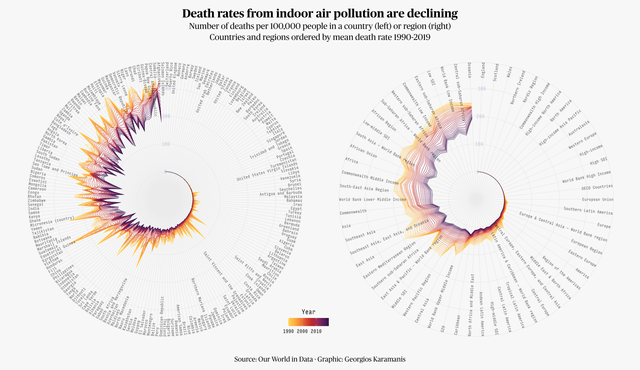 Deaths from indoor air pollution for this week’s #TidyTuesday. Not the most readable chart but I got a little too excited making it, used two hacks
TidyTuesday 2022/14
April 8, 2022
news organizations & R & characters & Data Visualization
Deaths from indoor air pollution for this week’s #TidyTuesday. Not the most readable chart but I got a little too excited making it, used two hacks
TidyTuesday 2022/14
April 8, 2022
news organizations & R & characters & Data Visualization
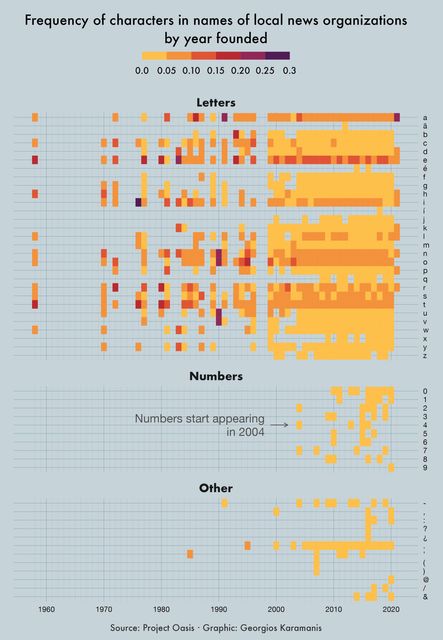 For this week’s #TidyTuesday I looked at the frequency of characters in names of U.S. local news organizations by the year they were founded.
TidyTuesday 2022/13
April 1, 2022
sports & US & map & R & Data Visualization
For this week’s #TidyTuesday I looked at the frequency of characters in names of U.S. local news organizations by the year they were founded.
TidyTuesday 2022/13
April 1, 2022
sports & US & map & R & Data Visualization
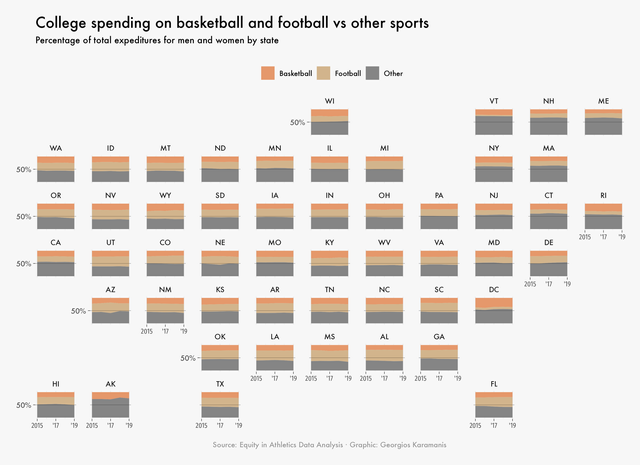 College spending on basketball and football vs other sports for this week’s #TidyTuesday Code on GitHub
TidyTuesday 2022/12
March 23, 2022
names & R & Data Visualization
College spending on basketball and football vs other sports for this week’s #TidyTuesday Code on GitHub
TidyTuesday 2022/12
March 23, 2022
names & R & Data Visualization
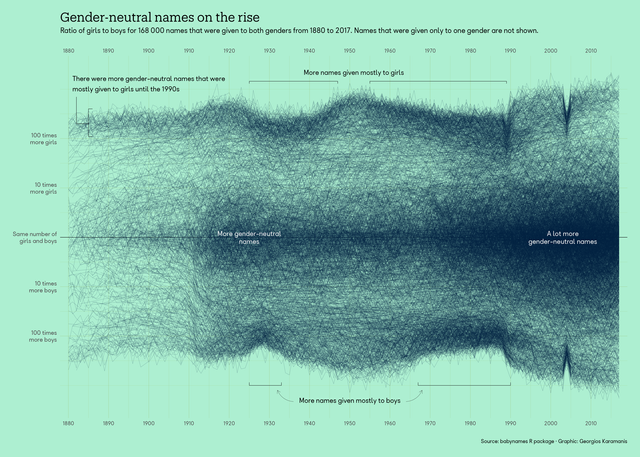 For this week’s #TidyTuesday I plotted the ratio of girls to boys for names that were given to both genders between 1880 and 2017 in the US. There
TidyTuesday 2022/11
March 19, 2022
R & packages & CRAN & Data Visualization
For this week’s #TidyTuesday I plotted the ratio of girls to boys for names that were given to both genders between 1880 and 2017 in the US. There
TidyTuesday 2022/11
March 19, 2022
R & packages & CRAN & Data Visualization
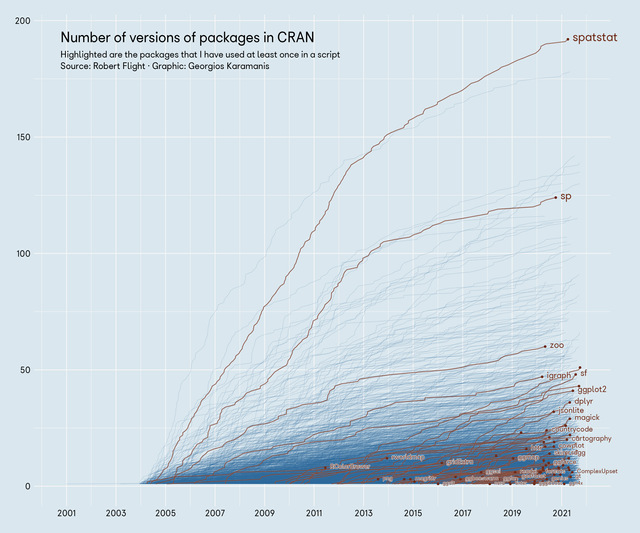 For this #TidyTuesday I plotted the number of versions of packages in CRAN and highlighted those I have used at least once. code on GitHub
TidyTuesday 2022/10
March 12, 2022
Erasmus & exchange & students & Europe & R & Data Visualization
For this #TidyTuesday I plotted the number of versions of packages in CRAN and highlighted those I have used at least once. code on GitHub
TidyTuesday 2022/10
March 12, 2022
Erasmus & exchange & students & Europe & R & Data Visualization
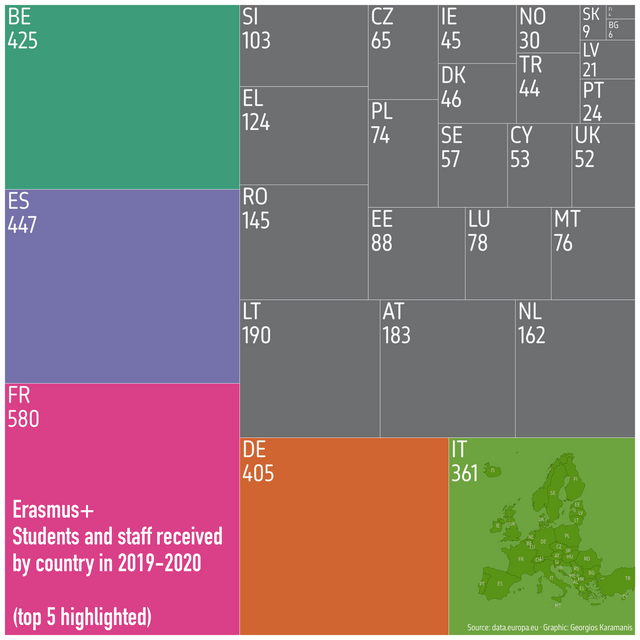 For this #TidyTuesday I made a tree map about the Erasmus+ students and staff received by each country in 2019-2020 code on GitHub
TidyTuesday 2022/09
March 2, 2022
R & EV & charging stations & US & map & TidyTuesday & Data Visualization
For this #TidyTuesday I made a tree map about the Erasmus+ students and staff received by each country in 2019-2020 code on GitHub
TidyTuesday 2022/09
March 2, 2022
R & EV & charging stations & US & map & TidyTuesday & Data Visualization
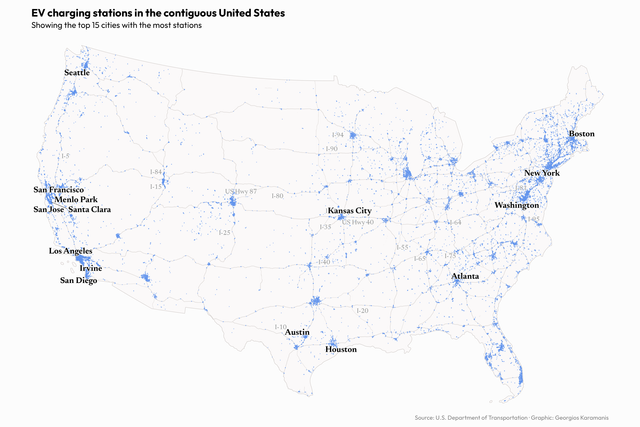 A map about EV charging stations in the US for this week’s #TidyTuesday. I wanted to make a simple and good-looking map, used another shapefile for
TidyTuesday 2022/08
February 25, 2022
R & Africa & political rights & civil liberties & map & Data Visualization
A map about EV charging stations in the US for this week’s #TidyTuesday. I wanted to make a simple and good-looking map, used another shapefile for
TidyTuesday 2022/08
February 25, 2022
R & Africa & political rights & civil liberties & map & Data Visualization
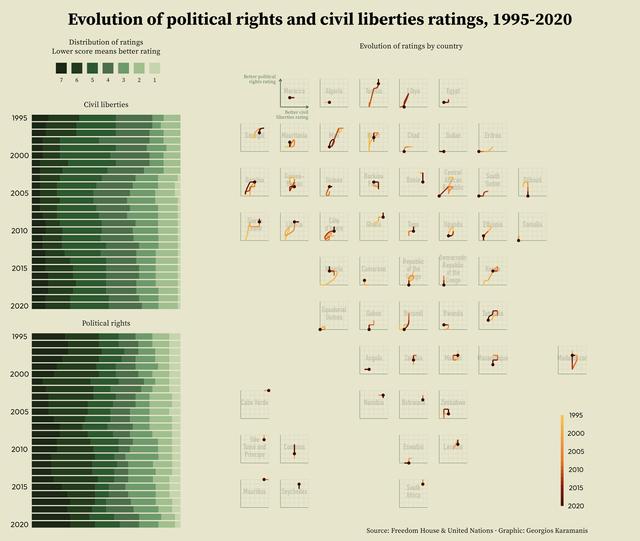 Political rights and civil liberties in Africa for this week’s #TidyTuesday code on GitHub
TidyTuesday 2022/07
February 17, 2022
R & DuBois & US & map & triangle & Data Visualization
Political rights and civil liberties in Africa for this week’s #TidyTuesday code on GitHub
TidyTuesday 2022/07
February 17, 2022
R & DuBois & US & map & triangle & Data Visualization
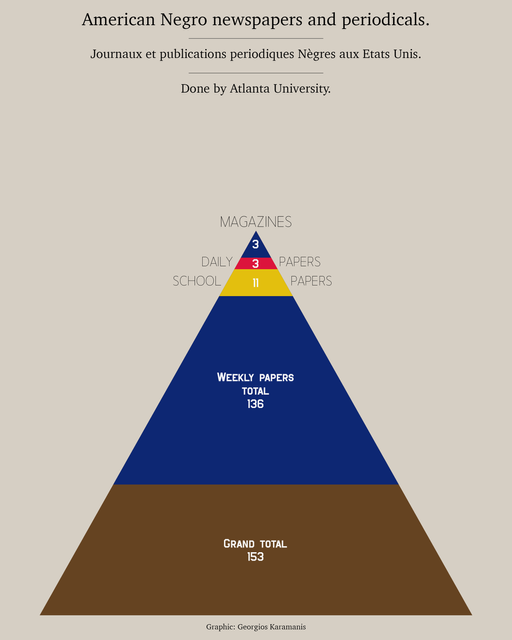 Two plots for this week’s #TidyTuesday and #DuBoisChallenge2022, recreating plates 61 and 42 Code on GitHub
TidyTuesday 2022/06
February 12, 2022
Tuskegee Airmen & R & TidyTuesday & Data Visualization
Two plots for this week’s #TidyTuesday and #DuBoisChallenge2022, recreating plates 61 and 42 Code on GitHub
TidyTuesday 2022/06
February 12, 2022
Tuskegee Airmen & R & TidyTuesday & Data Visualization
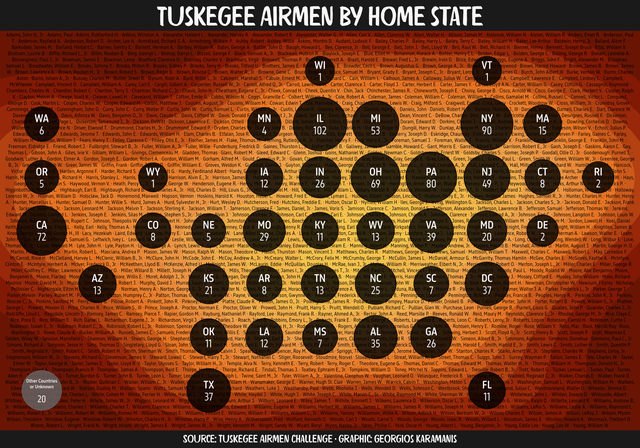 Home state of the Tuskegee Airmen for this week’s #TidyTuesday with data from the #TuskegeeAirmenChallenge Code on GitHub
TidyTuesday 2022/05
February 1, 2022
R & dogs & dog breeds & Data Visualization
Home state of the Tuskegee Airmen for this week’s #TidyTuesday with data from the #TuskegeeAirmenChallenge Code on GitHub
TidyTuesday 2022/05
February 1, 2022
R & dogs & dog breeds & Data Visualization
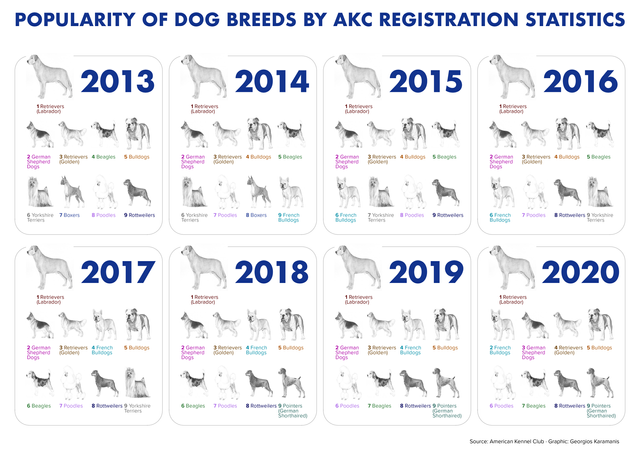 Popular dog breeds for this week’s #TidyTuesday with data from the American Kennel Club. Made with ggplot2, ggimage, ggtext and grid code on GitHub
TidyTuesday 2022/04
January 26, 2022
R & board games & Data Visualization
Popular dog breeds for this week’s #TidyTuesday with data from the American Kennel Club. Made with ggplot2, ggimage, ggtext and grid code on GitHub
TidyTuesday 2022/04
January 26, 2022
R & board games & Data Visualization
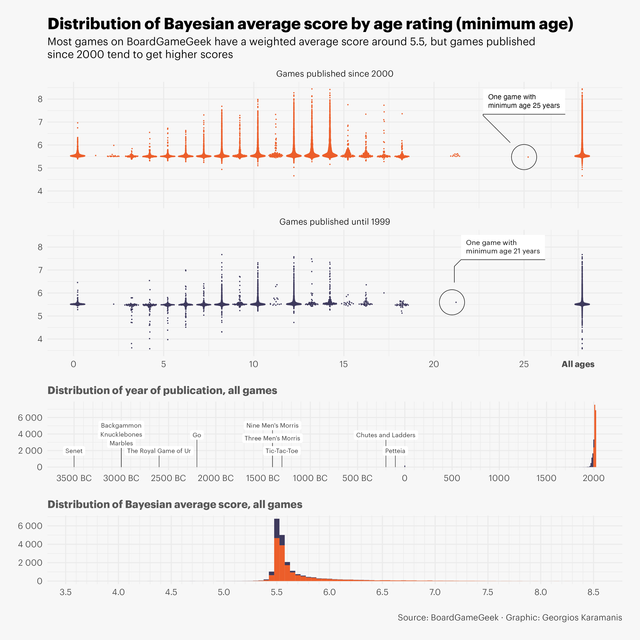 Board games for this week’s #TidyTuesday with data from @BoardGameGeek. Used a few packages to show different distributions and combine them into
TidyTuesday 2022/03
January 21, 2022
R & chocolate & cocoa & Data Visualization
Board games for this week’s #TidyTuesday with data from @BoardGameGeek. Used a few packages to show different distributions and combine them into
TidyTuesday 2022/03
January 21, 2022
R & chocolate & cocoa & Data Visualization
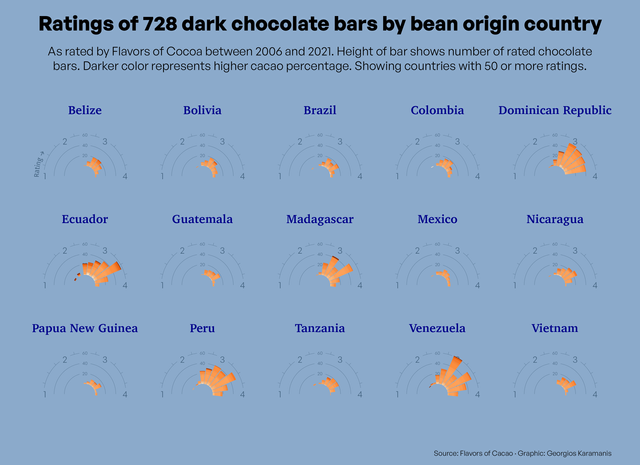 Dark chocolate bar ratings for this week’s #TidyTuesday. code: https://github.com/gkaramanis/tidytuesday/tree/master/2022/2022-week_03
TidyTuesday 2022/02
January 14, 2022
R & bees & Data Visualization
Dark chocolate bar ratings for this week’s #TidyTuesday. code: https://github.com/gkaramanis/tidytuesday/tree/master/2022/2022-week_03
TidyTuesday 2022/02
January 14, 2022
R & bees & Data Visualization
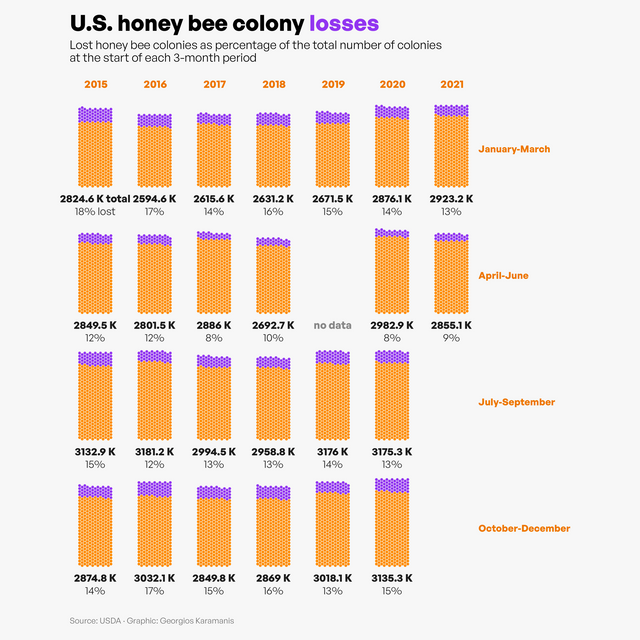 Honey bee colony losses for this week’s #TidyTuesday Code and plots for every state on GitHub
TidyTuesday 2022/01
January 5, 2022
R & hate crime & transphobic & Sweden & Data Visualization
Honey bee colony losses for this week’s #TidyTuesday Code and plots for every state on GitHub
TidyTuesday 2022/01
January 5, 2022
R & hate crime & transphobic & Sweden & Data Visualization
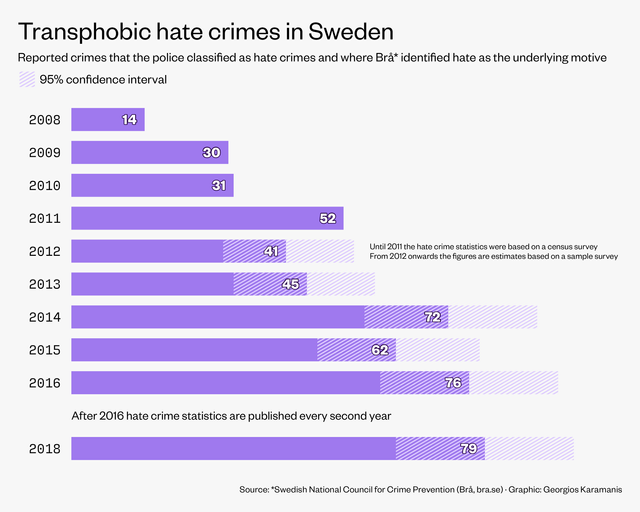 Transphobic hate crimes in Sweden for this week’s Bring Your Own Data #TidyTuesday. The inspiration was a plot made by @thomasoide for an Axios
TidyTuesday 2021/51
December 24, 2021
Starbucks & coffee & R & TidyTuesday & Data Visualization
Transphobic hate crimes in Sweden for this week’s Bring Your Own Data #TidyTuesday. The inspiration was a plot made by @thomasoide for an Axios
TidyTuesday 2021/51
December 24, 2021
Starbucks & coffee & R & TidyTuesday & Data Visualization
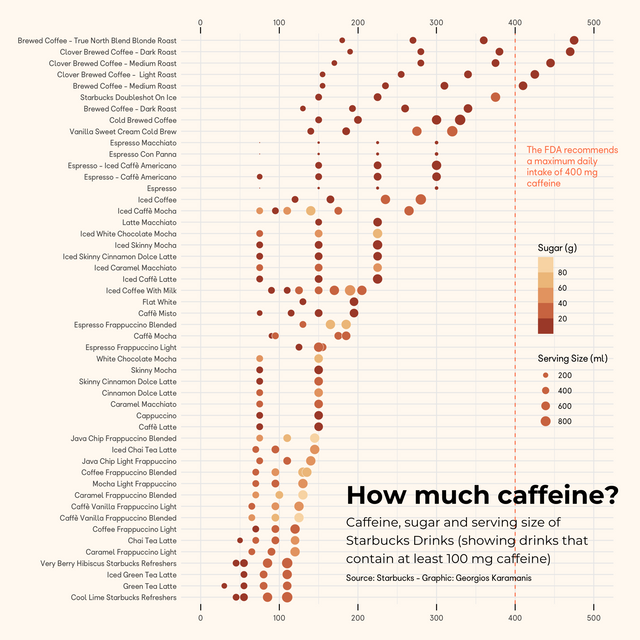 Caffeine, sugar and serving size of Starbucks drinks for this week’s #TidyTuesday. code on GitHub
TidyTuesday 2021/49
December 10, 2021
R & spiders & TidyTuesday & Data Visualization
Caffeine, sugar and serving size of Starbucks drinks for this week’s #TidyTuesday. code on GitHub
TidyTuesday 2021/49
December 10, 2021
R & spiders & TidyTuesday & Data Visualization
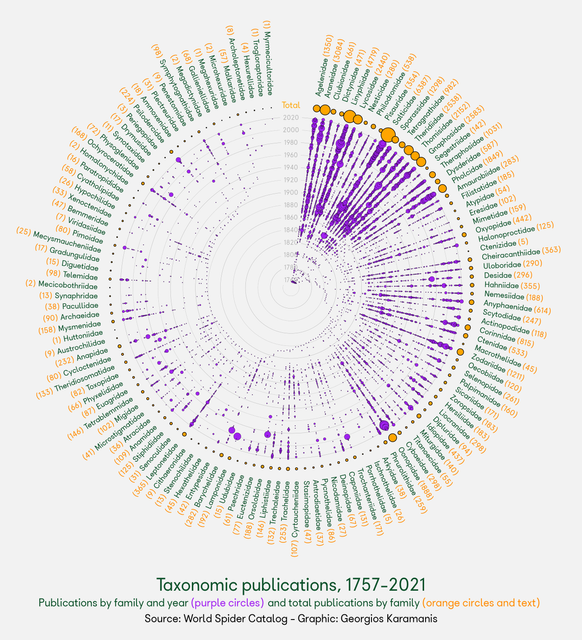 Spider taxonomy publications for this week’s #TidyTuesday with data from the World Spider Catalog. Not very easy to read but looks nice code and big
TidyTuesday 2021/48
December 1, 2021
R & cricket & Notabilia & Data Visualization
Spider taxonomy publications for this week’s #TidyTuesday with data from the World Spider Catalog. Not very easy to read but looks nice code and big
TidyTuesday 2021/48
December 1, 2021
R & cricket & Notabilia & Data Visualization
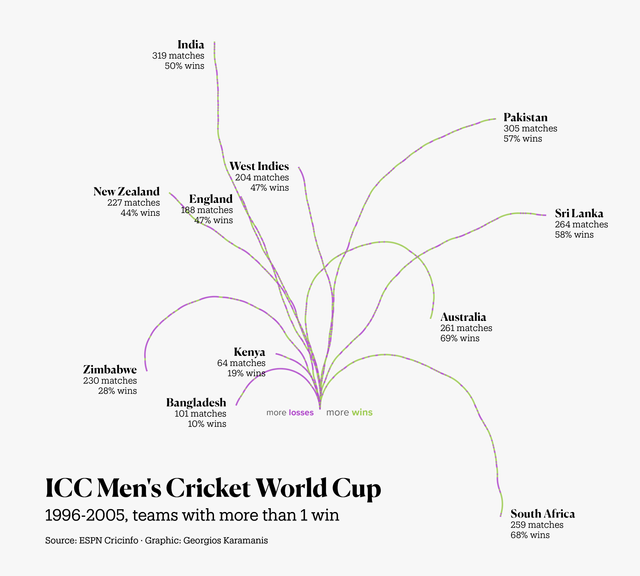 Cricket World Cup team wins for this week’s #TidyTuesday. I got a little lazy this week and reused the code I wrote some time ago to recreate Moritz
TidyTuesday 2021/47
November 28, 2021
Doctor Who & scarf & IMDB & R & Data Visualization
Cricket World Cup team wins for this week’s #TidyTuesday. I got a little lazy this week and reused the code I wrote some time ago to recreate Moritz
TidyTuesday 2021/47
November 28, 2021
Doctor Who & scarf & IMDB & R & Data Visualization
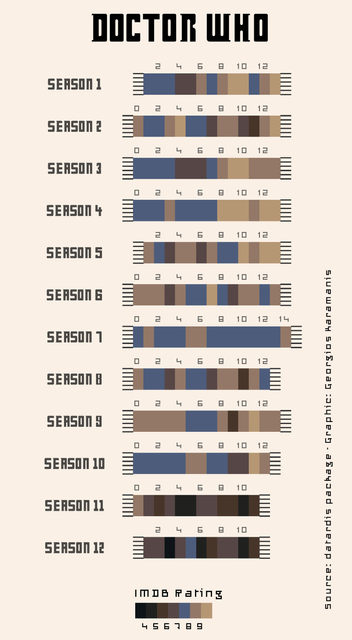 Doctor Who IMDB ratings for this week’s #TidyTuesday, in the style of the 4th Doctor’s scarf code on GitHub
30DayMapChallenge 2021
November 27, 2021
R & 30DayMapChallenge & Greece & map & Map & Data Visualization
Doctor Who IMDB ratings for this week’s #TidyTuesday, in the style of the 4th Doctor’s scarf code on GitHub
30DayMapChallenge 2021
November 27, 2021
R & 30DayMapChallenge & Greece & map & Map & Data Visualization
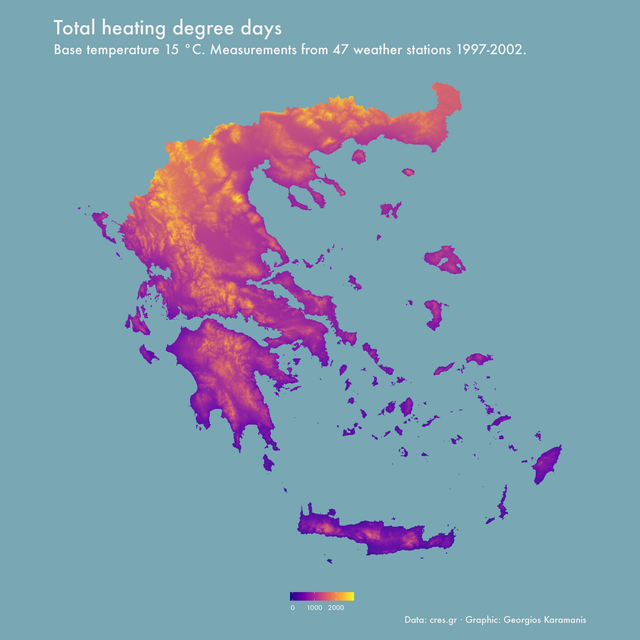 This post is going to be continuously updated with submissions to the 2021 #30DayMapChallenge. The code for all plots is on GitHub. For day 1, I
TidyTuesday 2021/45
November 10, 2021
R & Africa & map & 30DayMapChallenge & population & Data Visualization & Map
This post is going to be continuously updated with submissions to the 2021 #30DayMapChallenge. The code for all plots is on GitHub. For day 1, I
TidyTuesday 2021/45
November 10, 2021
R & Africa & map & 30DayMapChallenge & population & Data Visualization & Map
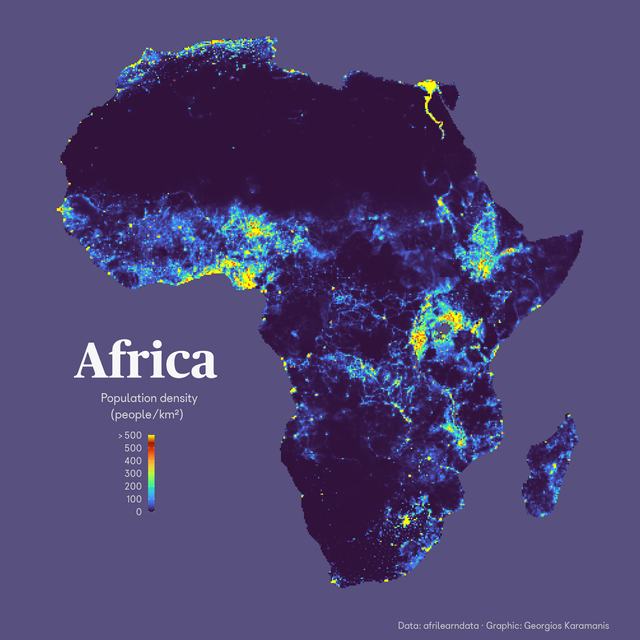 Cross post for this week’s #TidyTuesday and day 10 of #30daymapchallenge, raster. Population density in Africa with raster data from @afrimapr Code
TidyTuesday 2021/44
November 6, 2021
R & plot & Earth & Globe & life expectancy & Data Visualization
Cross post for this week’s #TidyTuesday and day 10 of #30daymapchallenge, raster. Population density in Africa with raster data from @afrimapr Code
TidyTuesday 2021/44
November 6, 2021
R & plot & Earth & Globe & life expectancy & Data Visualization
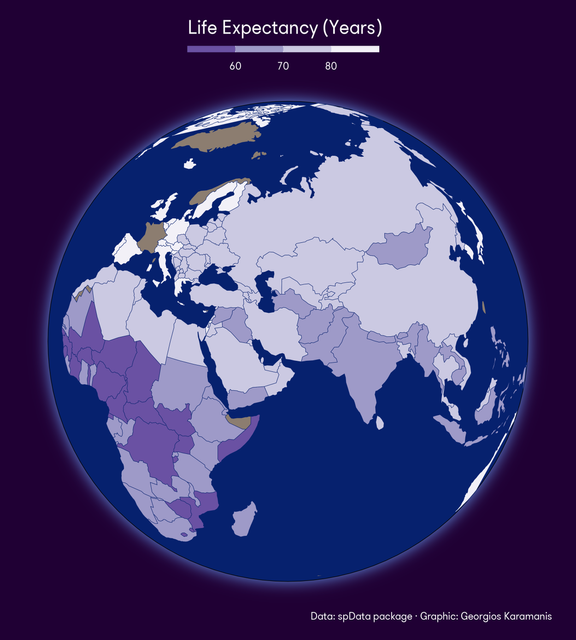 A map for this week’s #TidyTuesday, showing life expectancy on a globe with data from the spData package code on GitHub
TidyTuesday 2021/43
October 30, 2021
trail running & R & plot & TidyTuesday & Data Visualization
Trail running for this week’s #TidyTuesday. A lollipop chart showing the difference of median pace between men and women for 85 nationalities. code
TidyTuesday 2021/42
October 23, 2021
R & pumpkins & Venn & Data Visualization
A map for this week’s #TidyTuesday, showing life expectancy on a globe with data from the spData package code on GitHub
TidyTuesday 2021/43
October 30, 2021
trail running & R & plot & TidyTuesday & Data Visualization
Trail running for this week’s #TidyTuesday. A lollipop chart showing the difference of median pace between men and women for 85 nationalities. code
TidyTuesday 2021/42
October 23, 2021
R & pumpkins & Venn & Data Visualization
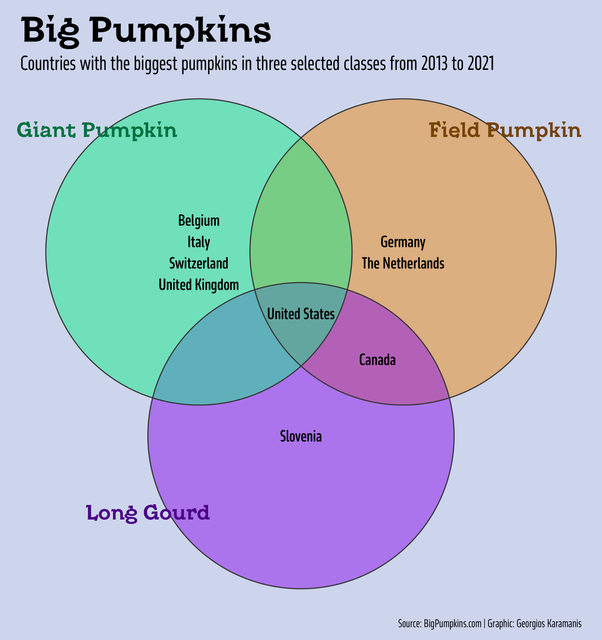 Giant pumpkins for this week’s #TidyTuesday. I decided to make a Venn diagram after seeing a tweet by Andy Kirk, tried 2-3 packages but in the end I
TidyTuesday 2021/41
October 12, 2021
R & Greece & seafood & Data Visualization
Seafood production in Greece for this week’s TidyTuesday. The inspiration for the plot was a data visualization from 1906 from this tweet. code and
TidyTuesday 2021/40
October 6, 2021
R & nurses & Data Visualization
Giant pumpkins for this week’s #TidyTuesday. I decided to make a Venn diagram after seeing a tweet by Andy Kirk, tried 2-3 packages but in the end I
TidyTuesday 2021/41
October 12, 2021
R & Greece & seafood & Data Visualization
Seafood production in Greece for this week’s TidyTuesday. The inspiration for the plot was a data visualization from 1906 from this tweet. code and
TidyTuesday 2021/40
October 6, 2021
R & nurses & Data Visualization
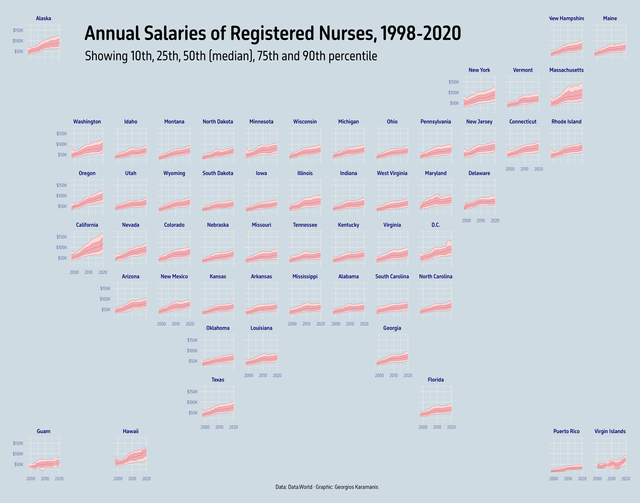 For this week’s #TidyTuesday I used {ggfan} to show the median salaries (and other percentiles) of US registered nurses from 1998 to 2020. [ ](The
TidyTuesday 2021/39
October 4, 2021
R & papers & NBER & Data Visualization
For last week’s #TidyTuesday I combined two plots (actually three with the legend) showing the number and proportion of papers distributed by NBER
TidyTuesday 2021/37
September 17, 2021
Spotify & music & Billboard & R & code & Data Visualization
For this week’s #TidyTuesday I used {ggfan} to show the median salaries (and other percentiles) of US registered nurses from 1998 to 2020. [ ](The
TidyTuesday 2021/39
October 4, 2021
R & papers & NBER & Data Visualization
For last week’s #TidyTuesday I combined two plots (actually three with the legend) showing the number and proportion of papers distributed by NBER
TidyTuesday 2021/37
September 17, 2021
Spotify & music & Billboard & R & code & Data Visualization
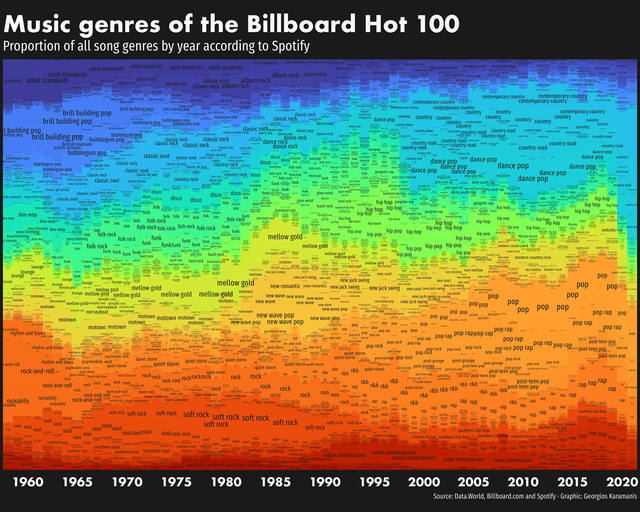 Spotify music genres of the Billboard Hot 100 for this week’s #TidyTuesday. Code and big image on GitHub
TidyTuesday 2021/36
September 10, 2021
Formula 1 & R & plot & Data Visualization
Spotify music genres of the Billboard Hot 100 for this week’s #TidyTuesday. Code and big image on GitHub
TidyTuesday 2021/36
September 10, 2021
Formula 1 & R & plot & Data Visualization
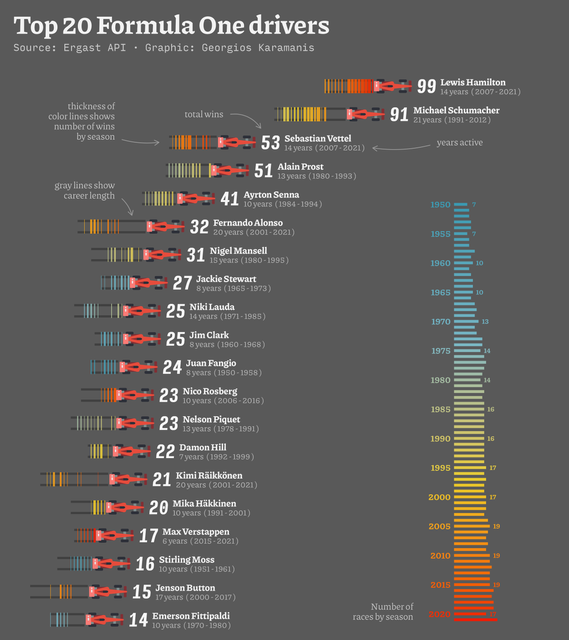 Top 20 Formula 1 drivers by total wins for this week’s #TidyTuesday code on GitHub
TidyTuesday 2021/35
September 3, 2021
birds & Australia & plot & R & Data Visualization
Top 20 Formula 1 drivers by total wins for this week’s #TidyTuesday code on GitHub
TidyTuesday 2021/35
September 3, 2021
birds & Australia & plot & R & Data Visualization
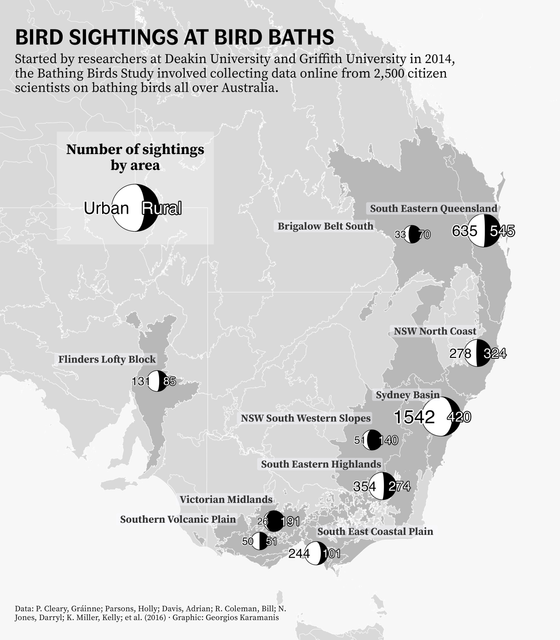 Bird sightings at Australian bird baths for this week’s #TidyTuesday. I really liked the grayscale look while I was working with the map and decided
TidyTuesday 2021/34
August 29, 2021
R & lemurs & plot & Data Visualization
Bird sightings at Australian bird baths for this week’s #TidyTuesday. I really liked the grayscale look while I was working with the map and decided
TidyTuesday 2021/34
August 29, 2021
R & lemurs & plot & Data Visualization
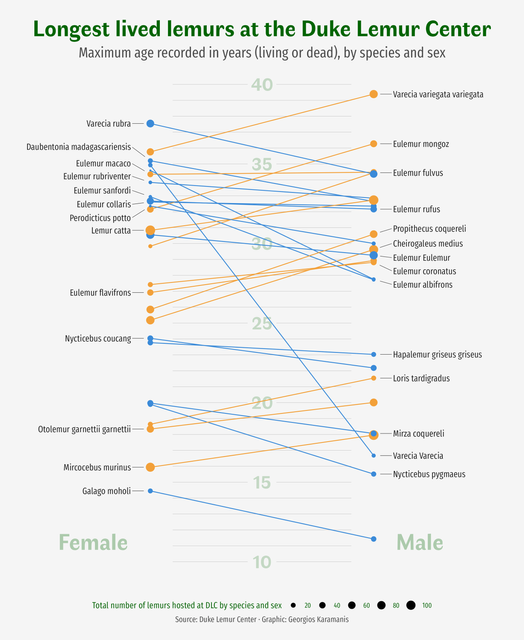 For this week’s #TidyTuesday I plotted the maximum age of all the lemurs hosted at the Duke Lemur Center by species and sex. code on GitHub
TidyTuesday 2021/33
August 22, 2021
Star Trek & R & letters & Data Visualization
For this week’s #TidyTuesday I plotted the maximum age of all the lemurs hosted at the Duke Lemur Center by species and sex. code on GitHub
TidyTuesday 2021/33
August 22, 2021
Star Trek & R & letters & Data Visualization
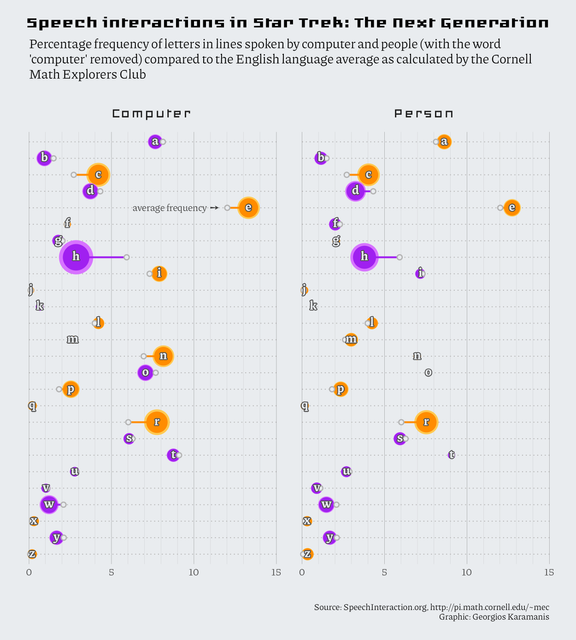 Speech interactions in Star Trek TNG for this week’s #TidyTuesday. I plotted the letter frequencies for lines spoken by computer and people compared
TidyTuesday 2021/32
August 15, 2021
R & plot & infrastructure & Data Visualization
Speech interactions in Star Trek TNG for this week’s #TidyTuesday. I plotted the letter frequencies for lines spoken by computer and people compared
TidyTuesday 2021/32
August 15, 2021
R & plot & infrastructure & Data Visualization
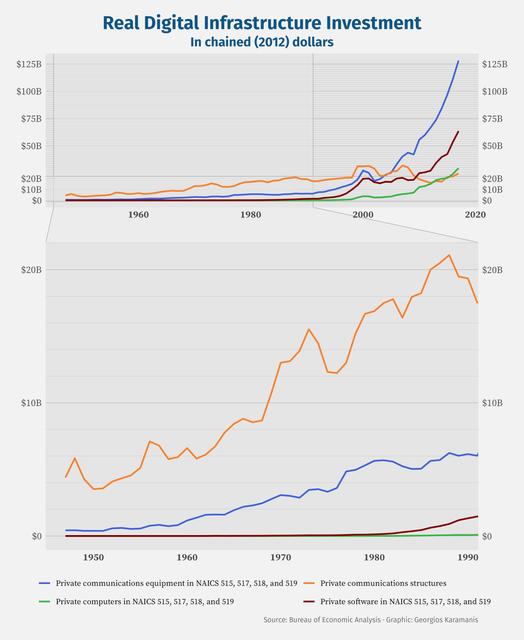 A relatively quick plot for this #TidyTuesday. I started by recreating chart 14 in the BEA Working Paper but then I thought to try facet_zoom of
TidyTuesday 2021/31
August 11, 2021
R & Paralympics & medals & Greece & Data Visualization
A relatively quick plot for this #TidyTuesday. I started by recreating chart 14 in the BEA Working Paper but then I thought to try facet_zoom of
TidyTuesday 2021/31
August 11, 2021
R & Paralympics & medals & Greece & Data Visualization
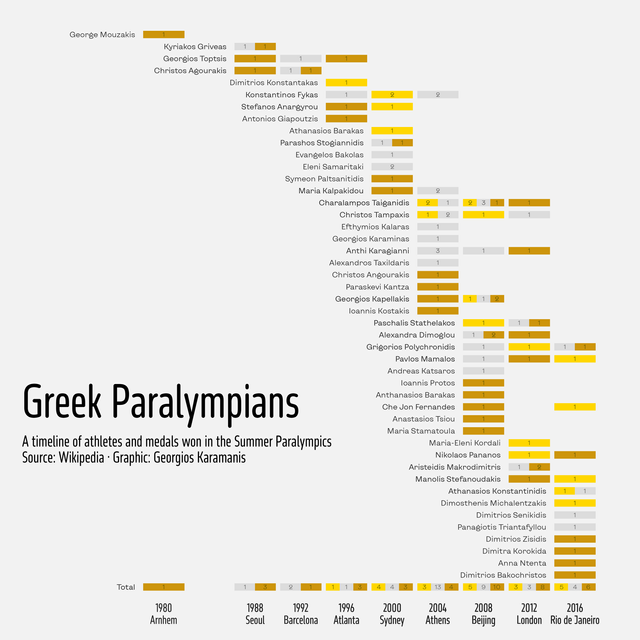 A timeline of the Greek athletes that have won a medal in the Summer Paralympics for last week’s #TidyTuesday. code on GitHub
TidyTuesday 2021/30
August 1, 2021
Olympic games & weight & BMI & R & Data Visualization
A timeline of the Greek athletes that have won a medal in the Summer Paralympics for last week’s #TidyTuesday. code on GitHub
TidyTuesday 2021/30
August 1, 2021
Olympic games & weight & BMI & R & Data Visualization
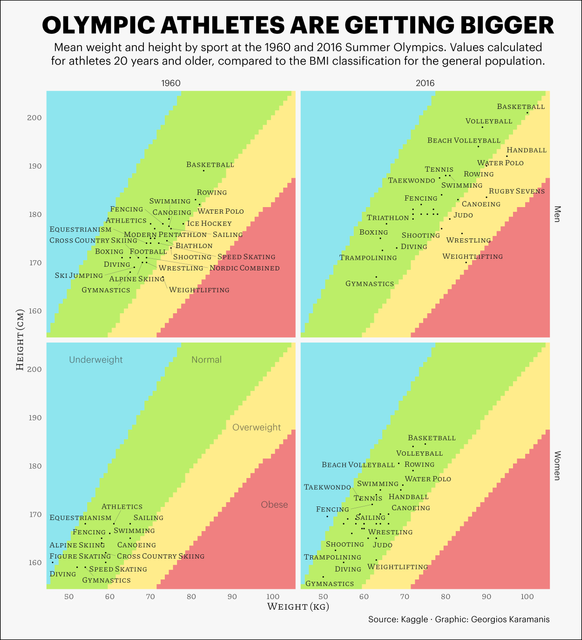 Evolution of olympic athletes’ weight and height from 1960 to 2016 for this week’s #TidyTuesday. Inspiration and reading about the limitations of
TidyTuesday 2021/29
July 26, 2021
R & drought & US & Data Visualization
Evolution of olympic athletes’ weight and height from 1960 to 2016 for this week’s #TidyTuesday. Inspiration and reading about the limitations of
TidyTuesday 2021/29
July 26, 2021
R & drought & US & Data Visualization
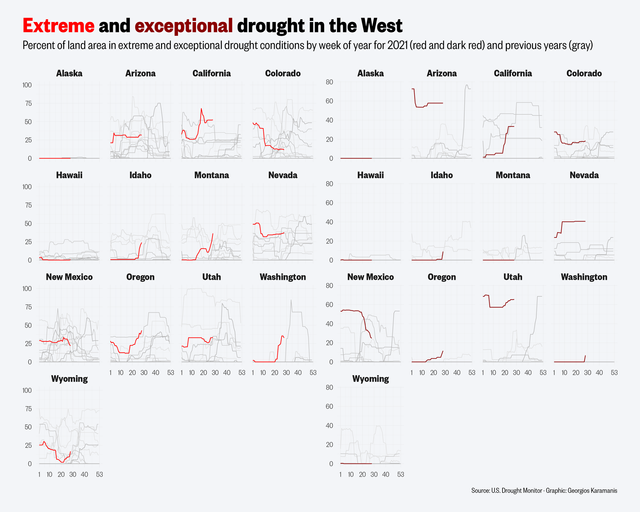 Extreme and exceptional drought in the West US for this week’s #TidyTuesday, comparing 2021 to previous years. Data from @DroughtCenter code:
TidyTuesday 2021/28
July 22, 2021
R & Scooby-Doo & Data Visualization
Extreme and exceptional drought in the West US for this week’s #TidyTuesday, comparing 2021 to previous years. Data from @DroughtCenter code:
TidyTuesday 2021/28
July 22, 2021
R & Scooby-Doo & Data Visualization
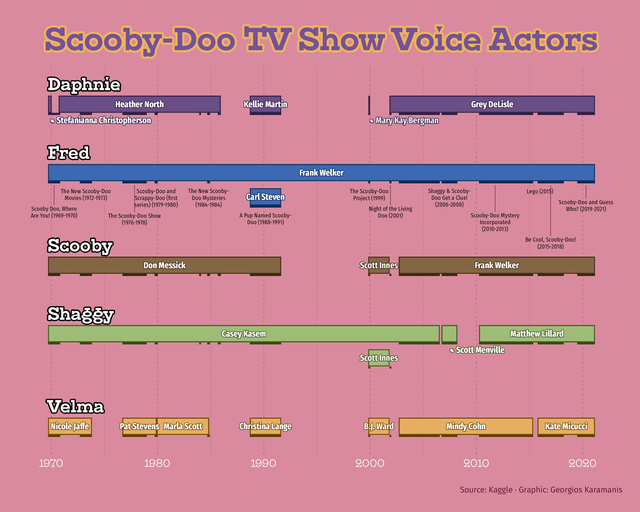 Timeline of the voice actors for the main characters of the Scooby-doo TV show (series and extras) for last week’s #TidyTuesday. code:
TidyTuesday 2021/27
July 11, 2021
TidyTuesday & R & Data Visualization
Timeline of the voice actors for the main characters of the Scooby-doo TV show (series and extras) for last week’s #TidyTuesday. code:
TidyTuesday 2021/27
July 11, 2021
TidyTuesday & R & Data Visualization
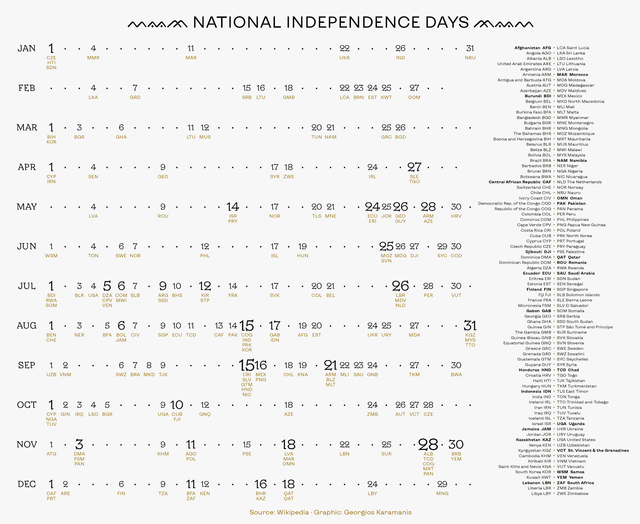 A text-heavy plot for this week’s #TidyTuesday, showing the distribution of national independence days by month and day of month R code:
TidyTuesday 2021/26
July 3, 2021
R & cats & fire brigade & Data Visualization
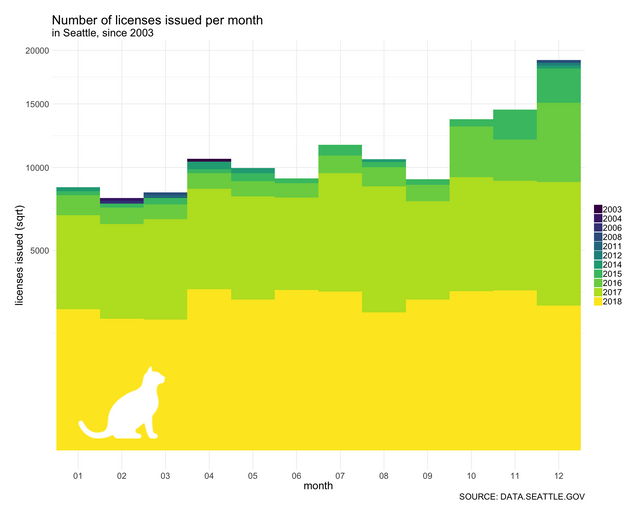
A text-heavy plot for this week’s #TidyTuesday, showing the distribution of national independence days by month and day of month R code:
TidyTuesday 2021/26
July 3, 2021
R & cats & fire brigade & Data Visualization
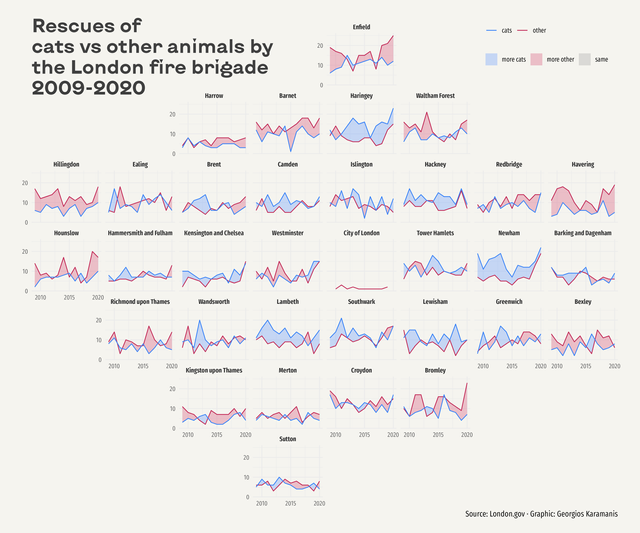 Rescues of cats vs other animals by the London fire brigade for this week’s #TidyTuesday. Used stat_difference() of the ggh4x package for the first
TidyTuesday 2021/25
June 27, 2021
R & parks & dataviz & Data Visualization
Rescues of cats vs other animals by the London fire brigade for this week’s #TidyTuesday. Used stat_difference() of the ggh4x package for the first
TidyTuesday 2021/25
June 27, 2021
R & parks & dataviz & Data Visualization
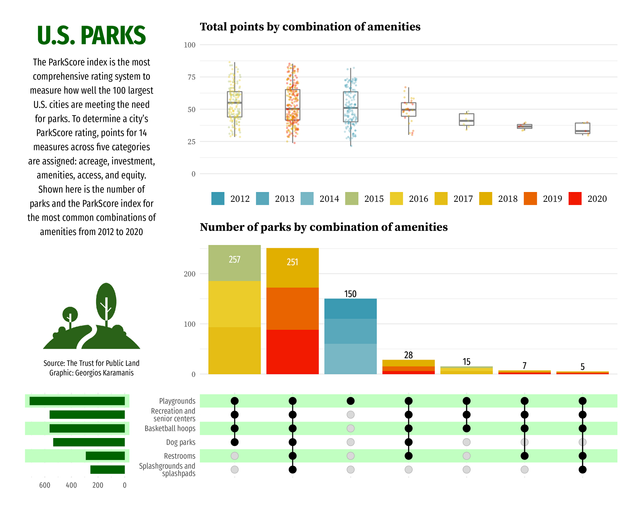 For this week’s #TidyTuesday I used the ComplexUpset package to plot the most common combinations of park amenities from 2018 to 2020, according to
All the blend modes of blend_with()
June 21, 2021
R & dataviz & Data Visualization
For this week’s #TidyTuesday I used the ComplexUpset package to plot the most common combinations of park amenities from 2018 to 2020, according to
All the blend modes of blend_with()
June 21, 2021
R & dataviz & Data Visualization
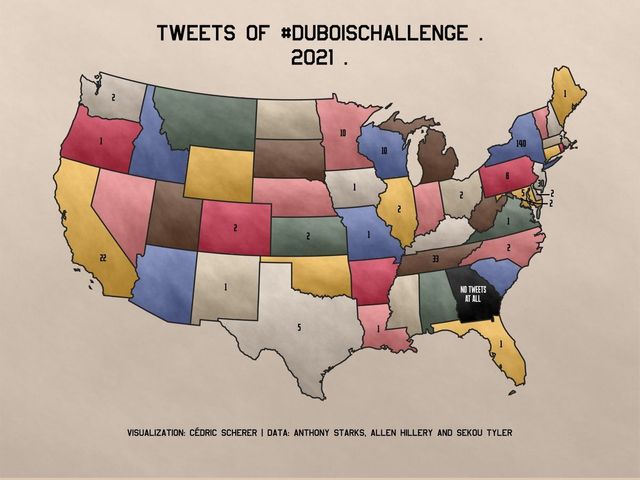 Cédric and I had a little chat when he was making his #DuBoisChallenge map (tweet) and wanted a hand-painted effect for the fill color. My
Commercial Fishing plot breakdown
June 17, 2021
dataviz & tutorial & R & Data Visualization
Cédric and I had a little chat when he was making his #DuBoisChallenge map (tweet) and wanted a hand-painted effect for the fill color. My
Commercial Fishing plot breakdown
June 17, 2021
dataviz & tutorial & R & Data Visualization
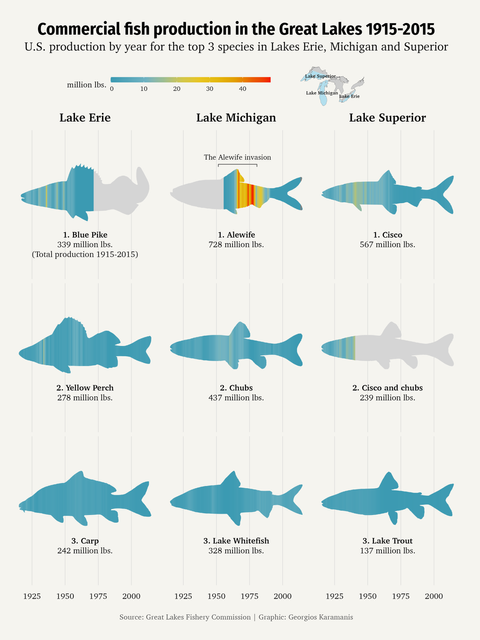 This post is not really a tutorial but more of a visual breakdown of the Commercial Fishing plot I did for last week’s TidyTuesday. The image below
TidyTuesday 2021/24
June 16, 2021
R & dataviz & DuBois & TidyTuesday & Data Visualization
This post is not really a tutorial but more of a visual breakdown of the Commercial Fishing plot I did for last week’s TidyTuesday. The image below
TidyTuesday 2021/24
June 16, 2021
R & dataviz & DuBois & TidyTuesday & Data Visualization
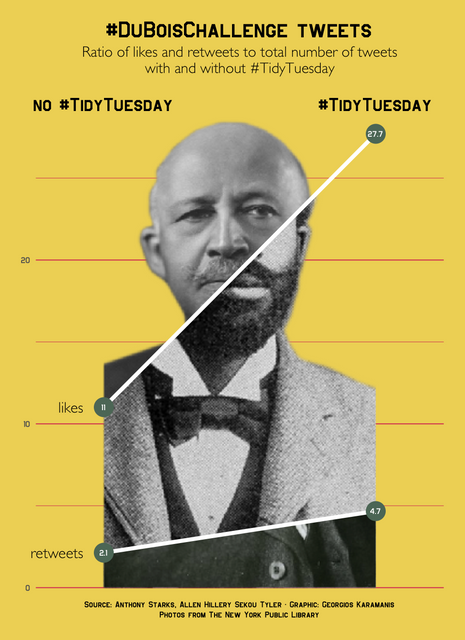 For this #TidyTuesday I was once again inspired by Gabrielle Merite’s (website, Twitter) work, as seen on the Data Viz Today Podcast. I looked at
TidyTuesday 2021/23
June 9, 2021
R & fishing & plot & Data Visualization
For this #TidyTuesday I was once again inspired by Gabrielle Merite’s (website, Twitter) work, as seen on the Data Viz Today Podcast. I looked at
TidyTuesday 2021/23
June 9, 2021
R & fishing & plot & Data Visualization
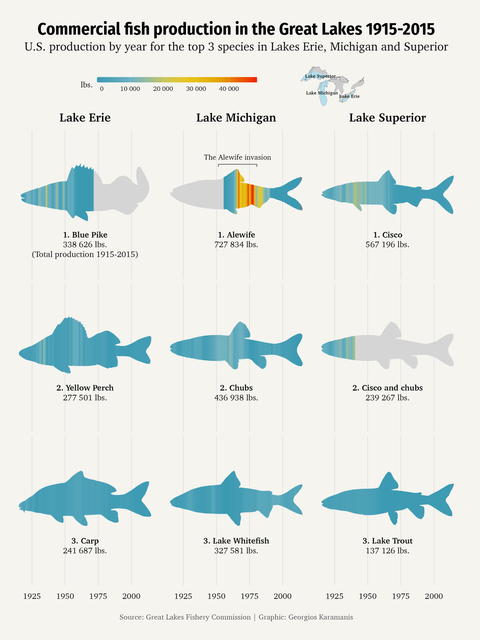 Commercial fish catch data for 3 of the Big Lakes with data by @LampreyControl for this week’s #TidyTuesday. Used, among others, {ggfx} with
#genuary 2021
February 5, 2021
art & R & genuary & Art
Commercial fish catch data for 3 of the Big Lakes with data by @LampreyControl for this week’s #TidyTuesday. Used, among others, {ggfx} with
#genuary 2021
February 5, 2021
art & R & genuary & Art
 This year was the first #genuary. It was really fun, I did more plots than I expected and learned a lot! All the plots were made in R, the code for
Top 30 downloaded CRAN packages crossword puzzle
December 20, 2020
R & crossword
Crossword puzzle with the top 30 downloaded CRAN packages for the month 20 November - 20 December 2020. Crossword Puzzle Maker
ggplot crossword puzzle
December 13, 2020
crossword & R
Crossword puzzle with ggplot2 functions. For the answers, omit the geom_ part and the parentheses () Crossword Puzzle Maker
dplyr crossword
December 6, 2020
R & crossword
Crossword puzzle with dplyr functions. No parentheses needed but underscores are OK! Crossword Puzzle Maker
Mobile R setup
August 20, 2020
R
This is a little post about how I use R when I want to make changes in my code or test things and can’t sit in front of a big screen. I have
tidytuesday 2020⁄32
August 8, 2020
R & plot & energy & Data Visualization
This year was the first #genuary. It was really fun, I did more plots than I expected and learned a lot! All the plots were made in R, the code for
Top 30 downloaded CRAN packages crossword puzzle
December 20, 2020
R & crossword
Crossword puzzle with the top 30 downloaded CRAN packages for the month 20 November - 20 December 2020. Crossword Puzzle Maker
ggplot crossword puzzle
December 13, 2020
crossword & R
Crossword puzzle with ggplot2 functions. For the answers, omit the geom_ part and the parentheses () Crossword Puzzle Maker
dplyr crossword
December 6, 2020
R & crossword
Crossword puzzle with dplyr functions. No parentheses needed but underscores are OK! Crossword Puzzle Maker
Mobile R setup
August 20, 2020
R
This is a little post about how I use R when I want to make changes in my code or test things and can’t sit in front of a big screen. I have
tidytuesday 2020⁄32
August 8, 2020
R & plot & energy & Data Visualization
 European energy for this week’s #TidyTuesday code: https://github.com/gkaramanis/tidytuesday/tree/master/2020-week32
tidytuesday 2020⁄31
July 29, 2020
R & penguins & plot & Data Visualization
European energy for this week’s #TidyTuesday code: https://github.com/gkaramanis/tidytuesday/tree/master/2020-week32
tidytuesday 2020⁄31
July 29, 2020
R & penguins & plot & Data Visualization
 Palmer penguins for #TidyTuesday, happy to get the penguins almost right with geom_bspline_closed() from {ggforce} 😊 code:
How I make the “Making of” videos
July 7, 2020
R & making of
Palmer penguins for #TidyTuesday, happy to get the penguins almost right with geom_bspline_closed() from {ggforce} 😊 code:
How I make the “Making of” videos
July 7, 2020
R & making of
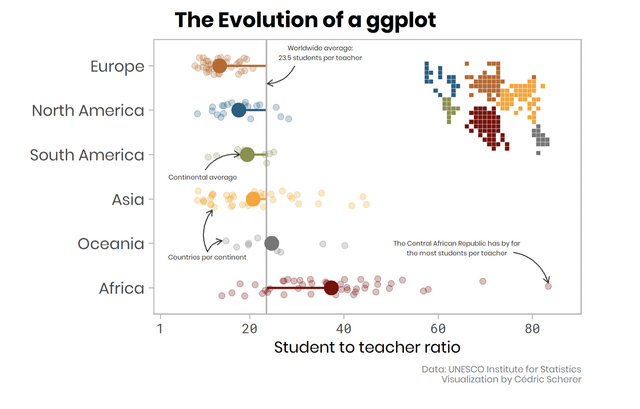 I came across the idea when I saw Cédric’s gif in his tutorial The Evolution of a ggplot (Ep. 1). I was already saving lots of plots, in order to
tidytuesday 2020⁄09
February 29, 2020
TidyTuesday & R & dataviz
I came across the idea when I saw Cédric’s gif in his tutorial The Evolution of a ggplot (Ep. 1). I was already saving lots of plots, in order to
tidytuesday 2020⁄09
February 29, 2020
TidyTuesday & R & dataviz
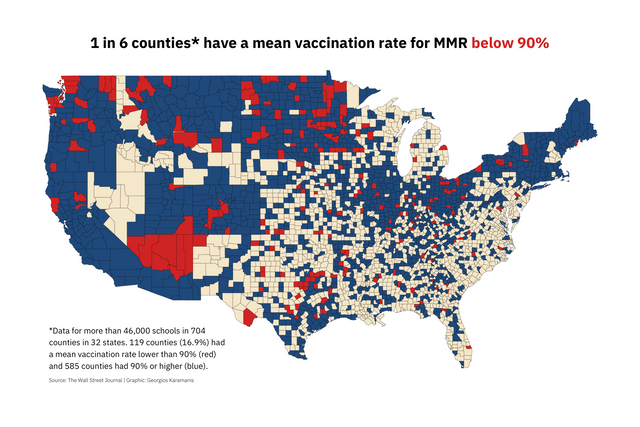 U.S. Measles Vaccination Data for #TidyTuesday, trying a map of counties with high/low vaccination rates code:
tidytuesday
February 21, 2020
food & footprint & co2 & R & Data Visualization
U.S. Measles Vaccination Data for #TidyTuesday, trying a map of counties with high/low vaccination rates code:
tidytuesday
February 21, 2020
food & footprint & co2 & R & Data Visualization
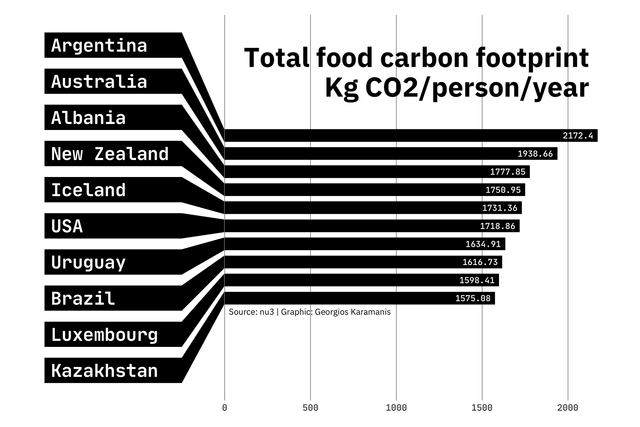 Food carbon footprint for this #TidyTuesday. I saw something and I wanted to replicate it with ggplot, I didn’t stop to think if I should. code:
tidytuesday
February 15, 2020
hotels & plot & R & Data Visualization
Food carbon footprint for this #TidyTuesday. I saw something and I wanted to replicate it with ggplot, I didn’t stop to think if I should. code:
tidytuesday
February 15, 2020
hotels & plot & R & Data Visualization
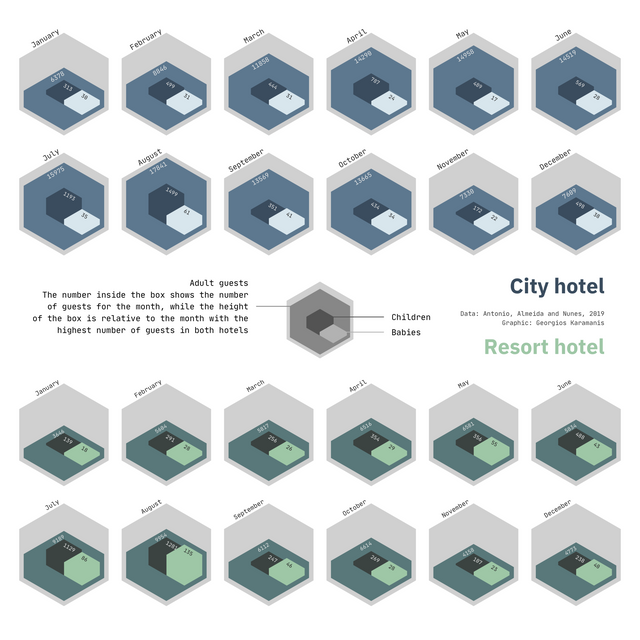 Hotels for this week’s #TidyTuesday. I had a lot of fun making the plot, many things I like and some that don’t work as well, so I’ll just leave
tidytuesday
February 2, 2020
trees & San Francisco & plot & R & Data Visualization
Hotels for this week’s #TidyTuesday. I had a lot of fun making the plot, many things I like and some that don’t work as well, so I’ll just leave
tidytuesday
February 2, 2020
trees & San Francisco & plot & R & Data Visualization
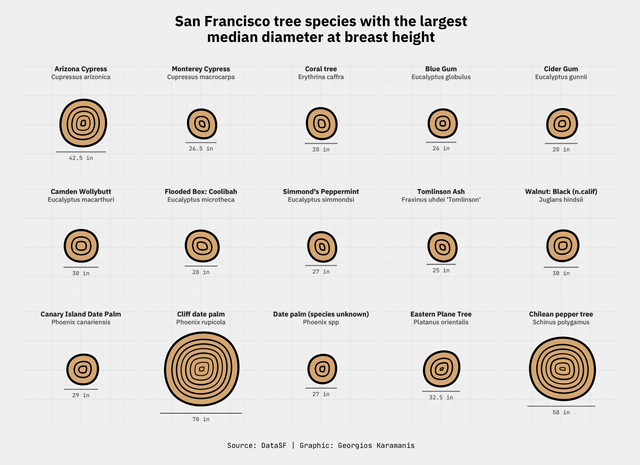 A quick plot for this week’s #TidyTuesday, looking at the streets with most trees, with the location of #rstudioconf for reference 😊 And another
tidytuesday
January 9, 2020
R & Australia & rainfall & plot & Data Visualization
A quick plot for this week’s #TidyTuesday, looking at the streets with most trees, with the location of #rstudioconf for reference 😊 And another
tidytuesday
January 9, 2020
R & Australia & rainfall & plot & Data Visualization
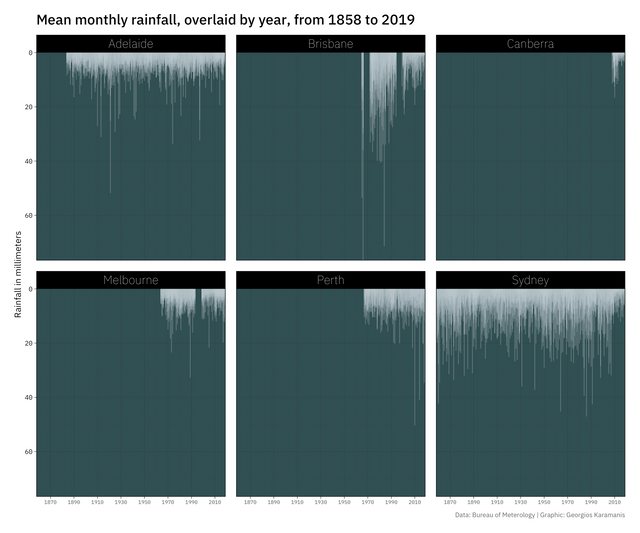 Plotting rainfall in Australia for this week’s #TidyTuesday. code: https://github.com/gkaramanis/tidytuesday/tree/master/2020-week02
tidytuesday
December 27, 2019
R & Christmas & plot & Data Visualization
Plotting rainfall in Australia for this week’s #TidyTuesday. code: https://github.com/gkaramanis/tidytuesday/tree/master/2020-week02
tidytuesday
December 27, 2019
R & Christmas & plot & Data Visualization
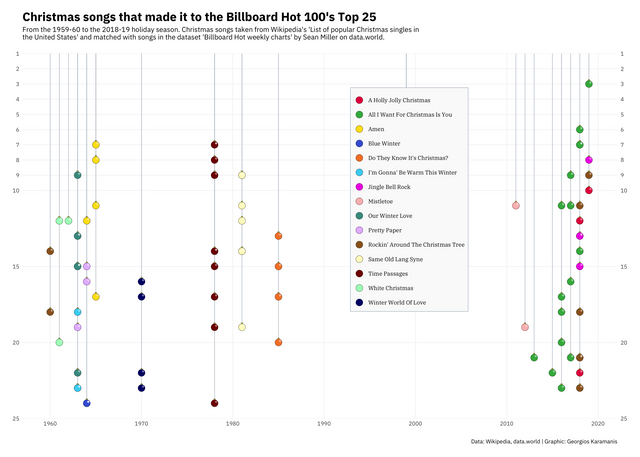 For this #TidyTuesday I made my own (and a little different) dataset from Wikipedia and the updated Billboard dataset by @HipsterVizNinja. The
tidytuesday
August 3, 2019
video games & plot & R & Code
For this #TidyTuesday I made my own (and a little different) dataset from Wikipedia and the updated Billboard dataset by @HipsterVizNinja. The
tidytuesday
August 3, 2019
video games & plot & R & Code
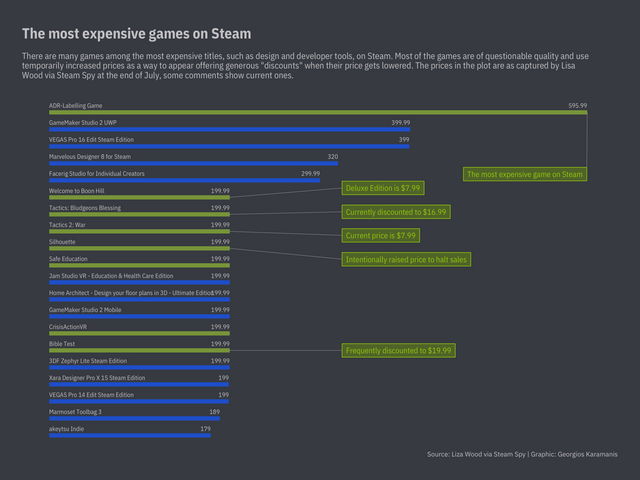 @steam_games for this week’s #TidyTuesday, dataset by @brightcdns via @Steam_Spy. I looked at the most expensive titles and found among the design
tidytuesday
July 29, 2019
R & plot & airplane & wildlife & Code
@steam_games for this week’s #TidyTuesday, dataset by @brightcdns via @Steam_Spy. I looked at the most expensive titles and found among the design
tidytuesday
July 29, 2019
R & plot & airplane & wildlife & Code
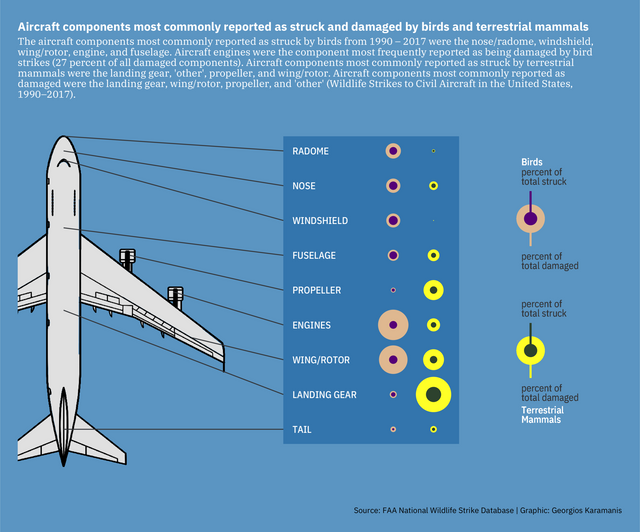 #TidyTuesday and I look at aircraft components reported as struck/damaged by wildlife (data is from the FAA report and not the dataset). Not happy
tidytuesday
July 15, 2019
football & plot & R & WWC & Code
#TidyTuesday and I look at aircraft components reported as struck/damaged by wildlife (data is from the FAA report and not the dataset). Not happy
tidytuesday
July 15, 2019
football & plot & R & WWC & Code
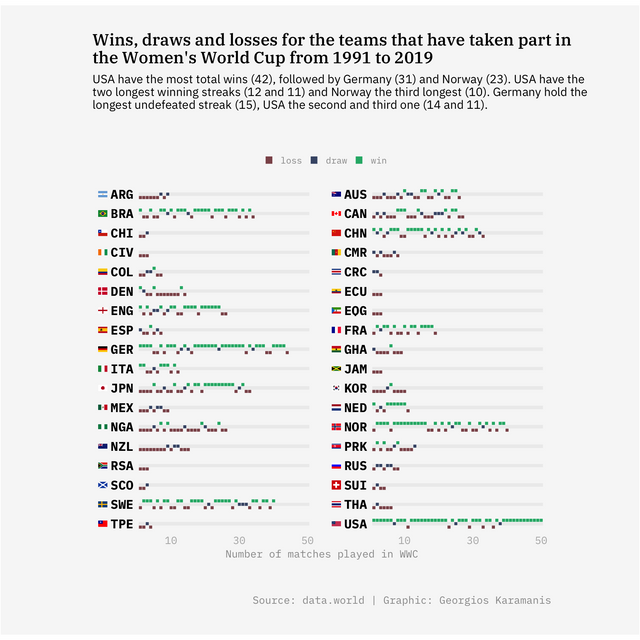 Trying win-loss sparklines for #TidyTuesday, quite happy with the result code: https://github.com/gkaramanis/tidytuesday/blob/master/week-28
#tidytuesday
July 5, 2019
media & R & plot & video games & Code
Trying win-loss sparklines for #TidyTuesday, quite happy with the result code: https://github.com/gkaramanis/tidytuesday/blob/master/week-28
#tidytuesday
July 5, 2019
media & R & plot & video games & Code
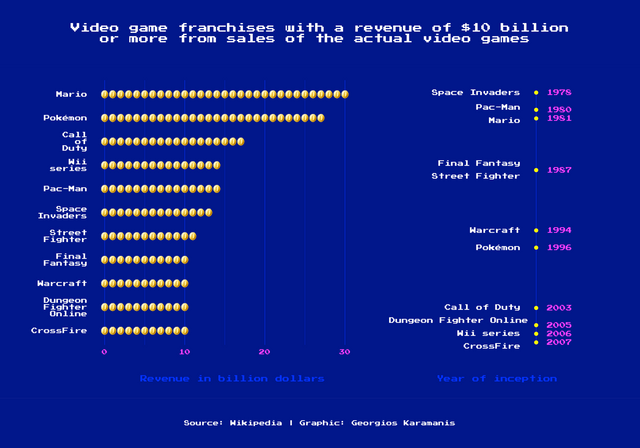 #TidyTuesday and I looked at video games franchises and revenue just from the actual video games: Second submission for this week’s #TidyTuesday,
#tidytuesday
June 25, 2019
UFO & R & plot & aliens & Code
#TidyTuesday and I looked at video games franchises and revenue just from the actual video games: Second submission for this week’s #TidyTuesday,
#tidytuesday
June 25, 2019
UFO & R & plot & aliens & Code
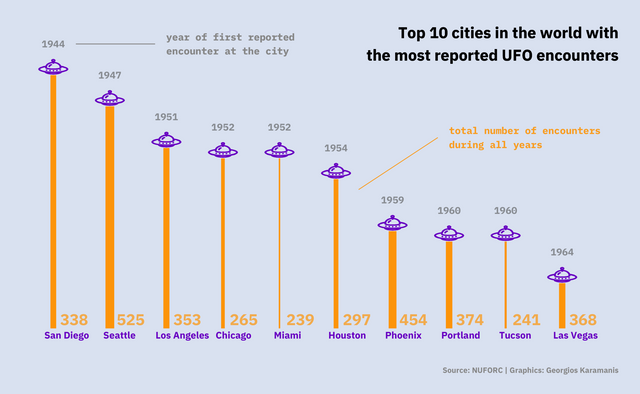 UFO sightings for #TidyTuesday and I look at the top 10 cities in the world with the most reported encounters (all in the US). I didn’t do any data
#tidytuesday
June 19, 2019
birds & R & plot & Code
UFO sightings for #TidyTuesday and I look at the top 10 cities in the world with the most reported encounters (all in the US). I didn’t do any data
#tidytuesday
June 19, 2019
birds & R & plot & Code
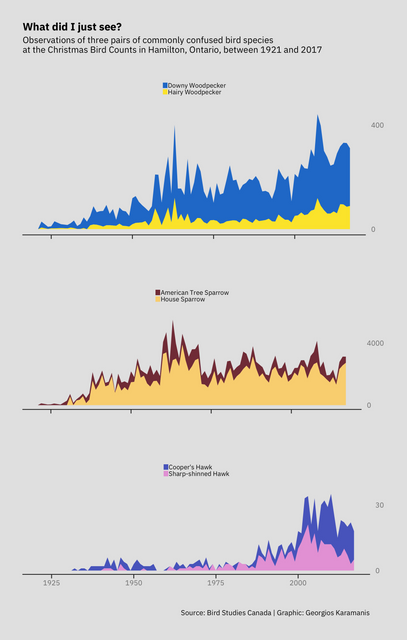 Christmas Bird Counts for #TidyTuesday and I looked at easily-confused birds according to Mass Audubon I don’t know a thing about birds, so… 🤷🏽♀️
#tidytuesday
June 15, 2019
R & plot & Code
Christmas Bird Counts for #TidyTuesday and I looked at easily-confused birds according to Mass Audubon I don’t know a thing about birds, so… 🤷🏽♀️
#tidytuesday
June 15, 2019
R & plot & Code
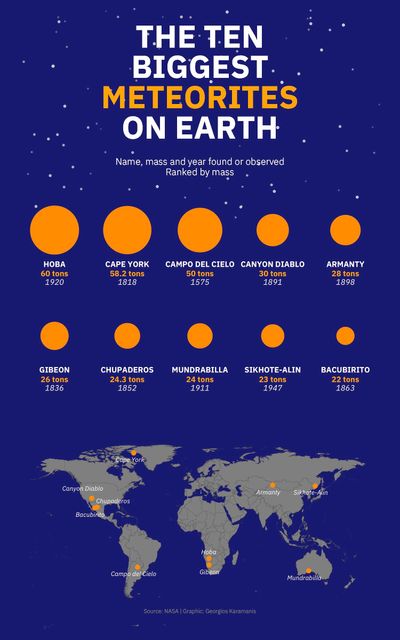 Meteorites for #TidyTuesday. Abandoned a couple of too ambitious attempts and found inspiration at
#SWDchallenge
June 9, 2019
R & plot & apple & Code
Meteorites for #TidyTuesday. Abandoned a couple of too ambitious attempts and found inspiration at
#SWDchallenge
June 9, 2019
R & plot & apple & Code
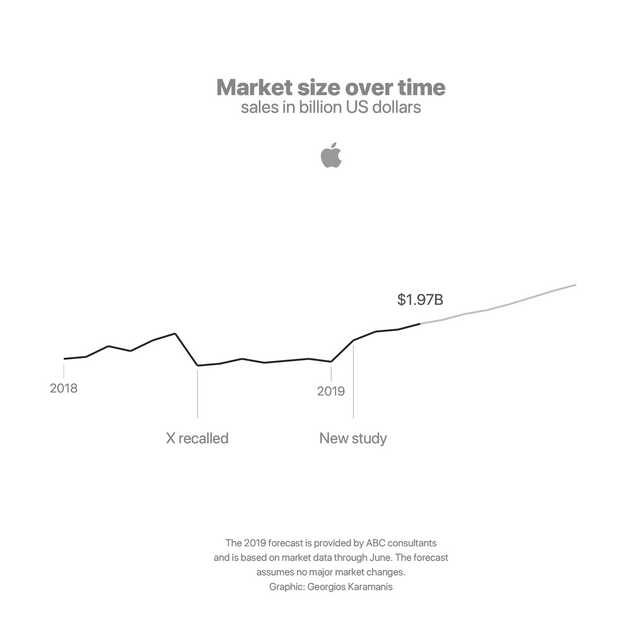 First #SWDchallenge submission ever. Went for a minimalist, monochrome plot with lots of white space and as little text as possible and an @Apple
#tidytuesday
June 5, 2019
ramen & noodles & plot & R & Code
First #SWDchallenge submission ever. Went for a minimalist, monochrome plot with lots of white space and as little text as possible and an @Apple
#tidytuesday
June 5, 2019
ramen & noodles & plot & R & Code
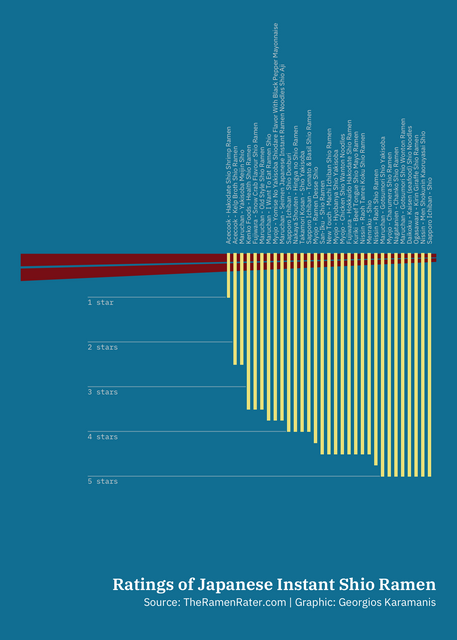 Instant ramen reviews by @theramenrater for #TidyTuesday. Good luck reading the text, but couldn’t help it, it was too much fun making this plot!
#tidytuesday
June 1, 2019
wine & R & food & plot & Code
Instant ramen reviews by @theramenrater for #TidyTuesday. Good luck reading the text, but couldn’t help it, it was too much fun making this plot!
#tidytuesday
June 1, 2019
wine & R & food & plot & Code
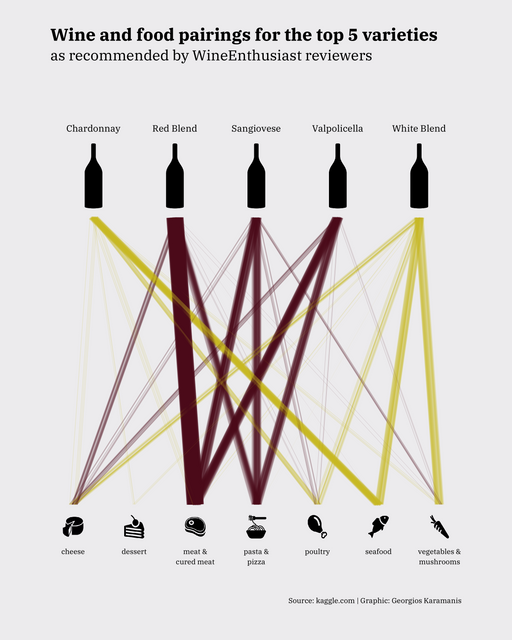 #TidyTuesday! Food pairings for the top 5 varieties, as recommended by reviewers. I don’t like the lines in the plot but couldn’t find anything
#tidytuesday
May 24, 2019
R & plastic & waste & plot & Code
#TidyTuesday! Food pairings for the top 5 varieties, as recommended by reviewers. I don’t like the lines in the plot but couldn’t find anything
#tidytuesday
May 24, 2019
R & plastic & waste & plot & Code
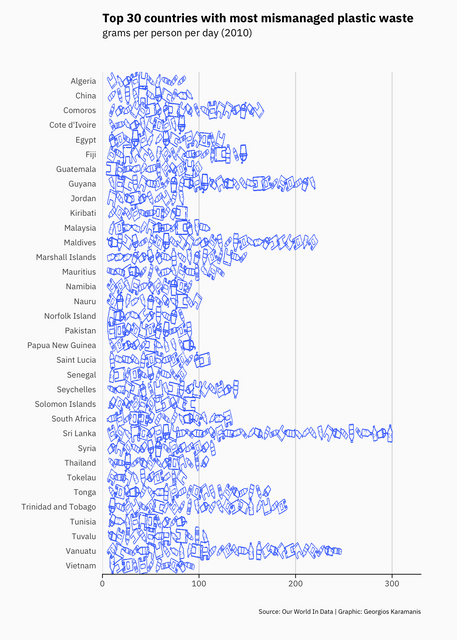 A plot about Global Plastic Waste for this week’s #TidyTuesday. I sacrificed accuracy for looks and I liked it :) code
#tidytuesday
May 19, 2019
Nobel & R & plot & Code
A plot about Global Plastic Waste for this week’s #TidyTuesday. I sacrificed accuracy for looks and I liked it :) code
#tidytuesday
May 19, 2019
Nobel & R & plot & Code
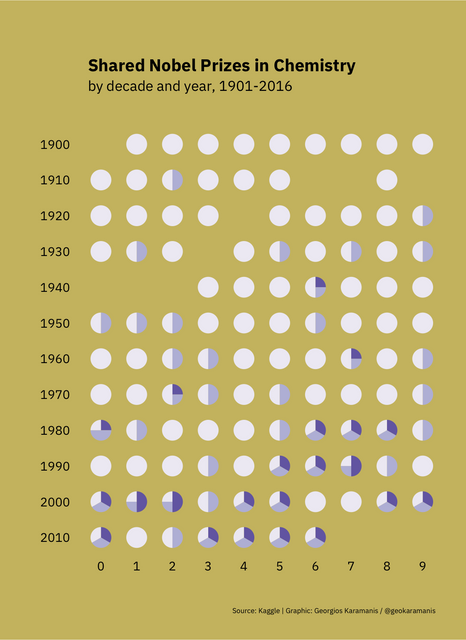 Third and last submission for #NobelPrize #TidyTuesday. Looked at shared prizes across the 6 categories, really like the result. Inspired by
#tidytuesday
May 17, 2019
Nobel & R & plot & Code
Third and last submission for #NobelPrize #TidyTuesday. Looked at shared prizes across the 6 categories, really like the result. Inspired by
#tidytuesday
May 17, 2019
Nobel & R & plot & Code
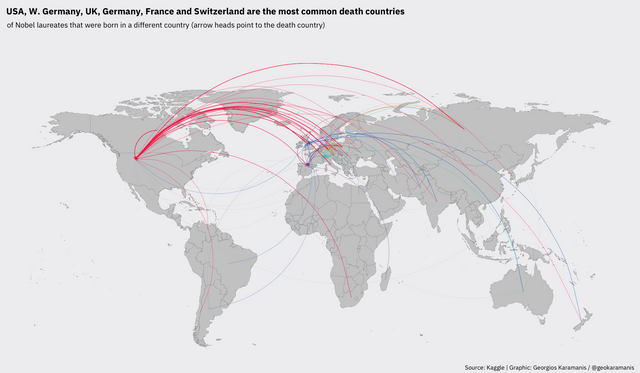 A second submission for the #Nobelprize #TidyTuesday! The same data as the first one but this time on a world map. code:
#tidytuesday
May 14, 2019
Nobel & R & plot & Code
A second submission for the #Nobelprize #TidyTuesday! The same data as the first one but this time on a world map. code:
#tidytuesday
May 14, 2019
Nobel & R & plot & Code
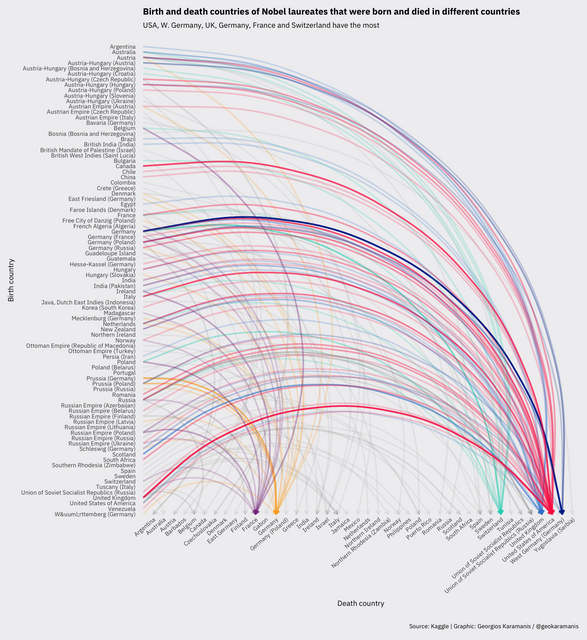 #NobelPrize winners for this week’s #TidyTuesday, I looked at birth and death countries. I liked the way the plot turned out, but too much text…
#tidytuesday
May 9, 2019
R & plot & education & Code
#NobelPrize winners for this week’s #TidyTuesday, I looked at birth and death countries. I liked the way the plot turned out, but too much text…
#tidytuesday
May 9, 2019
R & plot & education & Code
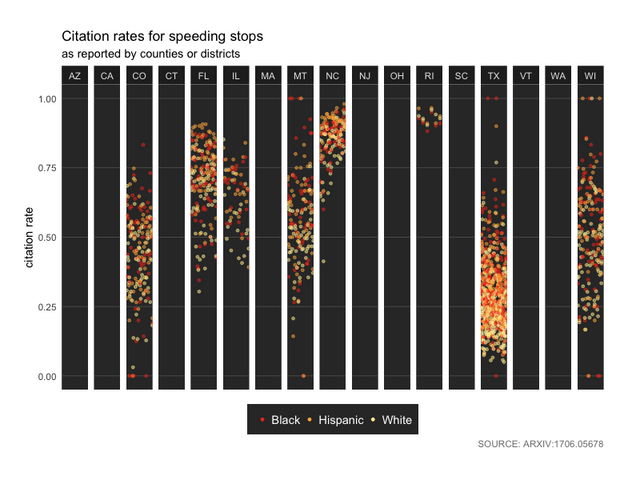
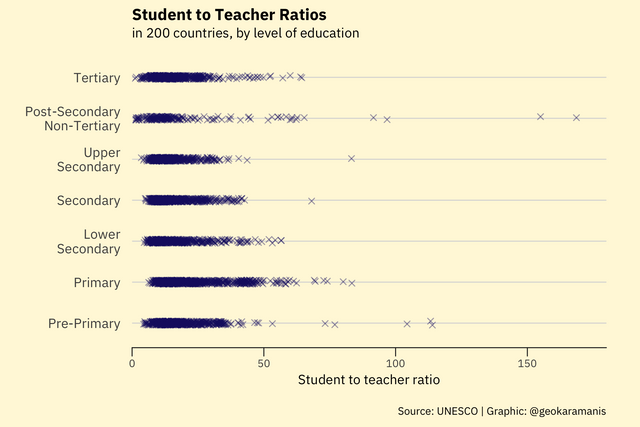 A #TidyTuesday submission, trying to visualize the distributions of the ratios but probably a not very informative plot 🤷🏽♀️ code:
#tidytuesday
May 4, 2019
R & plot & Chicago & birds & collision & Code
A #TidyTuesday submission, trying to visualize the distributions of the ratios but probably a not very informative plot 🤷🏽♀️ code:
#tidytuesday
May 4, 2019
R & plot & Chicago & birds & collision & Code
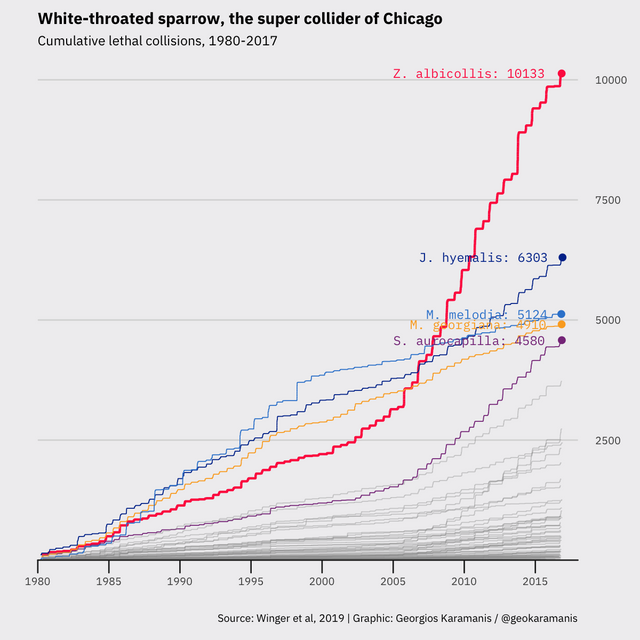 Chicago Bird Collisions for #TidyTuesday. I was close to giving up, but @thomas_mock’s Grand Slam plot saved the day and I learned a ton! code:
#tidytuesday
April 23, 2019
anime & plot & R & Code
Chicago Bird Collisions for #TidyTuesday. I was close to giving up, but @thomas_mock’s Grand Slam plot saved the day and I learned a ton! code:
#tidytuesday
April 23, 2019
anime & plot & R & Code
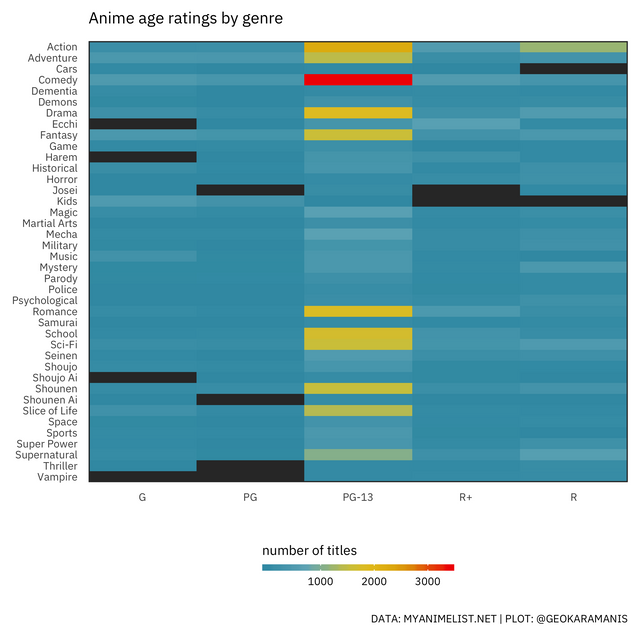 #TidyTuesday submission, a plot of #Anime age ratings by genre. Seems that there a lot of PG-13 titles and especially in the comedy genre. Also, no
#tidytuesday
April 19, 2019
R & plot & economy & Code
#TidyTuesday submission, a plot of #Anime age ratings by genre. Seems that there a lot of PG-13 titles and especially in the comedy genre. Also, no
#tidytuesday
April 19, 2019
R & plot & economy & Code
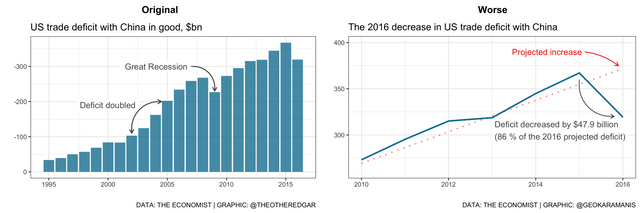 For this week’s #TidyTuesday I wanted to make an aesthetically pleasing but intentionally misleading plot, starting from someone else’s good one.
#tidytuesday
April 14, 2019
Grand Slam & plot & tennis & R & Code
For this week’s #TidyTuesday I wanted to make an aesthetically pleasing but intentionally misleading plot, starting from someone else’s good one.
#tidytuesday
April 14, 2019
Grand Slam & plot & tennis & R & Code
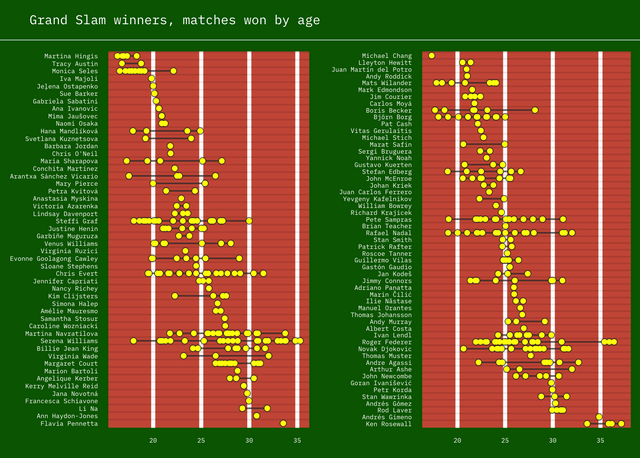
 Another one for this week’s Grand Slam #TidyTuesday. Totally inspired by @jakekaupp’s work. code:
#tidytuesday
April 10, 2019
tennis & plot & Grand Slam & R & Code
Another one for this week’s Grand Slam #TidyTuesday. Totally inspired by @jakekaupp’s work. code:
#tidytuesday
April 10, 2019
tennis & plot & Grand Slam & R & Code
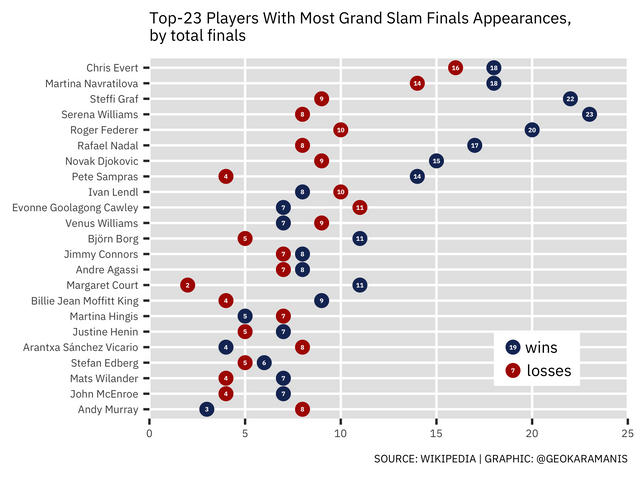
 Tennis Grand Slam winners for this week’s #TidyTuesday. The plot got a little messy with the text but I’m happy with the rest of it :) code:
#tidytuesday
April 5, 2019
bicycle & plot & R & Code
Tennis Grand Slam winners for this week’s #TidyTuesday. The plot got a little messy with the text but I’m happy with the rest of it :) code:
#tidytuesday
April 5, 2019
bicycle & plot & R & Code
 Late #TidyTuesday submission. code: https://github.com/gkaramanis/tidytuesday/tree/master/week%2014 … View fullsize
#tidytuesday
March 28, 2019
R & plot & cat & pets & Code
Late #TidyTuesday submission. code: https://github.com/gkaramanis/tidytuesday/tree/master/week%2014 … View fullsize
#tidytuesday
March 28, 2019
R & plot & cat & pets & Code
 Tried to do letter frequencies for this week’s #TidyTuesday but it proved to be too hard for a newbie! 🤷🏽♀️ So, I made a simpler one with an
#tidytuesday
March 20, 2019
R & plot & stats & Code
Tried to do letter frequencies for this week’s #TidyTuesday but it proved to be too hard for a newbie! 🤷🏽♀️ So, I made a simpler one with an
#tidytuesday
March 20, 2019
R & plot & stats & Code
 It’s #TidyTuesday again, trying a darker palette this time. code: https://github.com/gkaramanis/tidytuesday/tree/master/week%2012 … View fullsize
#tidytuesday
March 12, 2019
R & code & plot & board games & Code
It’s #TidyTuesday again, trying a darker palette this time. code: https://github.com/gkaramanis/tidytuesday/tree/master/week%2012 … View fullsize
#tidytuesday
March 12, 2019
R & code & plot & board games & Code
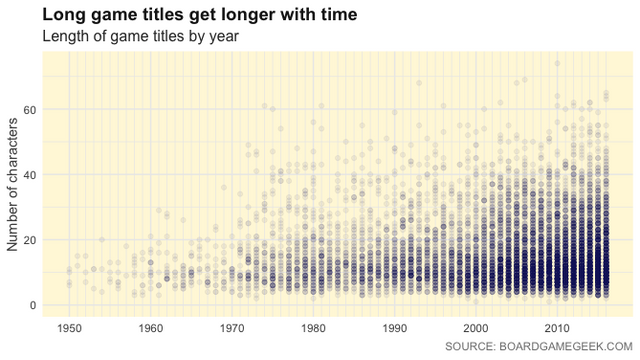 My second submission for #TidyTuesday. I’m quite happy with the plot, not so sure about the title and the “message”, any feedback is welcome! code:
#tidytuesday
March 6, 2019
R & plot & stats & women & Code
My second submission for #TidyTuesday. I’m quite happy with the plot, not so sure about the title and the “message”, any feedback is welcome! code:
#tidytuesday
March 6, 2019
R & plot & stats & women & Code
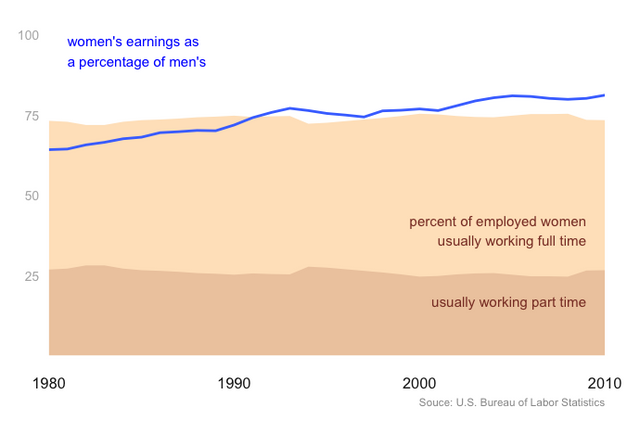 First submission ever for #tidytuesday. Spent too much time tweaking the graph but couldn’t help it! code: