How I make the “Making of” videos
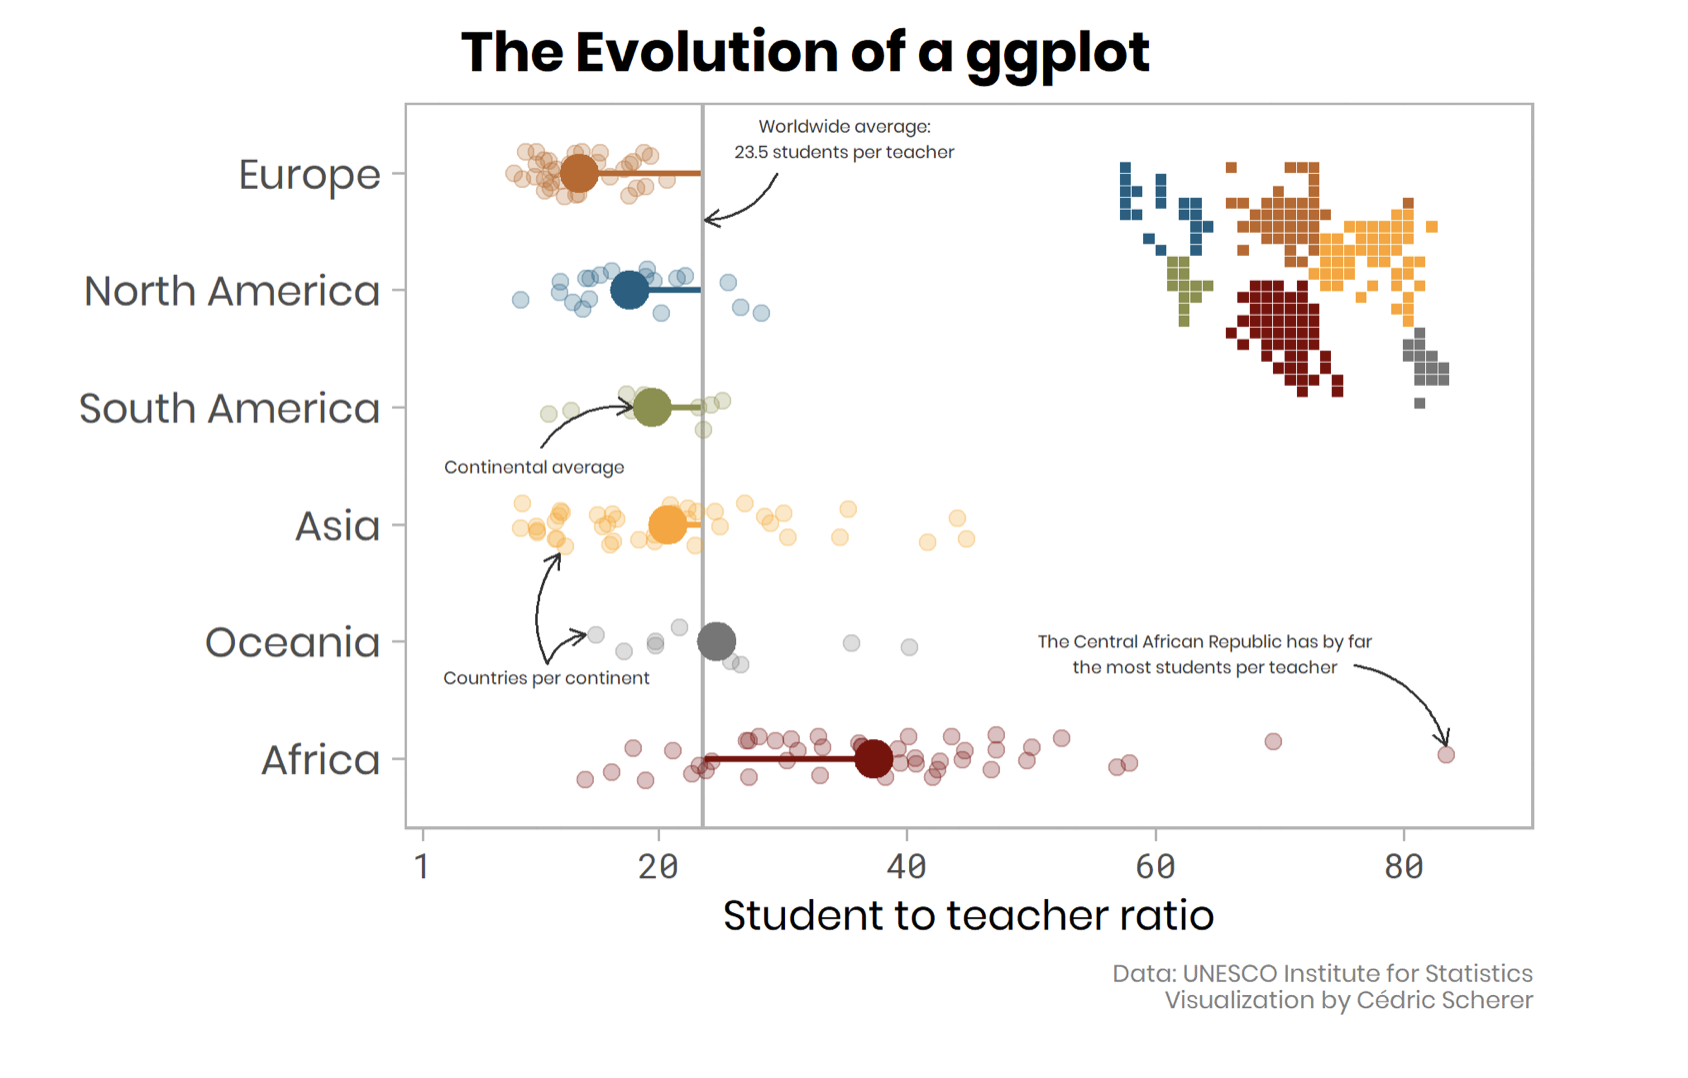
I came across the idea when I saw Cédric’s gif in his tutorial The Evolution of a ggplot (Ep. 1).
I was already saving lots of plots, in order to compare them when I changed or tried things, so I just added a couple of steps in the workflow.
I save every plot as a png with ggsave inside a temp folder, add timestamp in the filename for easier sorting:
ggsave(here::here("2020-week27", "plots", "temp",
    paste0("xmen-", format(Sys.time(), "%Y%m%d_%H%M%S"),
    ".png")), dpi = 320, width = 9, height = 9)
I resize the images in Terminal, with 1024 as the max width or height. I use sips that comes with MacOS:
sips -Z 1024 *.pngI stitch the images with Gif Brewery 3, set 2 seconds duration for the first frame and 3 seconds for the last one.
Jose used another approach by overwriting ggplot, read how here.
Below are a couple of my videos, you can watch more of them on this link.
#Makingof of this week’s plot for #TidyTuesday with @LeTour winners https://t.co/lnDoAs9nSz pic.twitter.com/pcfCw9v1DO
— Georgios Karamanis (@geokaramanis) April 9, 2020
#Makingof of this week’s plot for #TidyTuesday with @LeTour winners https://t.co/lnDoAs9nSz pic.twitter.com/pcfCw9v1DO
— Georgios Karamanis (@geokaramanis) April 9, 2020
#MakingOf of this week’s #TidyTuesday plot#Rstats https://t.co/iRsmFml35U pic.twitter.com/Mpy1GnE03Z
— Georgios Karamanis (@geokaramanis) July 3, 2020