TidyTuesday 2025/24
June 15, 2025
TidyTuesday & Dataviz & R & president & US & judges
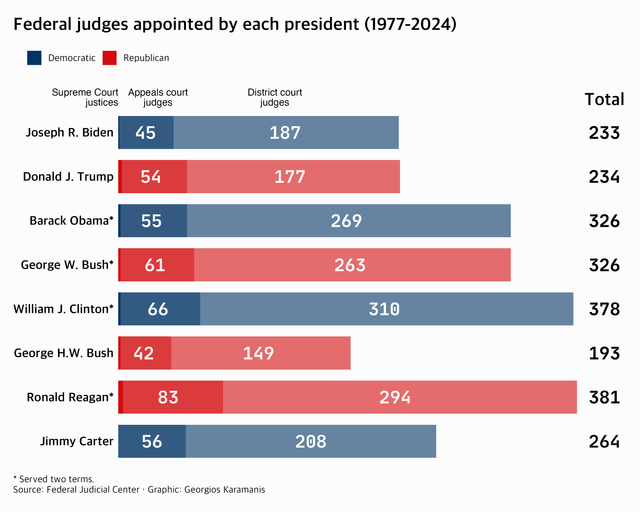 For this week’s #TidyTuesday I recreated two of the charts made by the Pew Research Center Code on GitHub
TidyTuesday 2025/17
April 27, 2025
TidyTuesday & R & DataViz & car accidents & USA
For this week’s #TidyTuesday I recreated two of the charts made by the Pew Research Center Code on GitHub
TidyTuesday 2025/17
April 27, 2025
TidyTuesday & R & DataViz & car accidents & USA
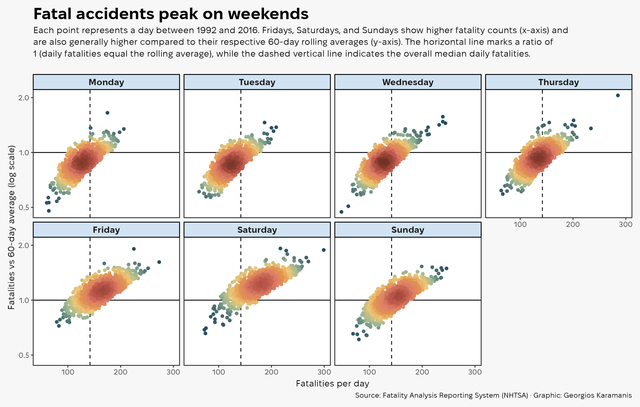 Daily road accidents for this week’s #TidyTuesday Code on GitHub
TidyTuesday 2025/16
April 19, 2025
TidyTuesday & penguins & R & dataviz & remake
Daily road accidents for this week’s #TidyTuesday Code on GitHub
TidyTuesday 2025/16
April 19, 2025
TidyTuesday & penguins & R & dataviz & remake
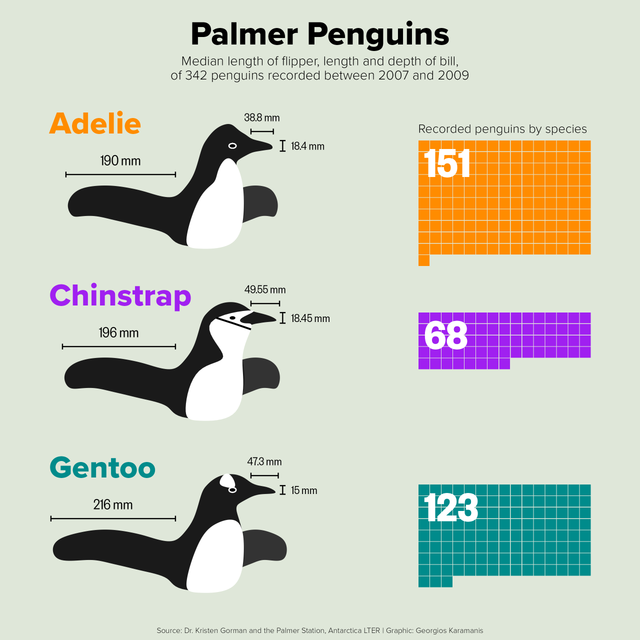 Palmer penguins for this week’s #TidyTuesday. A remake of the original plot, now with color Code on GitHub Original plot
Tallest buildings in Sweden
February 9, 2022
Sweden & buildings & dataviz & Data Visualization
Palmer penguins for this week’s #TidyTuesday. A remake of the original plot, now with color Code on GitHub Original plot
Tallest buildings in Sweden
February 9, 2022
Sweden & buildings & dataviz & Data Visualization
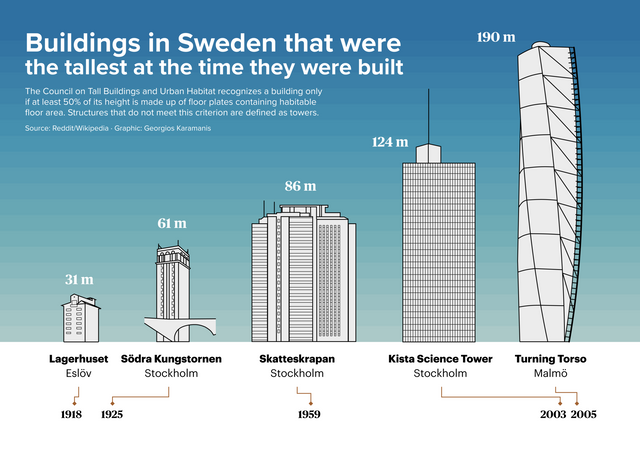 Wanted to try my hand at Figma, so I made this graphic about the tallest buildings in Sweden Idea from a post in r/Sweden
TidyTuesday 2021/25
June 27, 2021
R & parks & dataviz & Data Visualization
Wanted to try my hand at Figma, so I made this graphic about the tallest buildings in Sweden Idea from a post in r/Sweden
TidyTuesday 2021/25
June 27, 2021
R & parks & dataviz & Data Visualization
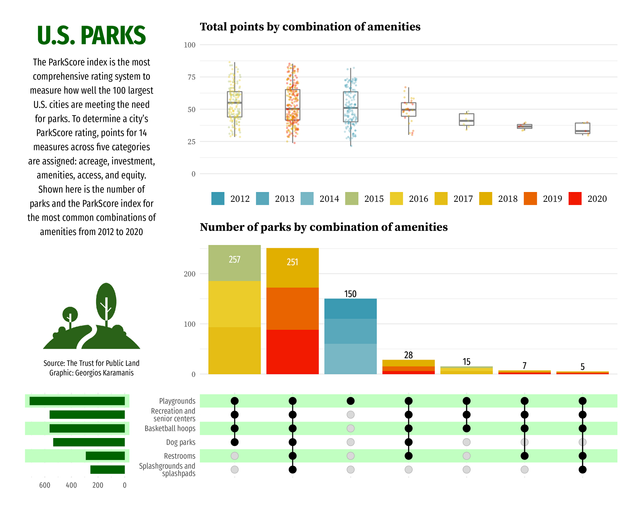 For this week’s #TidyTuesday I used the ComplexUpset package to plot the most common combinations of park amenities from 2018 to 2020, according to
All the blend modes of blend_with()
June 21, 2021
R & dataviz & Data Visualization
For this week’s #TidyTuesday I used the ComplexUpset package to plot the most common combinations of park amenities from 2018 to 2020, according to
All the blend modes of blend_with()
June 21, 2021
R & dataviz & Data Visualization
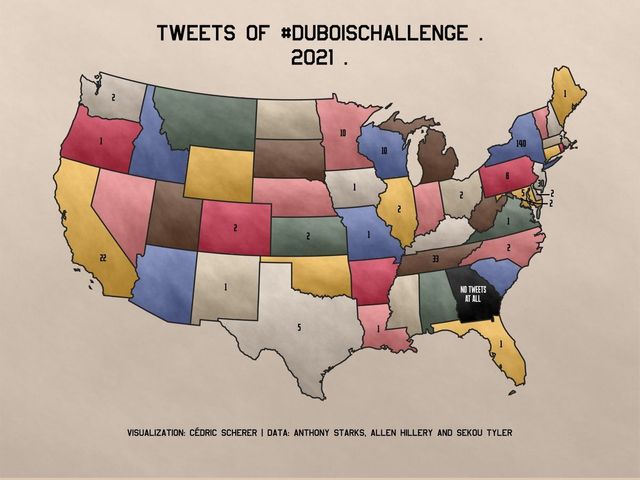 Cédric and I had a little chat when he was making his #DuBoisChallenge map (tweet) and wanted a hand-painted effect for the fill color. My
Commercial Fishing plot breakdown
June 17, 2021
dataviz & tutorial & R & Data Visualization
Cédric and I had a little chat when he was making his #DuBoisChallenge map (tweet) and wanted a hand-painted effect for the fill color. My
Commercial Fishing plot breakdown
June 17, 2021
dataviz & tutorial & R & Data Visualization
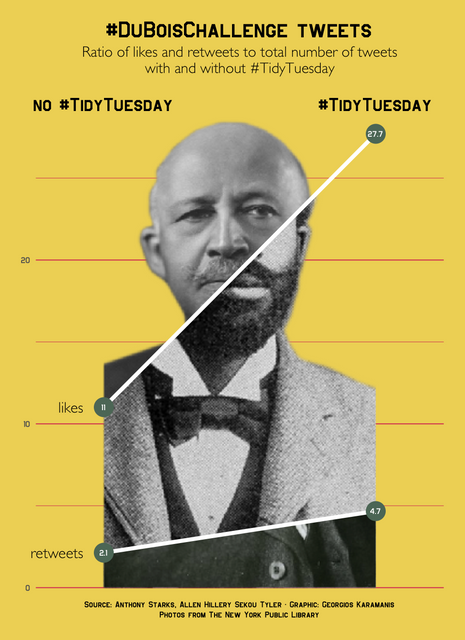
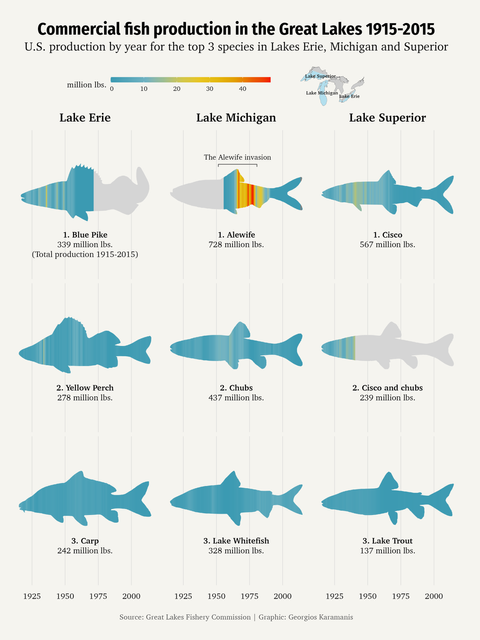 This post is not really a tutorial but more of a visual breakdown of the Commercial Fishing plot I did for last week’s TidyTuesday. The image below
TidyTuesday 2021/24
June 16, 2021
R & dataviz & DuBois & TidyTuesday & Data Visualization
This post is not really a tutorial but more of a visual breakdown of the Commercial Fishing plot I did for last week’s TidyTuesday. The image below
TidyTuesday 2021/24
June 16, 2021
R & dataviz & DuBois & TidyTuesday & Data Visualization
 For this #TidyTuesday I was once again inspired by Gabrielle Merite’s (website, Twitter) work, as seen on the Data Viz Today Podcast. I looked at
tidytuesday 2020⁄09
February 29, 2020
TidyTuesday & R & dataviz
For this #TidyTuesday I was once again inspired by Gabrielle Merite’s (website, Twitter) work, as seen on the Data Viz Today Podcast. I looked at
tidytuesday 2020⁄09
February 29, 2020
TidyTuesday & R & dataviz
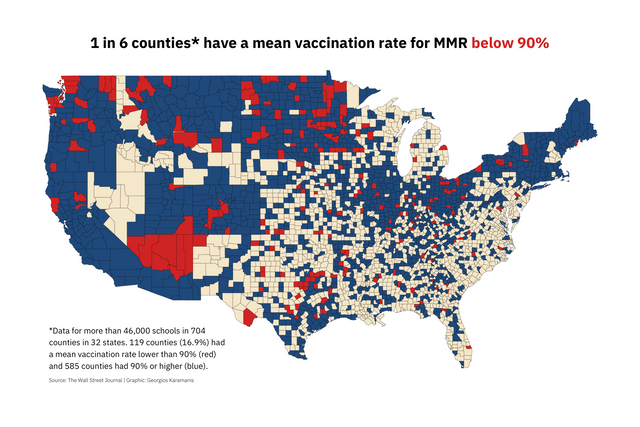 U.S. Measles Vaccination Data for #TidyTuesday, trying a map of counties with high/low vaccination rates code: