TidyTuesday 2023/33
August 20, 2023
spam & TidyTuesday & Data Visualization
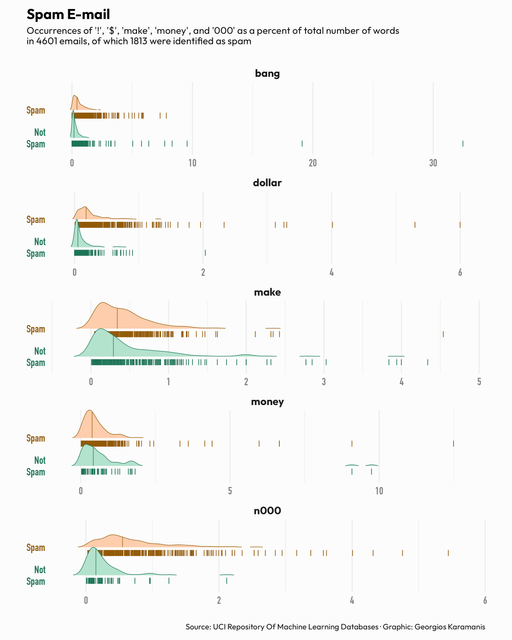 Spam email for this week’s #TidyTuesday Code on GitHub
MapPromptMonday 2023/30
August 14, 2023
Earth & MapPromptMonday & Data Visualization & Map
Spam email for this week’s #TidyTuesday Code on GitHub
MapPromptMonday 2023/30
August 14, 2023
Earth & MapPromptMonday & Data Visualization & Map
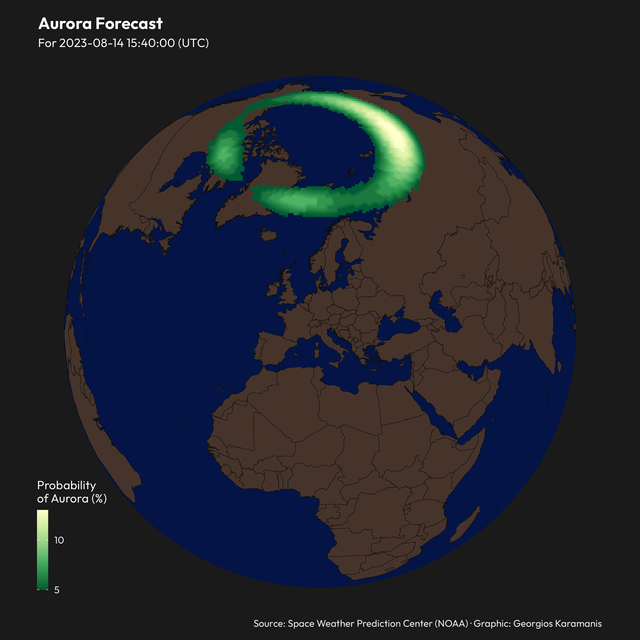 Aurora forecast for the week of July 24-30 of #MapPromptMonday, Natural Wonders Code on GitHub
TidyTuesday 2023/32
August 13, 2023
TV & TidyTuesday & Data Visualization
Aurora forecast for the week of July 24-30 of #MapPromptMonday, Natural Wonders Code on GitHub
TidyTuesday 2023/32
August 13, 2023
TV & TidyTuesday & Data Visualization
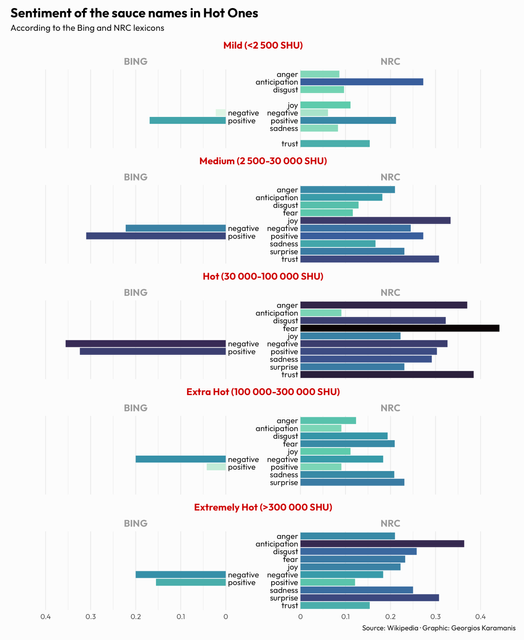 Sentiment of sauce names in Hot Ones for this week’s #TidyTuesday Code on GitHub
MapPromptMonday 2023/29
August 6, 2023
chocolate & Europe & map & MapPromptMonday & Data Visualization & Map
Sentiment of sauce names in Hot Ones for this week’s #TidyTuesday Code on GitHub
MapPromptMonday 2023/29
August 6, 2023
chocolate & Europe & map & MapPromptMonday & Data Visualization & Map
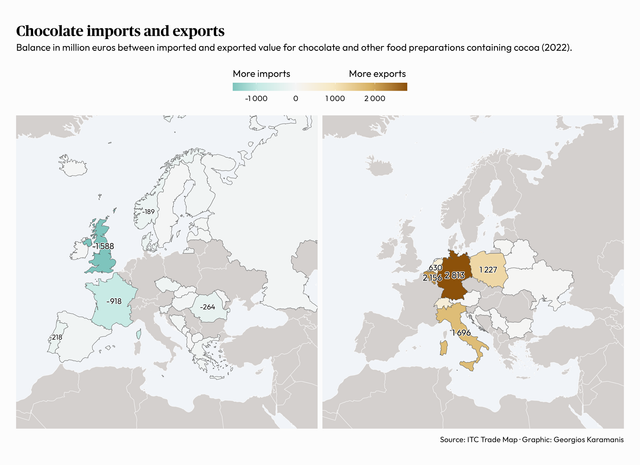 Chocolate trade balance for the week of July 17-23 of #MapPromptMonday, Desserts Code on GitHub
TidyTuesday 2023/31
August 2, 2023
US & states & distance & cities & TidyTuesday & map & Data Visualization & Map
Chocolate trade balance for the week of July 17-23 of #MapPromptMonday, Desserts Code on GitHub
TidyTuesday 2023/31
August 2, 2023
US & states & distance & cities & TidyTuesday & map & Data Visualization & Map
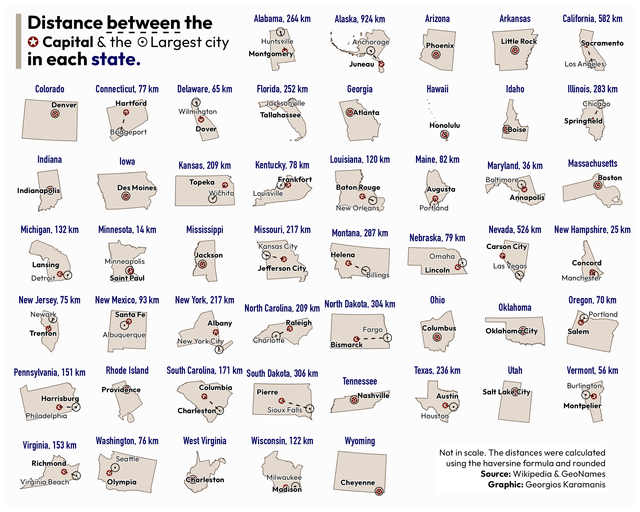 Distance between the capital and the largest city in each state for this week’s #TidyTuesday Code on GitHub
MapPromptMonday 2023/27
July 30, 2023
ice & Europe & MapPromptMonday & Data Visualization & Map
Distance between the capital and the largest city in each state for this week’s #TidyTuesday Code on GitHub
MapPromptMonday 2023/27
July 30, 2023
ice & Europe & MapPromptMonday & Data Visualization & Map
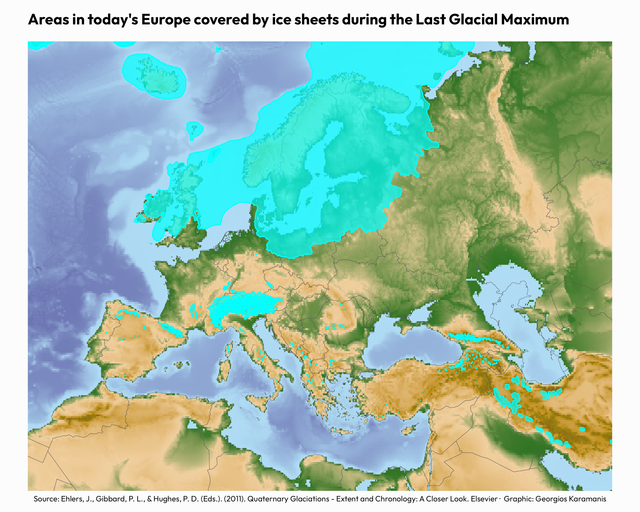 Areas in today’s Europe covered by ice during LGM for the week of 3-10 July of #MapPromptMonday, Snow or Ice Shapefiles for the ice sheets Code on
TidyTuesday 2023/30
July 25, 2023
scurvy & TidyTuesday & heatmap & Data Visualization
Areas in today’s Europe covered by ice during LGM for the week of 3-10 July of #MapPromptMonday, Snow or Ice Shapefiles for the ice sheets Code on
TidyTuesday 2023/30
July 25, 2023
scurvy & TidyTuesday & heatmap & Data Visualization
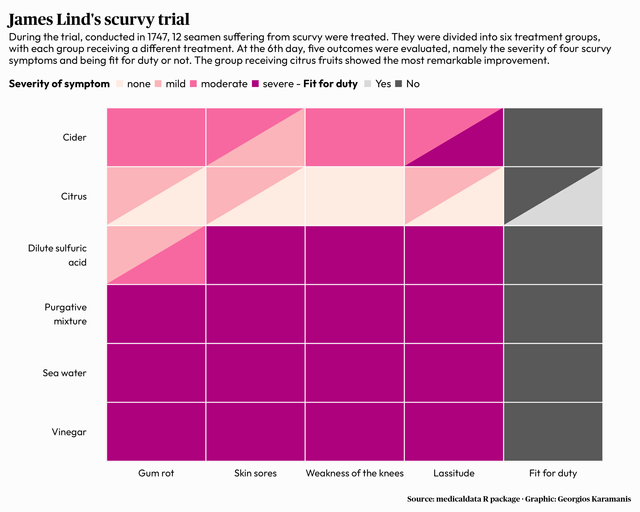 James Lind’s scurvy trial for this week’s #TidyTuesday Code on GitHub
MapPromptMonday 2023/26
July 23, 2023
cherry & map & europe & MapPromptMonday & Data Visualization & Map
James Lind’s scurvy trial for this week’s #TidyTuesday Code on GitHub
MapPromptMonday 2023/26
July 23, 2023
cherry & map & europe & MapPromptMonday & Data Visualization & Map
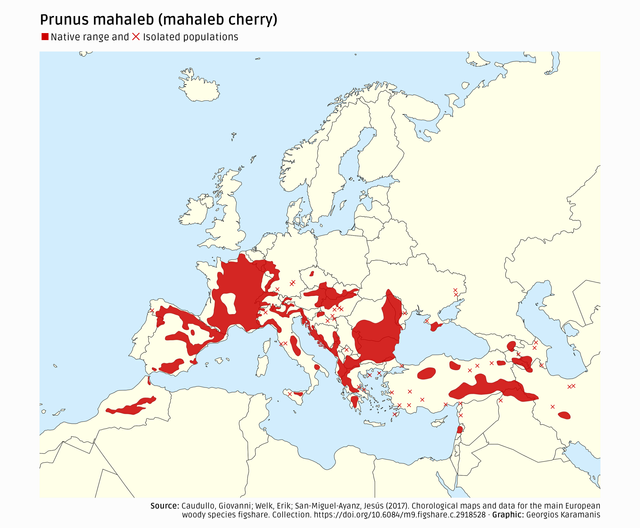 Distribution of the mahaleb cherry for the week of 26 June-2 July of #MapPromptMonday, Plants Code on GitHub
TidyTuesday 2023/29
July 21, 2023
GPT & distribution & probability & AI & TidyTuesday & Data Visualization
Distribution of the mahaleb cherry for the week of 26 June-2 July of #MapPromptMonday, Plants Code on GitHub
TidyTuesday 2023/29
July 21, 2023
GPT & distribution & probability & AI & TidyTuesday & Data Visualization
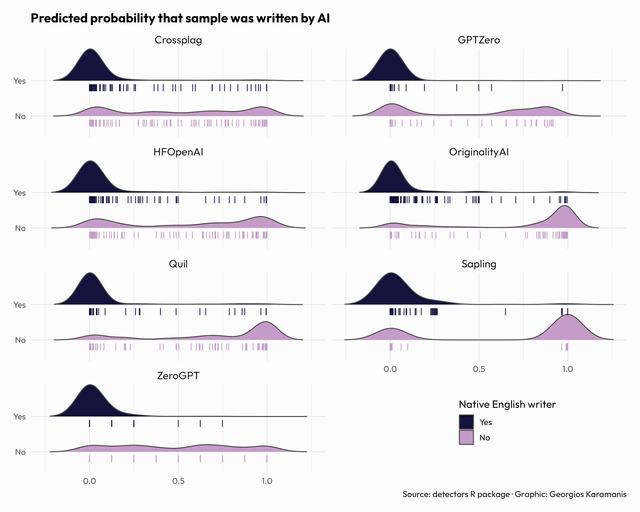 GPT detectors for this week’s #TidyTuesday. A different version of Simon’s plot Code on GitHub
TidyTuesday 2023/28
July 14, 2023
temperature & polar & TidyTuesday & Data Visualization
GPT detectors for this week’s #TidyTuesday. A different version of Simon’s plot Code on GitHub
TidyTuesday 2023/28
July 14, 2023
temperature & polar & TidyTuesday & Data Visualization
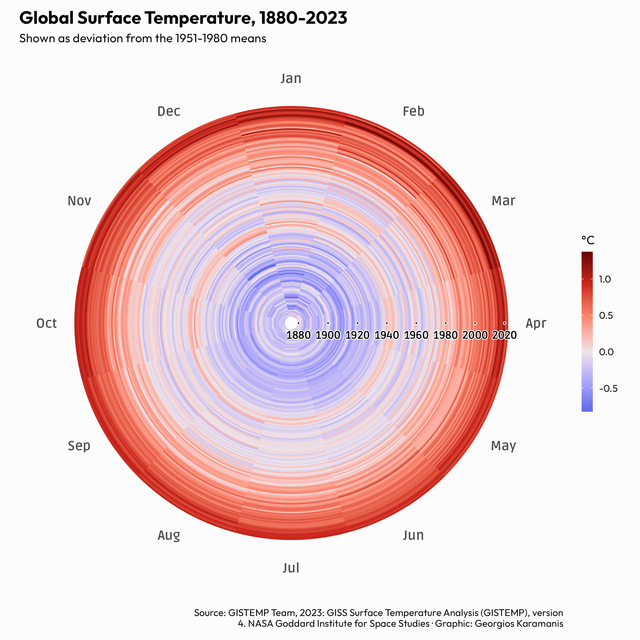 Global surface temperature for this week’s #TidyTuesday Code on GitHub
Next page
Global surface temperature for this week’s #TidyTuesday Code on GitHub
Next page