TidyTuesday 2023/17
April 29, 2023
London & marathon & women & Data Visualization
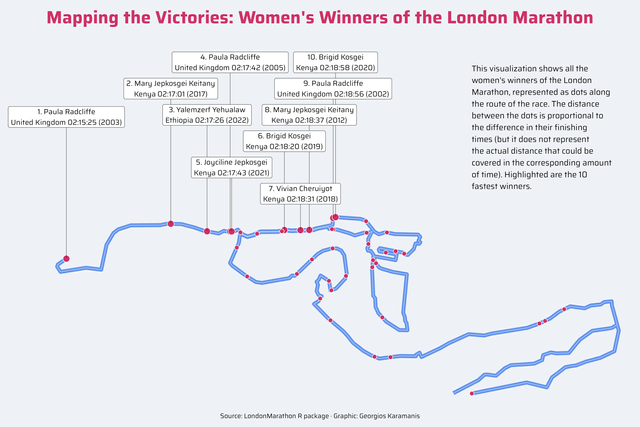 Women’s winners of the London Marathon for this week’s #TidyTuesday. Code on GitHub [ ](This visualization shows all the women’s winners of the
TidyTuesday 2023/16
April 23, 2023
crops & Middle East & map & TidyTuesday & Data Visualization
Women’s winners of the London Marathon for this week’s #TidyTuesday. Code on GitHub [ ](This visualization shows all the women’s winners of the
TidyTuesday 2023/16
April 23, 2023
crops & Middle East & map & TidyTuesday & Data Visualization
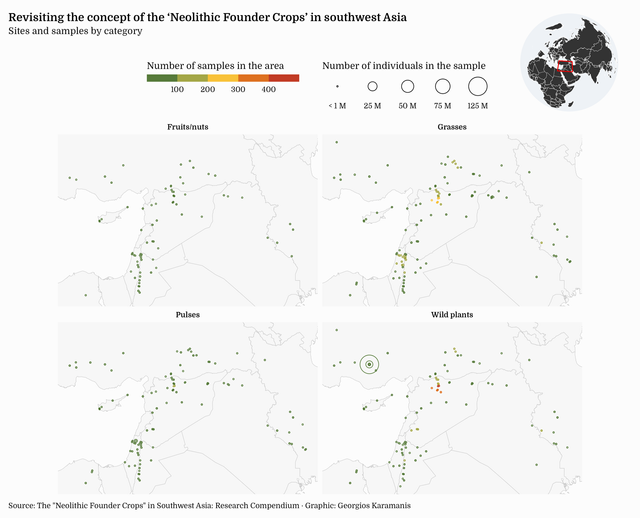 Neolithic Founder Crops for this week’s #TidyTuesday. Had started with a similar map when I saw Nicola’s plot and decided to steal the idea of a
MapPromptMonday 2023/15
April 21, 2023
Europe & MapPromptMonday & topographic & height & Data Visualization & Map
Neolithic Founder Crops for this week’s #TidyTuesday. Had started with a similar map when I saw Nicola’s plot and decided to steal the idea of a
MapPromptMonday 2023/15
April 21, 2023
Europe & MapPromptMonday & topographic & height & Data Visualization & Map
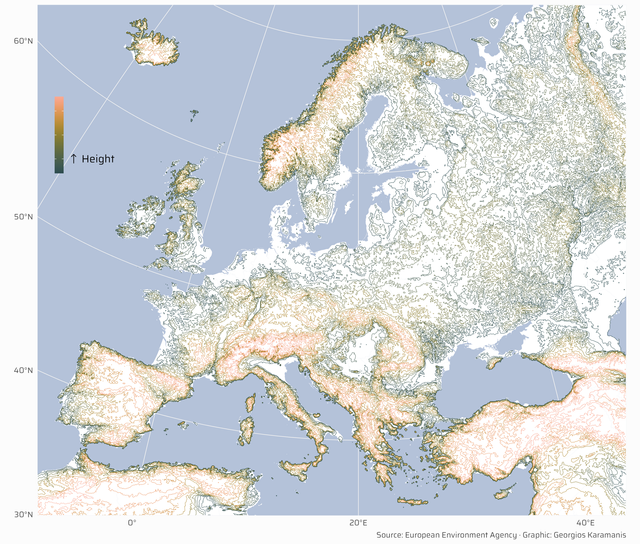 Submission to last week’s #MapPromptMonday, Topography Code on GitHub
MapPromptMonday 2023/14
April 17, 2023
map & MapPromptMonday & photos & Olivia & Map & Data Visualization
Submission to last week’s #MapPromptMonday, Topography Code on GitHub
MapPromptMonday 2023/14
April 17, 2023
map & MapPromptMonday & photos & Olivia & Map & Data Visualization
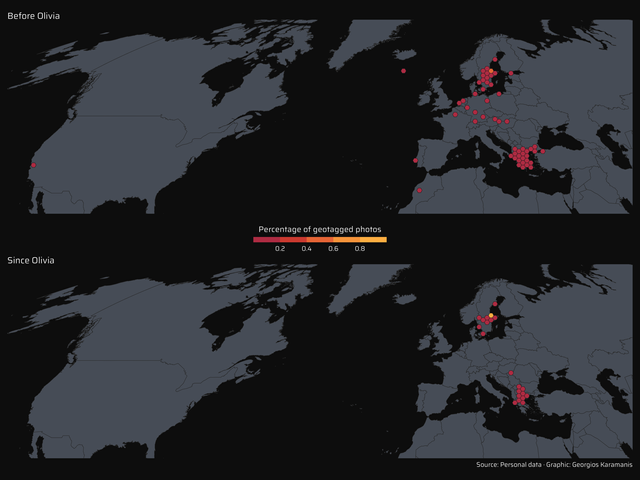 A personal project for #MapPromptMonday, week of April 3-9, Bucket List. Location of geotagged photos before and after the birth of my daughter Code
TidyTuesday 2023/15
April 16, 2023
eggs & TidyTuesday & Data Visualization
A personal project for #MapPromptMonday, week of April 3-9, Bucket List. Location of geotagged photos before and after the birth of my daughter Code
TidyTuesday 2023/15
April 16, 2023
eggs & TidyTuesday & Data Visualization
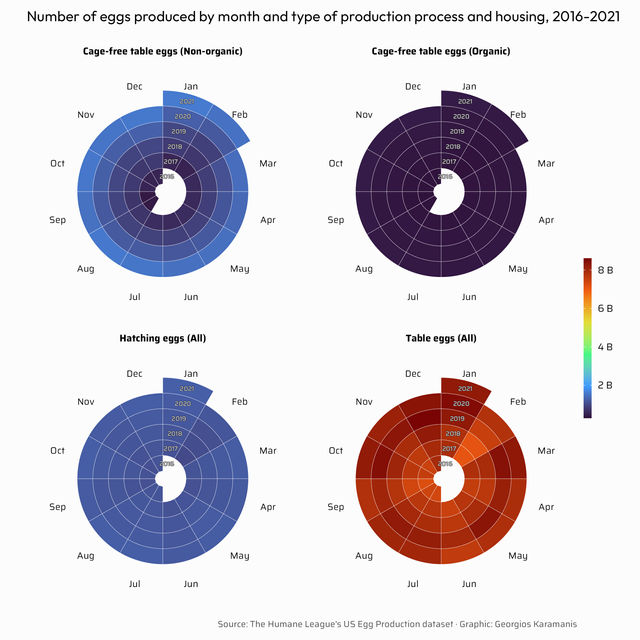 US Egg Production for this week’s #TidyTuesday Code on GitHub
404
April 15, 2023
US Egg Production for this week’s #TidyTuesday Code on GitHub
404
April 15, 2023
 Oops! The page you were looking for is dead. Go back
MapPromptMonday 2023/13
April 9, 2023
map & MapPromptMonday & Europe & disaster & Map & Data Visualization
Oops! The page you were looking for is dead. Go back
MapPromptMonday 2023/13
April 9, 2023
map & MapPromptMonday & Europe & disaster & Map & Data Visualization
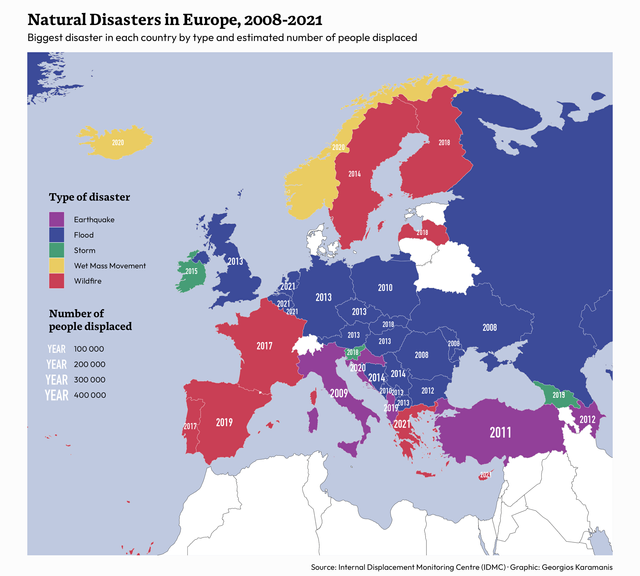 For last week’s #MapPromptMonday, Recent Environmental Disaster, I made this map of the biggest (by number of people displaced) disaster in each
TidyTuesday 2023/14
April 8, 2023
football & Premier League & TidyTuesday & Data Visualization
For last week’s #MapPromptMonday, Recent Environmental Disaster, I made this map of the biggest (by number of people displaced) disaster in each
TidyTuesday 2023/14
April 8, 2023
football & Premier League & TidyTuesday & Data Visualization
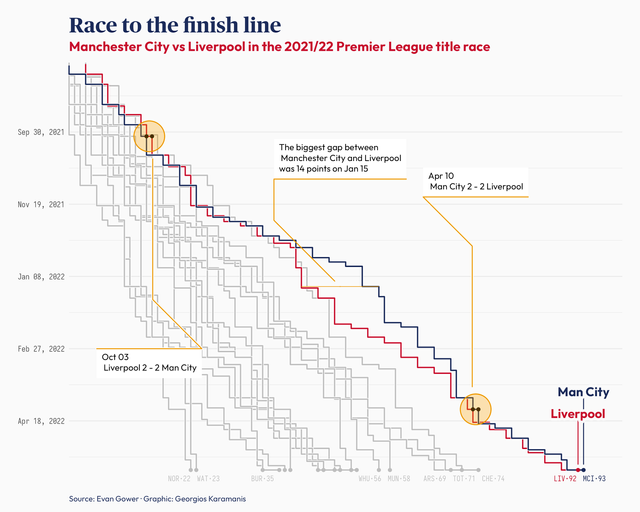 The 2021/22 title race between Manchester City and Liverpool for this week’s #TidyTuesday Code on GitHub
TidyTuesday 2023/13
April 1, 2023
world & timezones & time & Data Visualization & Map
The 2021/22 title race between Manchester City and Liverpool for this week’s #TidyTuesday Code on GitHub
TidyTuesday 2023/13
April 1, 2023
world & timezones & time & Data Visualization & Map
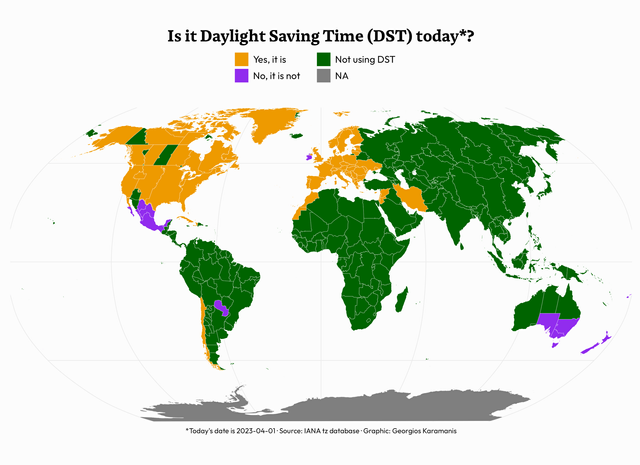 “Is it Daylight Saving Time today?” for this week’s #TidyTuesday Code on GitHub
TidyTuesday 2023/12
March 26, 2023
R & programming languages & Data Visualization
“Is it Daylight Saving Time today?” for this week’s #TidyTuesday Code on GitHub
TidyTuesday 2023/12
March 26, 2023
R & programming languages & Data Visualization
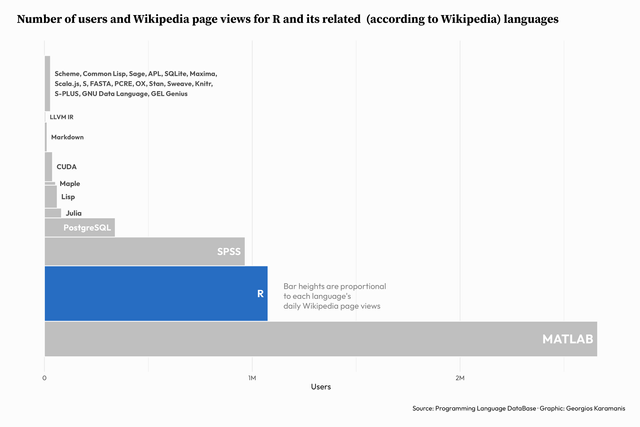 Two charts about R for this week’s #TidyTuesday Code on Github
Next page
Two charts about R for this week’s #TidyTuesday Code on Github
Next page