MapPromptMonday 2023/12
March 24, 2023
map & Earth & temperature & globe & Data Visualization & Map
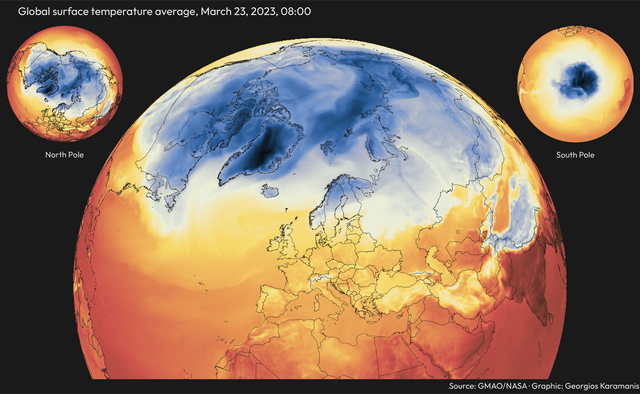 For this week’s #MapPromptMonday, Inspired By…, I used ggplot2 to recreate Wanmei’s great visual. Downloading the data was super easy thanks to
MapPromptMonday 2023/11
March 19, 2023
Europe & map & elevation & relief & Map & Data Visualization
For this week’s #MapPromptMonday, Inspired By…, I used ggplot2 to recreate Wanmei’s great visual. Downloading the data was super easy thanks to
MapPromptMonday 2023/11
March 19, 2023
Europe & map & elevation & relief & Map & Data Visualization
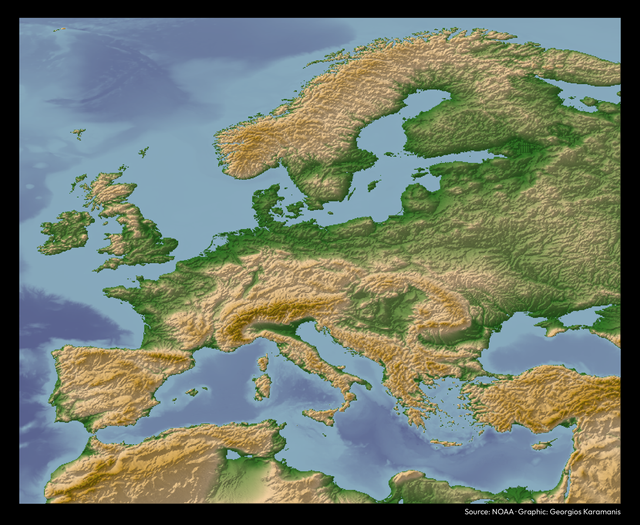 For this week’s #MapPromptMonday, Earth imagery, I made an elevation map of Europe with a shaded relief using Elio’s technique. Code on GitHub
TidyTuesday 2023/11
March 16, 2023
drugs & medicine & Europe & names & text & Data Visualization
For this week’s #MapPromptMonday, Earth imagery, I made an elevation map of Europe with a shaded relief using Elio’s technique. Code on GitHub
TidyTuesday 2023/11
March 16, 2023
drugs & medicine & Europe & names & text & Data Visualization
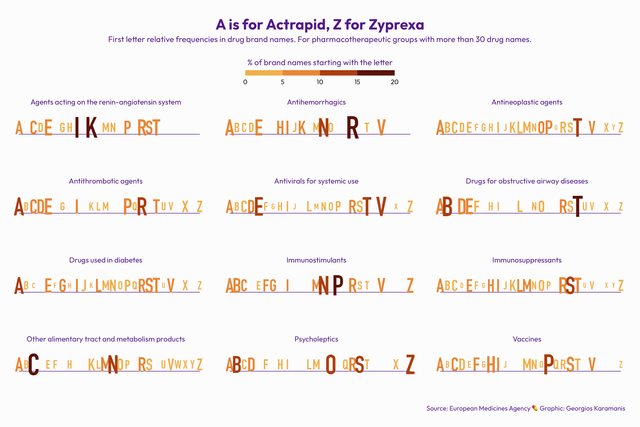 For this week’s #TidyTuesday I looked at the first letters of drug brand names. Cool to see different patterns among the drug groups. Once again
TidyTuesday 2023/10
March 12, 2023
numbats & Australia & map & Data Visualization & Map
For this week’s #TidyTuesday I looked at the first letters of drug brand names. Cool to see different patterns among the drug groups. Once again
TidyTuesday 2023/10
March 12, 2023
numbats & Australia & map & Data Visualization & Map
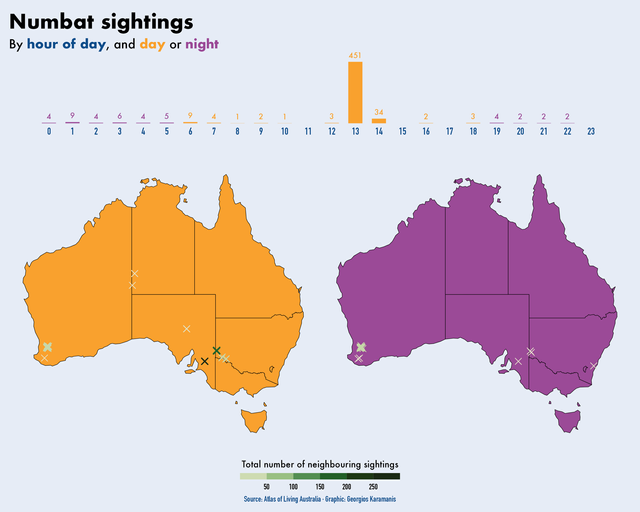 Numbat sightings for this week’s #TidyTuesday Code on GitHub
MapPromptMonday 2023/10
March 11, 2023
pets & cats & dogs & Europe & map & Data Visualization & Map
Numbat sightings for this week’s #TidyTuesday Code on GitHub
MapPromptMonday 2023/10
March 11, 2023
pets & cats & dogs & Europe & map & Data Visualization & Map
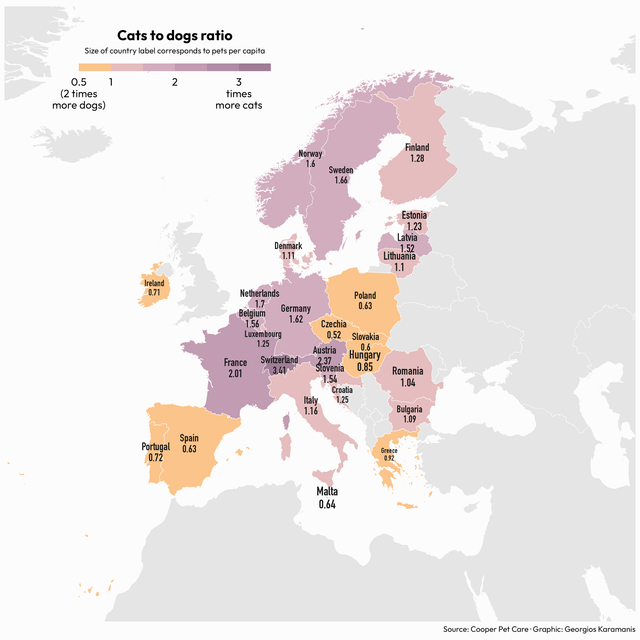 I didn’t have a favorite animal for this week #MapPromptMonday, so I asked my daughter about hers 🙂 So, here is the ratio of cats to dogs in
TidyTuesday 2023/9
March 5, 2023
Africa & language & emoji & Data Visualization
I didn’t have a favorite animal for this week #MapPromptMonday, so I asked my daughter about hers 🙂 So, here is the ratio of cats to dogs in
TidyTuesday 2023/9
March 5, 2023
Africa & language & emoji & Data Visualization
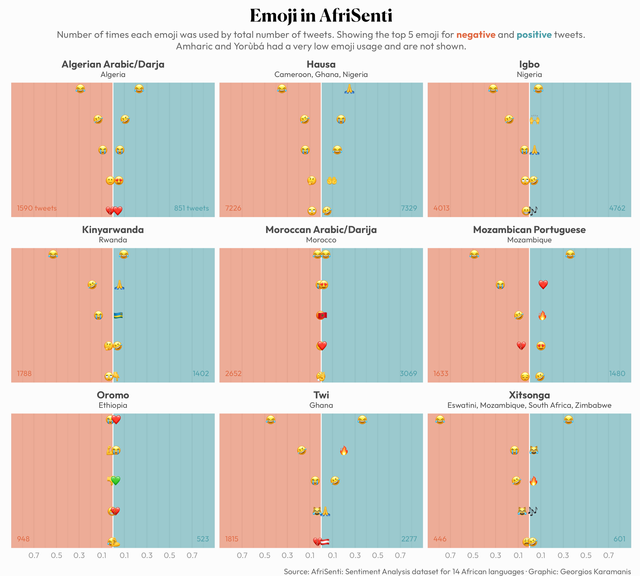 Emoji usage in the AfriSenti dataset for this week’s #TidyTuesday. Code on GitHub
MapPromptMonday 2023/9
March 3, 2023
map & Europe & yew & tree & Data Visualization & Map
Emoji usage in the AfriSenti dataset for this week’s #TidyTuesday. Code on GitHub
MapPromptMonday 2023/9
March 3, 2023
map & Europe & yew & tree & Data Visualization & Map
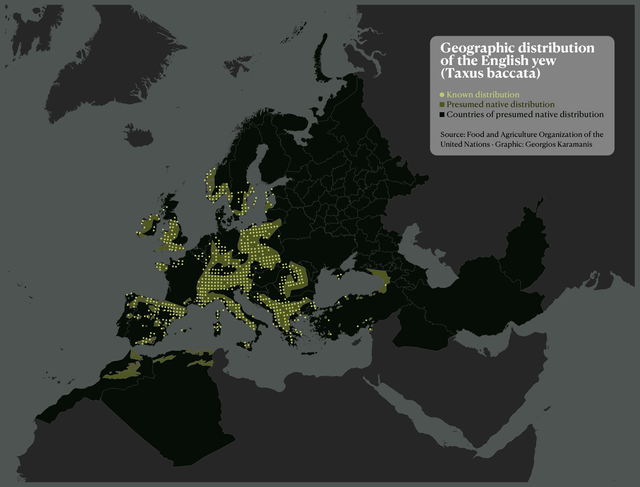 For this week #MapPromptMonday (NGO Data) I remade a map from a FAO report. Code on GitHub
TidyTuesday 2023/8
February 26, 2023
Bob Ross & painting & color & Data Visualization
For this week #MapPromptMonday (NGO Data) I remade a map from a FAO report. Code on GitHub
TidyTuesday 2023/8
February 26, 2023
Bob Ross & painting & color & Data Visualization
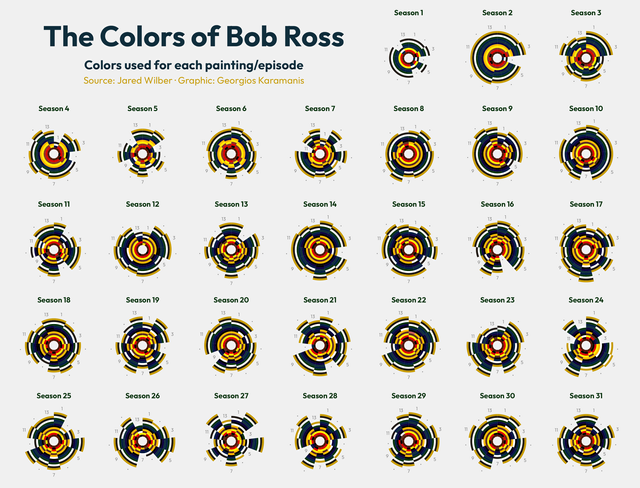 Colors used in Bob Ross’s paintings for this week’s #TidyTuesday Code on GitHub
MapPromptMonday 2023/8
February 23, 2023
map & train & Europe & b&w & Map & Data Visualization
Colors used in Bob Ross’s paintings for this week’s #TidyTuesday Code on GitHub
MapPromptMonday 2023/8
February 23, 2023
map & train & Europe & b&w & Map & Data Visualization
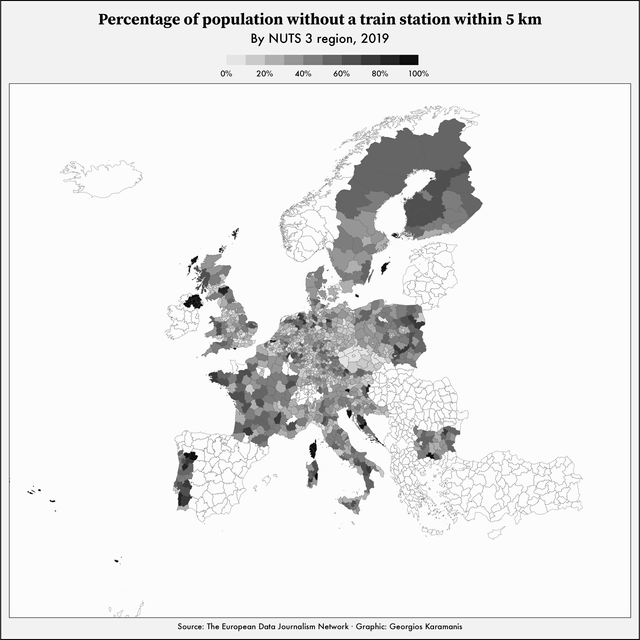 For this week #MapPromptMonday (Black & White/Grayscale) I used a dataset by the EDJNet. Code on GitHub
TidyTuesday 2023/7
February 19, 2023
Hollywood & movies & actors & age & Data Visualization
For this week #MapPromptMonday (Black & White/Grayscale) I used a dataset by the EDJNet. Code on GitHub
TidyTuesday 2023/7
February 19, 2023
Hollywood & movies & actors & age & Data Visualization
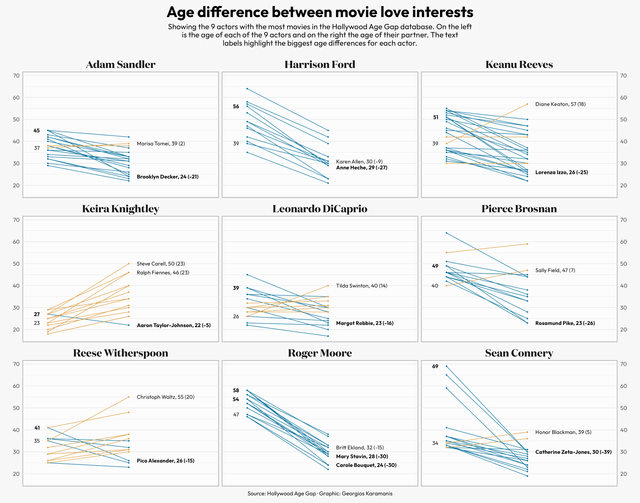 Hollywood age gaps for this week’s #TidyTuesday Code on Github
Next page
Hollywood age gaps for this week’s #TidyTuesday Code on Github
Next page