MapPromptMonday 2023/7
February 16, 2023
map & Europe & sunshine & precipitation & bivariate & Map & Data Visualization
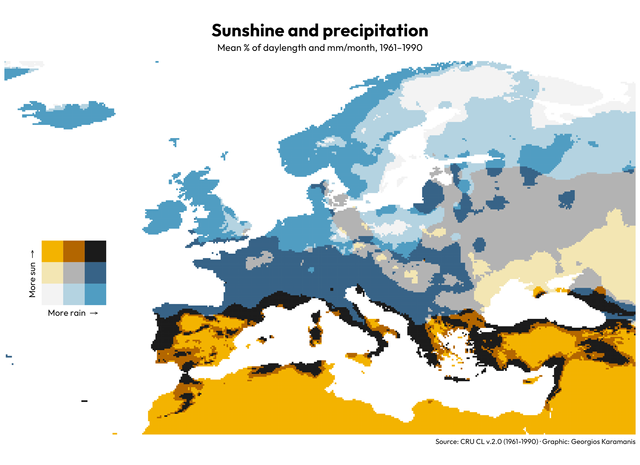 Mean sunshine and precipitation between 1961 and 1990 for this week’s #MapPromptMonday (Bivariate map) Idea and colors by Colin Angus Code on GitHub
TidyTuesday 2023/6
February 9, 2023
Tech & stocks & Data Visualization
Mean sunshine and precipitation between 1961 and 1990 for this week’s #MapPromptMonday (Bivariate map) Idea and colors by Colin Angus Code on GitHub
TidyTuesday 2023/6
February 9, 2023
Tech & stocks & Data Visualization
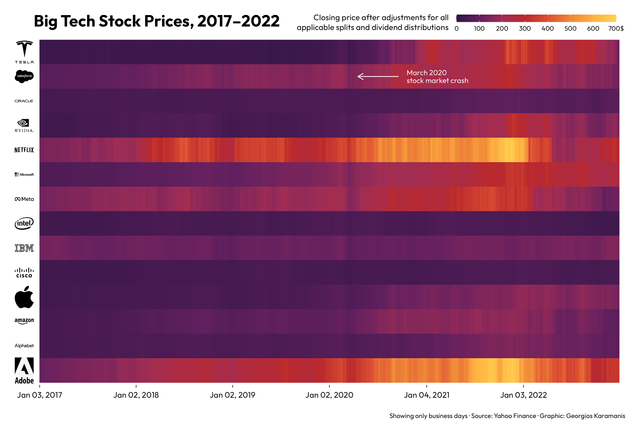 Big tech stock prices for this week’s #TidyTuesday Code on Github
MapPromptMonday 2023/6
February 6, 2023
Earth & climate & temperature & map & Data Visualization & Map
Big tech stock prices for this week’s #TidyTuesday Code on Github
MapPromptMonday 2023/6
February 6, 2023
Earth & climate & temperature & map & Data Visualization & Map
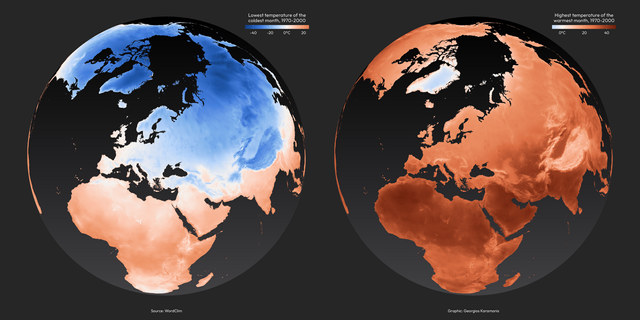 Lowest and highest temperatures between 1970 and 2000 for this week’s #MapPromptMonday (Climate/Weather) code on GitHub
MapPromptMonday 2023/5
February 4, 2023
Europe & Sweden & Immigration & Map & Data Visualization
Lowest and highest temperatures between 1970 and 2000 for this week’s #MapPromptMonday (Climate/Weather) code on GitHub
MapPromptMonday 2023/5
February 4, 2023
Europe & Sweden & Immigration & Map & Data Visualization
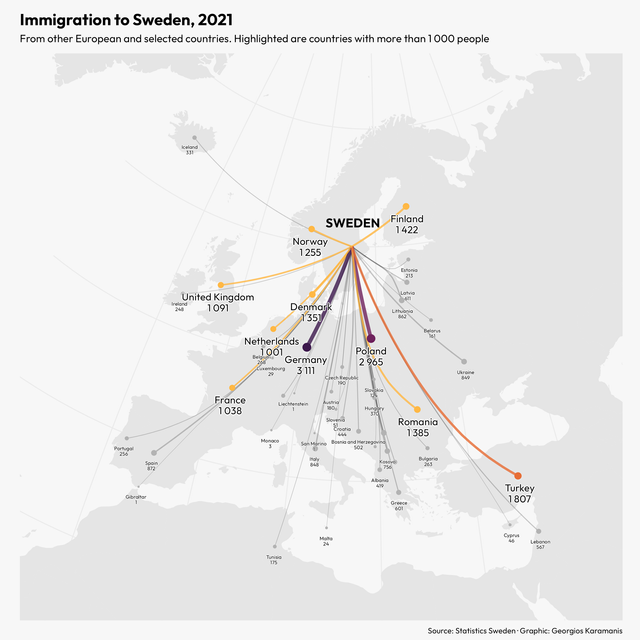 Immigration to Sweden for this week’s #MapPromptMonday (Flow Map) Code on GitHub
TidyTuesday 2023/5
February 3, 2023
cats & UK & circles & movement & Data Visualization
Immigration to Sweden for this week’s #MapPromptMonday (Flow Map) Code on GitHub
TidyTuesday 2023/5
February 3, 2023
cats & UK & circles & movement & Data Visualization
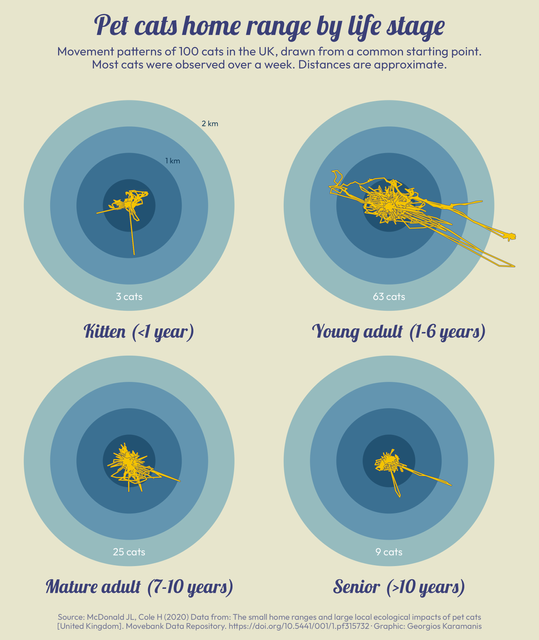 Pet cats movement range by life stage for this week’s #TidyTuesday Code on Github
MapPromptMonday 2023/4
January 28, 2023
TV & map & Europe & Map & Data Visualization
Pet cats movement range by life stage for this week’s #TidyTuesday Code on Github
MapPromptMonday 2023/4
January 28, 2023
TV & map & Europe & Map & Data Visualization
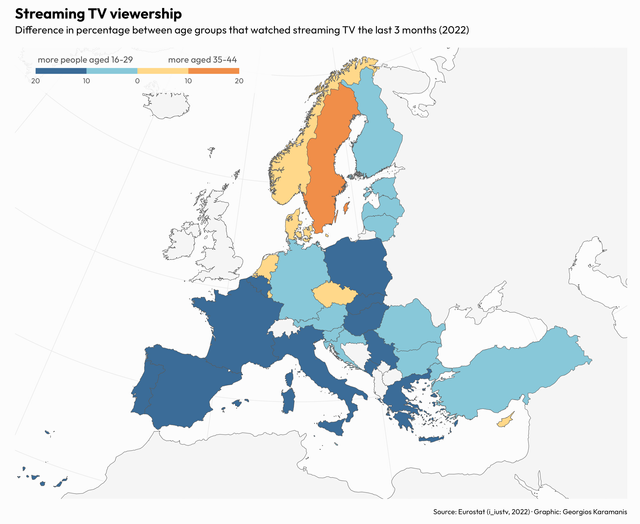 For this week’s #MapPromptMonday I made a map comparing the streaming TV viewership between two age groups in EU countries. Code on GitHub
TidyTuesday 2023/4
January 26, 2023
Alone & TV & waffle & Data Visualization
For this week’s #MapPromptMonday I made a map comparing the streaming TV viewership between two age groups in EU countries. Code on GitHub
TidyTuesday 2023/4
January 26, 2023
Alone & TV & waffle & Data Visualization
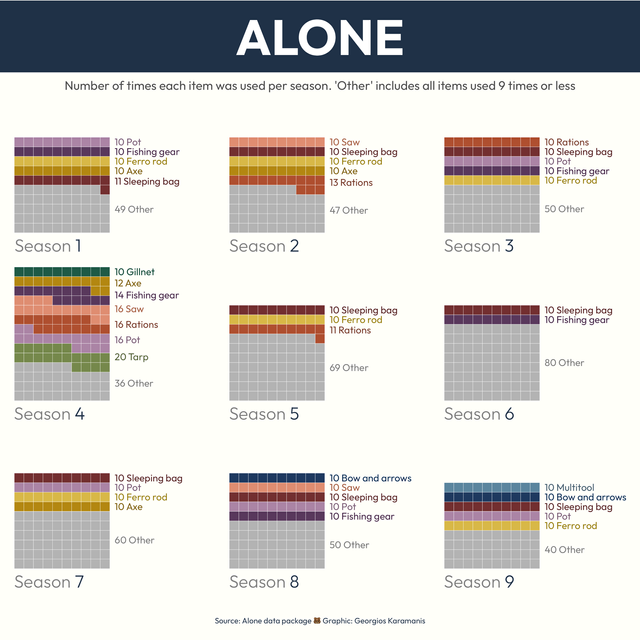 For this week’s #TidyTuesday I made a waffle chart highlighting the most popular items brought by “Alone” participants by season. Code on Github
TidyTuesday 2023/3
January 22, 2023
art & museum & exhibition & Data Visualization
For this week’s #TidyTuesday I made a waffle chart highlighting the most popular items brought by “Alone” participants by season. Code on Github
TidyTuesday 2023/3
January 22, 2023
art & museum & exhibition & Data Visualization
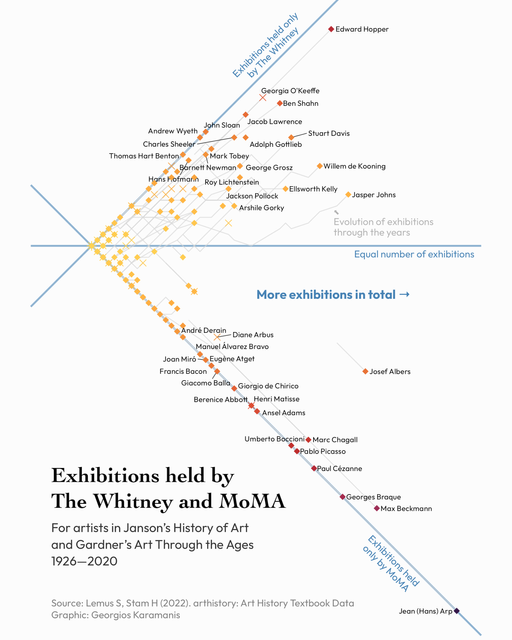 Exhibitions by MoMA and The Whitney for this week’s #TidyTuesday Code on GitHub
MapPromptMonday 2023/3
January 21, 2023
map & MapPromptMonday & livestock & colorblind-friendly & Data Visualization & Map
Exhibitions by MoMA and The Whitney for this week’s #TidyTuesday Code on GitHub
MapPromptMonday 2023/3
January 21, 2023
map & MapPromptMonday & livestock & colorblind-friendly & Data Visualization & Map
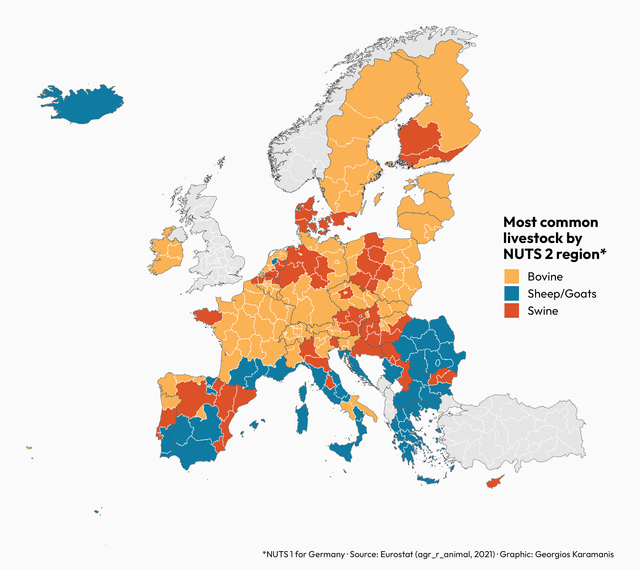 Most common livestock in EU for this week’s #MapPromptMonday. Used the colorblind-friendly palette “Egypt” from MetBrewer Code on GitHub
TidyTuesday and MapPromptMonday 2023/2
January 14, 2023
TidyTuesday & MapPromptMonday & map & US & bird & hot spot & grackle & Data Visualization
Most common livestock in EU for this week’s #MapPromptMonday. Used the colorblind-friendly palette “Egypt” from MetBrewer Code on GitHub
TidyTuesday and MapPromptMonday 2023/2
January 14, 2023
TidyTuesday & MapPromptMonday & map & US & bird & hot spot & grackle & Data Visualization
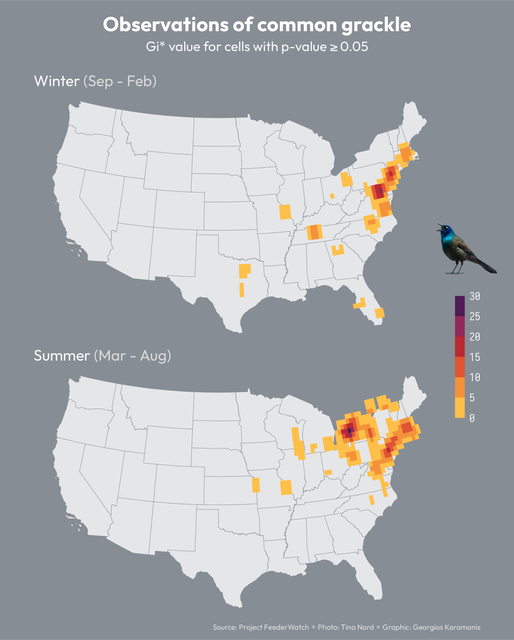 Another cross post for #MapPromptMonday (Hot spot map) and #TidyTuesday (Project FeederWatch). First time doing hot spot analysis, used the
Next page
Another cross post for #MapPromptMonday (Hot spot map) and #TidyTuesday (Project FeederWatch). First time doing hot spot analysis, used the
Next page