TidyTuesday and MapPromptMonday 2023/1
January 5, 2023
Europe & map & death & Eurostat & Data Visualization & Map
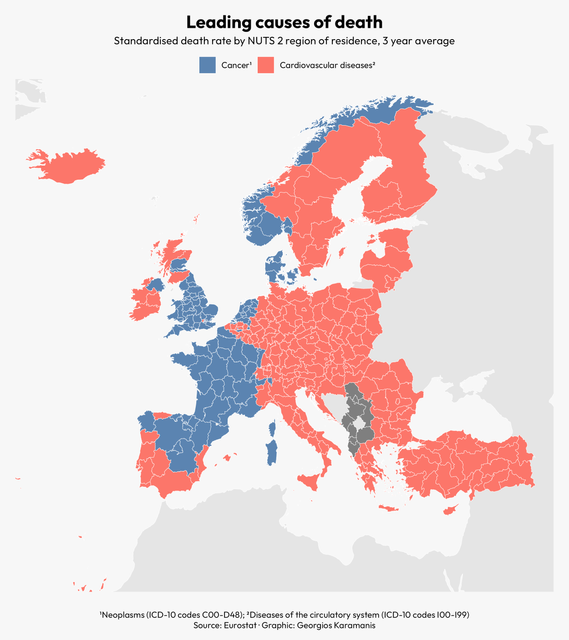 Cross post for #MapPromptMonday and #TidyTuesday. Leading cause of death by European NUTS 2 regions, trying out the eurostat R package for getting
TidyTuesday 2022/52
January 1, 2023
Star Trek & R & timeline & Data Visualization
Cross post for #MapPromptMonday and #TidyTuesday. Leading cause of death by European NUTS 2 regions, trying out the eurostat R package for getting
TidyTuesday 2022/52
January 1, 2023
Star Trek & R & timeline & Data Visualization
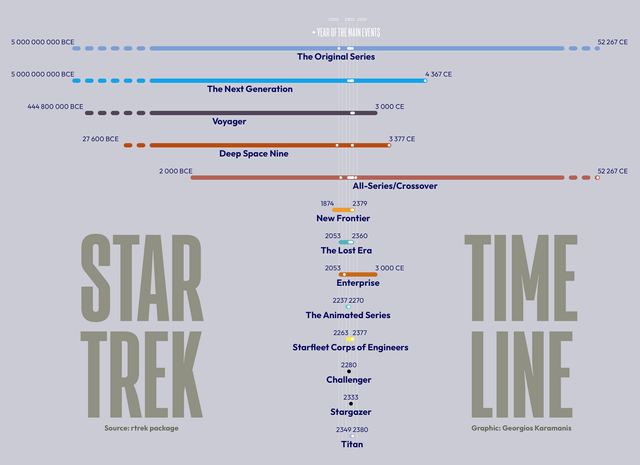 Star Trek timelines for this week’s #TidyTuesday. code at GitHub
TidyTuesday 2022/51
December 23, 2022
R & US & map & weather & wind & Data Visualization
Star Trek timelines for this week’s #TidyTuesday. code at GitHub
TidyTuesday 2022/51
December 23, 2022
R & US & map & weather & wind & Data Visualization
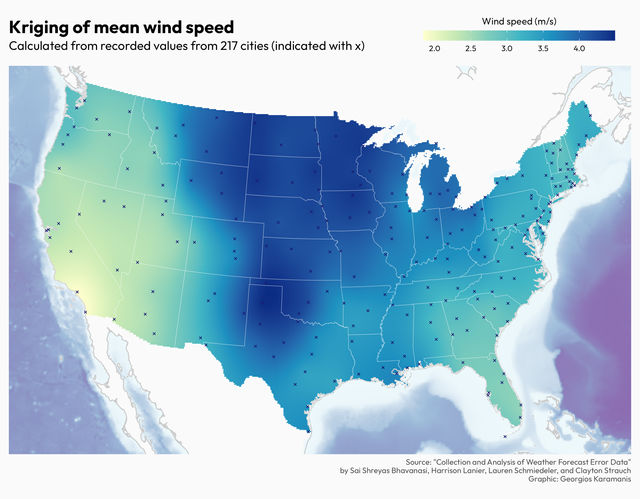 Mean wind speed for this week’s #TidyTuesday. First time using kriging interpolaration, inspired by the plots in the poster at the source of the
TidyTuesday 2022/50
December 17, 2022
R & retail & sales & US & Data Visualization
Mean wind speed for this week’s #TidyTuesday. First time using kriging interpolaration, inspired by the plots in the poster at the source of the
TidyTuesday 2022/50
December 17, 2022
R & retail & sales & US & Data Visualization
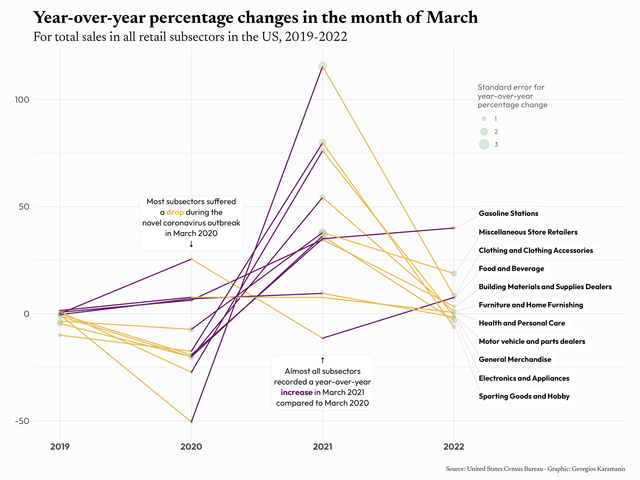 Retail sales for this week’s #TidyTuesday, comparing the YOY changes in March 2019-2022. Code on GitHub
TidyTuesday 2022/49
December 9, 2022
R & Manhattan & New York & map & elevators & buildings & Data Visualization
Retail sales for this week’s #TidyTuesday, comparing the YOY changes in March 2019-2022. Code on GitHub
TidyTuesday 2022/49
December 9, 2022
R & Manhattan & New York & map & elevators & buildings & Data Visualization
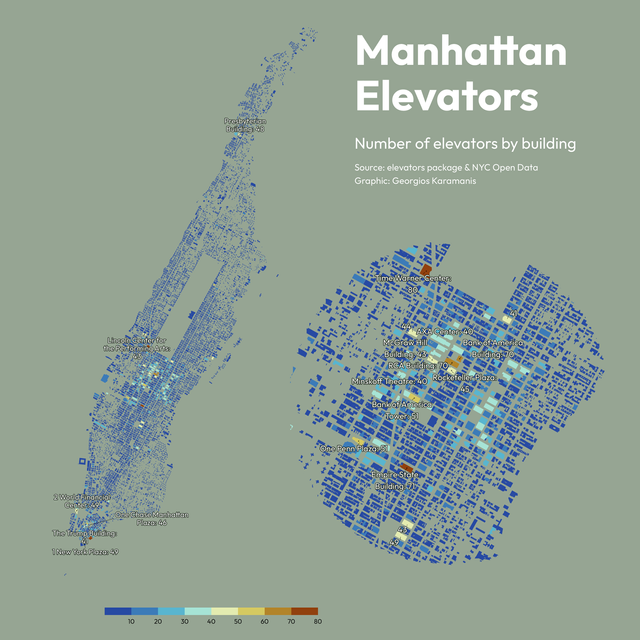 Number of elevators by building for this week’s #TidyTuesday, combining the elevator dataset with the building footprints spatial file from NYC Open
TidyTuesday 2022/48
December 3, 2022
R & TidyTuesday & football & FIFA & Data Visualization
Number of elevators by building for this week’s #TidyTuesday, combining the elevator dataset with the building footprints spatial file from NYC Open
TidyTuesday 2022/48
December 3, 2022
R & TidyTuesday & football & FIFA & Data Visualization
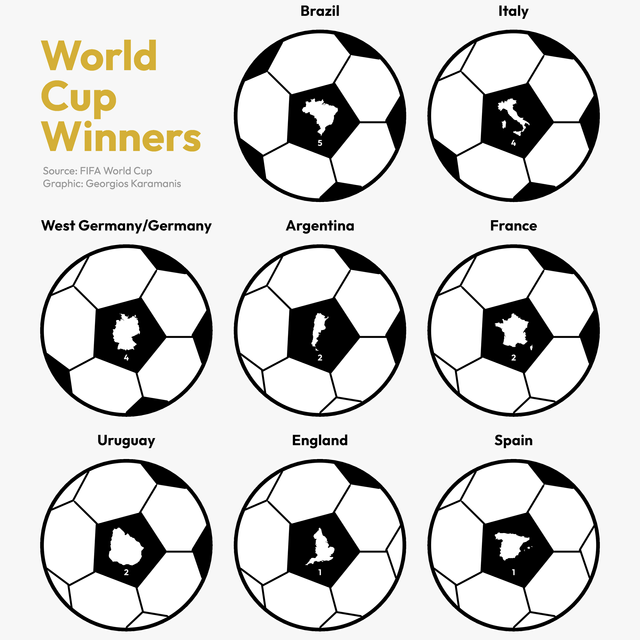 Number of FIFA World Cup titles for this week’s #TidyTuesday Code on GitHub
TidyTuesday 2022/47
November 27, 2022
R & Great Britain & map & museum & Data Visualization
Number of FIFA World Cup titles for this week’s #TidyTuesday Code on GitHub
TidyTuesday 2022/47
November 27, 2022
R & Great Britain & map & museum & Data Visualization
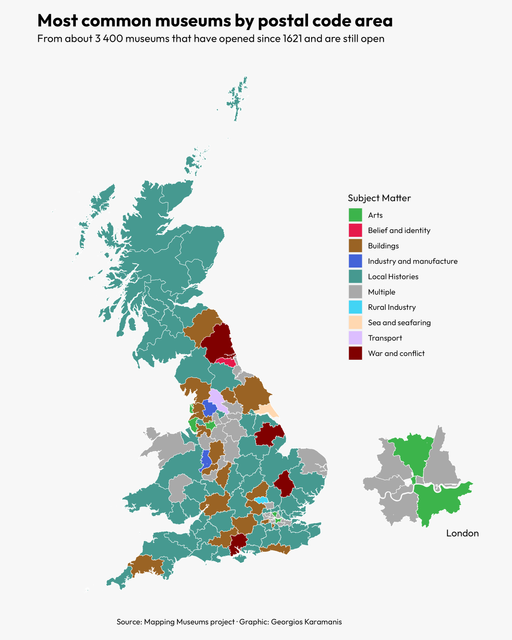 Most common types of museums for this week’s #TidyTuesday Code on GitHub
TidyTuesday 2022/46
November 20, 2022
webpages & Internet & speed & TidyTuesday & R & Data Visualization
Most common types of museums for this week’s #TidyTuesday Code on GitHub
TidyTuesday 2022/46
November 20, 2022
webpages & Internet & speed & TidyTuesday & R & Data Visualization
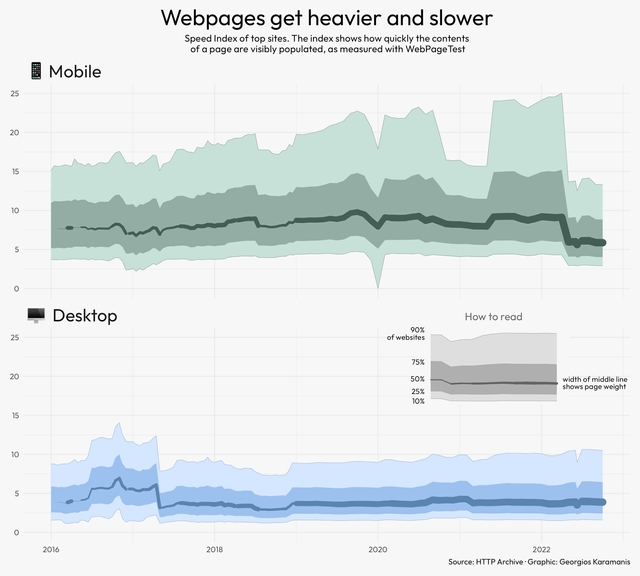 Webpages speed for this week’s #TidyTuesday code on GitHub
TidyTuesday 2022/45
November 8, 2022
radio stations & FM & US & Data Visualization
Webpages speed for this week’s #TidyTuesday code on GitHub
TidyTuesday 2022/45
November 8, 2022
radio stations & FM & US & Data Visualization
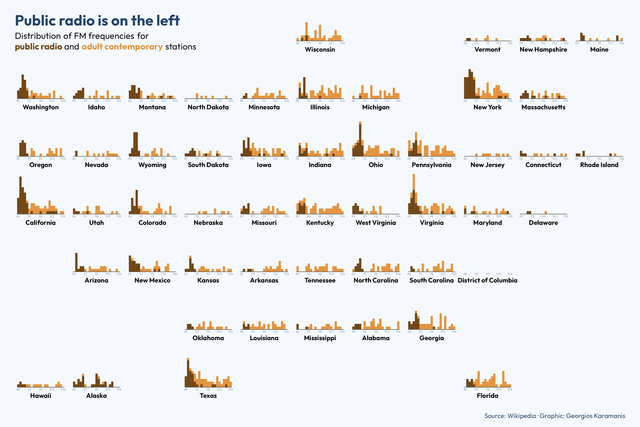 For this week’s #TidyTuesday I plotted the distribution of FM frequencies for public radio and adult contemporary stations by state Code on GitHub
TidyTuesday 2022/44
November 6, 2022
zombie & horror movies & TidyTuesday & Data Visualization
For this week’s #TidyTuesday I plotted the distribution of FM frequencies for public radio and adult contemporary stations by state Code on GitHub
TidyTuesday 2022/44
November 6, 2022
zombie & horror movies & TidyTuesday & Data Visualization
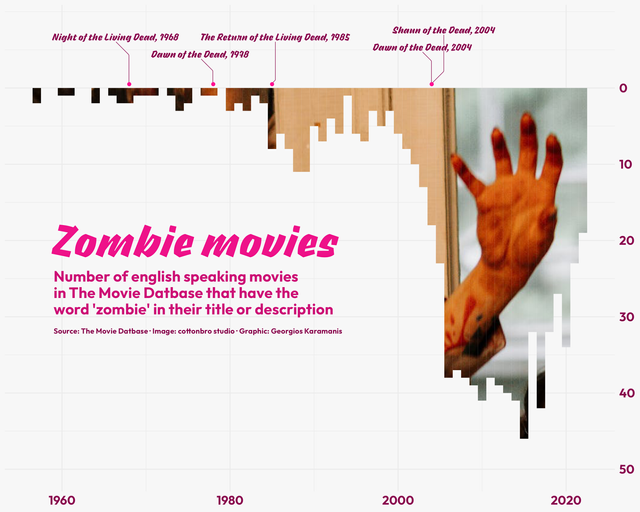 Zombie movies for this week’s #TidyTuesday Code on GitHub
Next page
Zombie movies for this week’s #TidyTuesday Code on GitHub
Next page