TidyTuesday 2022/43
October 27, 2022
R & British Bake Off & anchor chart & TV & Data Visualization
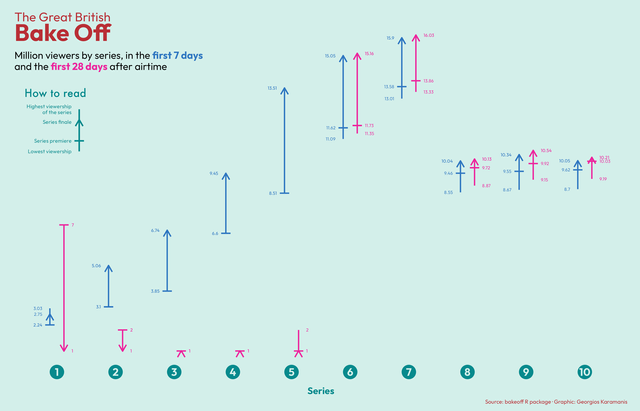 For this week’s #TidyTuesday I made an… anchor chart (as seen in this post). Code on GitHub
TidyTuesday 2022/42
October 23, 2022
TV & Stranger Things & R & TidyTuesday & Data Visualization
For this week’s #TidyTuesday I made an… anchor chart (as seen in this post). Code on GitHub
TidyTuesday 2022/42
October 23, 2022
TV & Stranger Things & R & TidyTuesday & Data Visualization
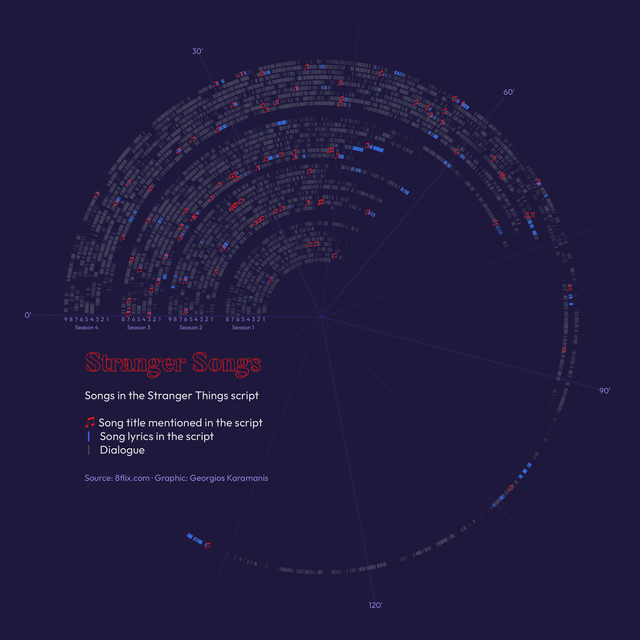 For this week’s #TidyTuesday I plotted the songs of Stranger Things Code on GitHub
TidyTuesday 2022/41
October 16, 2022
yarn & knitting & Ravelry & TidyTuesday & Data Visualization
For this week’s #TidyTuesday I plotted the songs of Stranger Things Code on GitHub
TidyTuesday 2022/41
October 16, 2022
yarn & knitting & Ravelry & TidyTuesday & Data Visualization
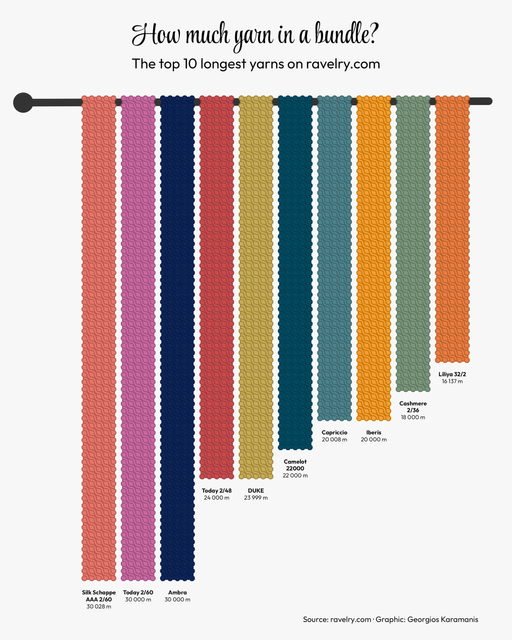 For this week’s #TidyTuesday I knitted the longest yarn bundles on ravelry.com Code on GitHub
TidyTuesday 2022/40
October 7, 2022
emoji & Product Hunt & waffle & R & TidyTuesday & Data Visualization
For this week’s #TidyTuesday I knitted the longest yarn bundles on ravelry.com Code on GitHub
TidyTuesday 2022/40
October 7, 2022
emoji & Product Hunt & waffle & R & TidyTuesday & Data Visualization
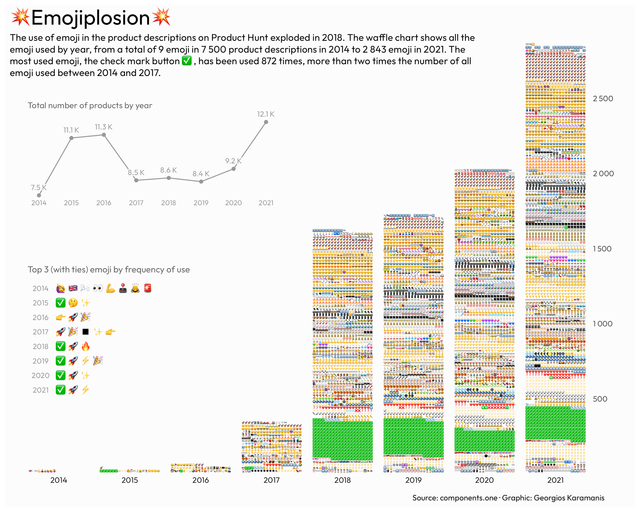 For this week’s #TidyTuesday I made a ✅ waffle chart and ✅ two more charts ✅ with all the emoji used in Product Hunt product descriptions code on
TidyTuesday 2022/39
September 28, 2022
artists & map & US & R & TidyTuesday & Data Visualization
For this week’s #TidyTuesday I made a ✅ waffle chart and ✅ two more charts ✅ with all the emoji used in Product Hunt product descriptions code on
TidyTuesday 2022/39
September 28, 2022
artists & map & US & R & TidyTuesday & Data Visualization
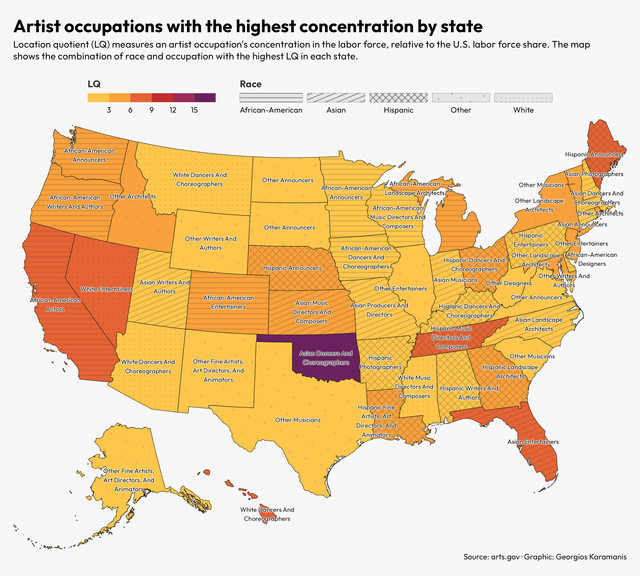 For this week’s #TidyTuesday I created a map of the combination of race and artist occupation with the highest concentration by state code on GitHub
TidyTuesday 2022/38
September 24, 2022
wastewater treatment plants & R & map & Mediterranean sea & Data Visualization
For this week’s #TidyTuesday I created a map of the combination of race and artist occupation with the highest concentration by state code on GitHub
TidyTuesday 2022/38
September 24, 2022
wastewater treatment plants & R & map & Mediterranean sea & Data Visualization
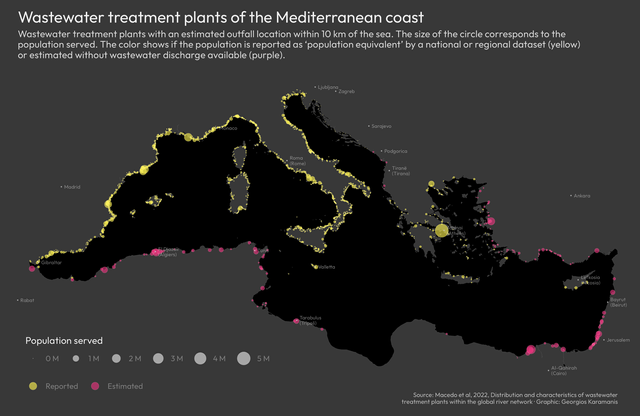 For this week’s #TidyTuesday I created a map of the wastewater treatment plants around the Mediterranean code on GitHub
TidyTuesday 2022/37
September 16, 2022
Bigfoot & bear & US & map & R & Data Visualization
For this week’s #TidyTuesday I created a map of the wastewater treatment plants around the Mediterranean code on GitHub
TidyTuesday 2022/37
September 16, 2022
Bigfoot & bear & US & map & R & Data Visualization
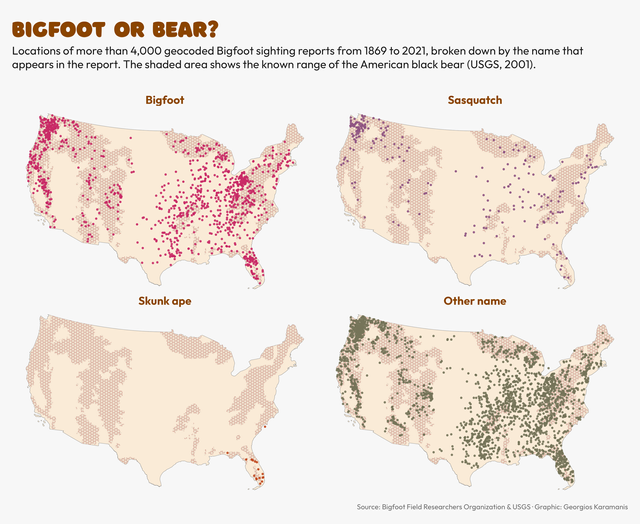 Bigfoot or bear for this week’s #TidyTuesday code on GitHub
NBA games that ended with the same score on the same day
September 12, 2022
R & NBA & EuroBasket & Code
Bigfoot or bear for this week’s #TidyTuesday code on GitHub
NBA games that ended with the same score on the same day
September 12, 2022
R & NBA & EuroBasket & Code
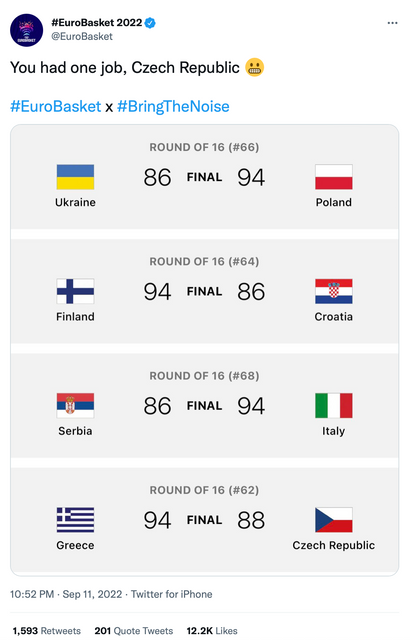 Yesterday, during Round of 16 of the FIBA EuroBasket 2022, three matches ended with the same score, 94-86. [ ]( You had one job, Czech Republic
TidyTuesday 2022/36
September 9, 2022
LEGO & gray & color & R & Code
Yesterday, during Round of 16 of the FIBA EuroBasket 2022, three matches ended with the same score, 94-86. [ ]( You had one job, Czech Republic
TidyTuesday 2022/36
September 9, 2022
LEGO & gray & color & R & Code
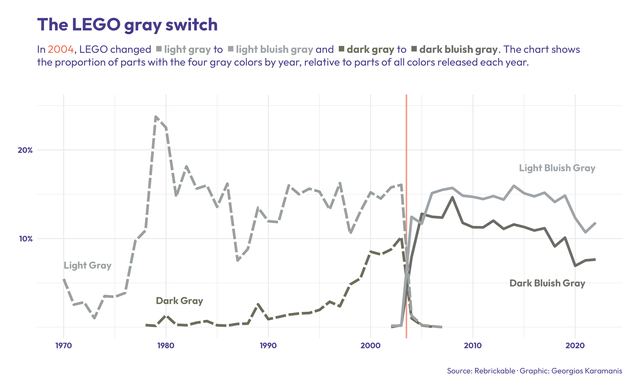 The LEGO gray switch for this week’s #TidyTuesday with data from @Rebrickable. The change was apparently a big thing. Code on GitHub
TidyTuesday 2022/35
September 1, 2022
R & Pell grant & mekko & Data Visualization
The LEGO gray switch for this week’s #TidyTuesday with data from @Rebrickable. The change was apparently a big thing. Code on GitHub
TidyTuesday 2022/35
September 1, 2022
R & Pell grant & mekko & Data Visualization
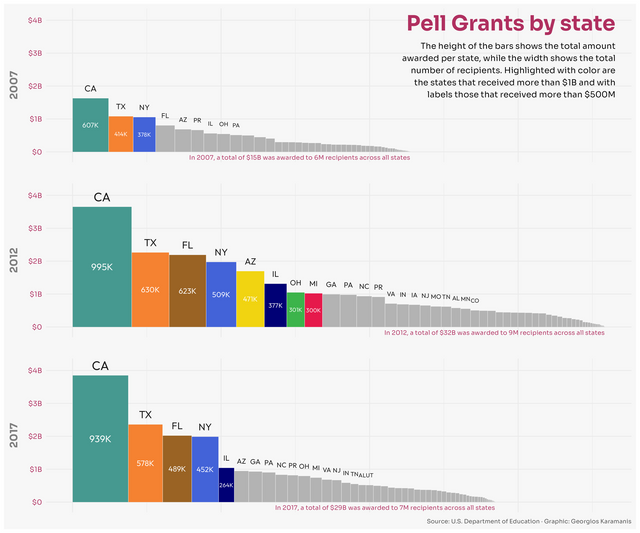 For this week’s #TidyTuesday I made a bar Mekko chart of the Pell grants by state for 2007, 2012 and 2017. It was too late in the process when I
Next page
For this week’s #TidyTuesday I made a bar Mekko chart of the Pell grants by state for 2007, 2012 and 2017. It was too late in the process when I
Next page