TidyTuesday 2022/34
August 27, 2022
chips & PlayStation & Xbox & console & Data Visualization
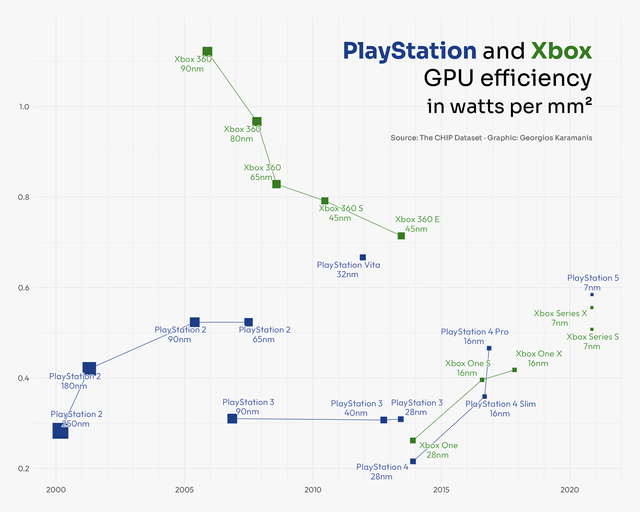 For this week’s #TidyTuesday I plotted the efficiency of GPUs in watts/mm2 for PlayStation and Xbox consoles. code on GitHub
TidyTuesday 2022/33
August 21, 2022
personality & R & Data Visualization
For this week’s #TidyTuesday I plotted the efficiency of GPUs in watts/mm2 for PlayStation and Xbox consoles. code on GitHub
TidyTuesday 2022/33
August 21, 2022
personality & R & Data Visualization
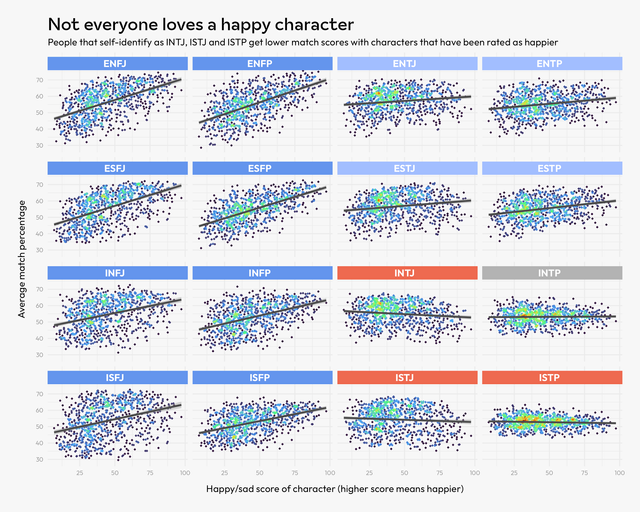 For this week’s #TidyTuesday I plotted the average match score with a character vs. the happy/sad rating of the character. The plots show the
TidyTuesday 2022/32
August 12, 2022
R & Ferris wheels & Data Visualization
For this week’s #TidyTuesday I plotted the average match score with a character vs. the happy/sad rating of the character. The plots show the
TidyTuesday 2022/32
August 12, 2022
R & Ferris wheels & Data Visualization
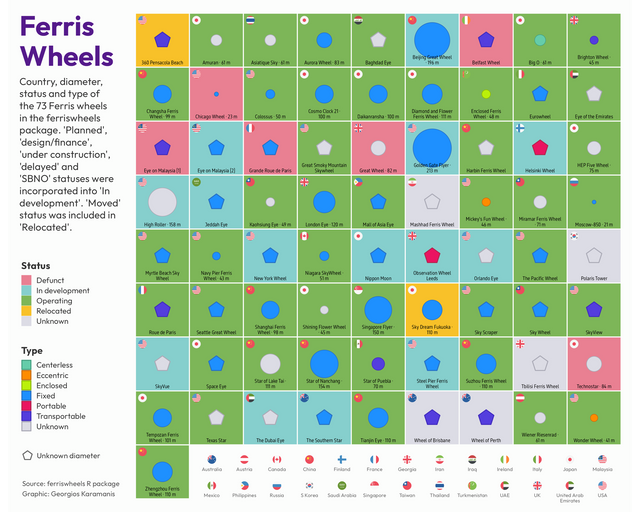 For this week’s #TidyTuesday I plotted the country, diameter, status and type of the 73 Ferris wheels in the ferriswheels R package by Emil
TidyTuesday 2022/31
August 7, 2022
R & frogs & heatmap & map & Data Visualization
For this week’s #TidyTuesday I plotted the country, diameter, status and type of the 73 Ferris wheels in the ferriswheels R package by Emil
TidyTuesday 2022/31
August 7, 2022
R & frogs & heatmap & map & Data Visualization
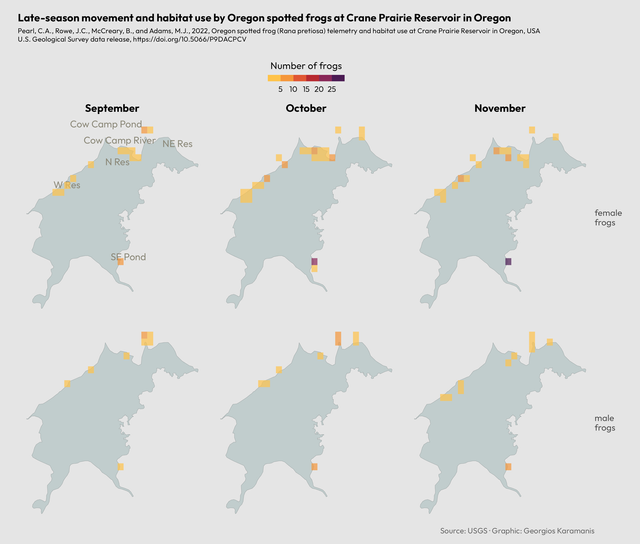 For this week’s #TidyTuesday I made a simple heatmap of frog observations by month and sex code on GitHub
TidyTuesday 2022/29
July 24, 2022
TidyTuesday & Nordics & beds & healthcare & Data Visualization
For this week’s #TidyTuesday I made a simple heatmap of frog observations by month and sex code on GitHub
TidyTuesday 2022/29
July 24, 2022
TidyTuesday & Nordics & beds & healthcare & Data Visualization
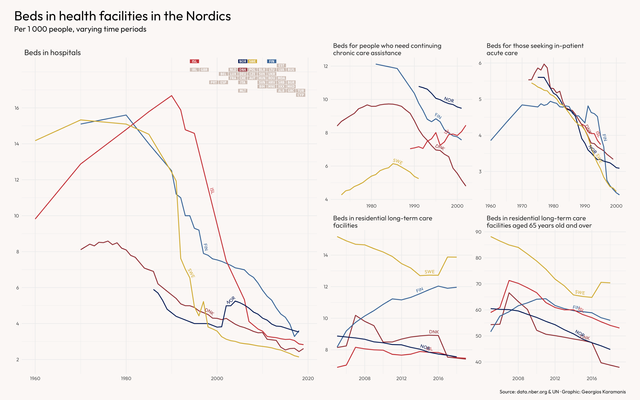 For this week’s #TidyTuesday I looked at the number of beds in hospitals and other health facilities in the Nordics code on GitHub
TidyTuesday 2022/28
July 15, 2022
Greece & flights & R & Data Visualization
For this week’s #TidyTuesday I looked at the number of beds in hospitals and other health facilities in the Nordics code on GitHub
TidyTuesday 2022/28
July 15, 2022
Greece & flights & R & Data Visualization
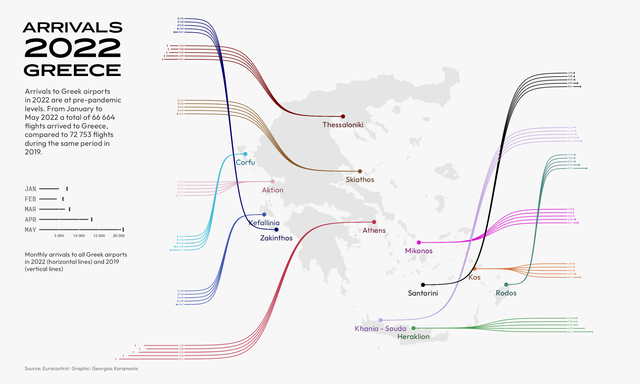 For this week’s #TidyTuesday I plotted the arrivals to Greek airports in 2022 compared to 2019. code on GitHub
TidyTuesday 2022/27
July 7, 2022
San Francisco & map & rent & Data Visualization
For this week’s #TidyTuesday I plotted the arrivals to Greek airports in 2022 compared to 2019. code on GitHub
TidyTuesday 2022/27
July 7, 2022
San Francisco & map & rent & Data Visualization
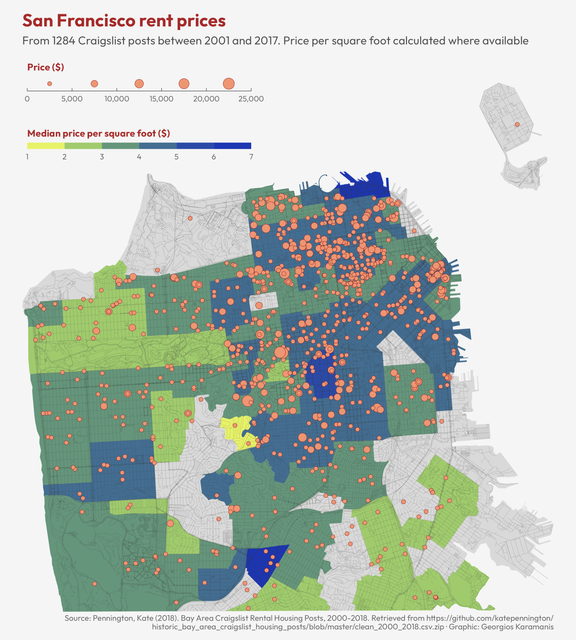 San Francisco rent prices for this week’s #TidyTuesday. Data source: katepennington.org Inspiration and code from Phil Massicotte’s SF trees plot
TidyTuesday 2022/26
July 2, 2022
TidyTuesday & gender & pay gap & map & Data Visualization
San Francisco rent prices for this week’s #TidyTuesday. Data source: katepennington.org Inspiration and code from Phil Massicotte’s SF trees plot
TidyTuesday 2022/26
July 2, 2022
TidyTuesday & gender & pay gap & map & Data Visualization
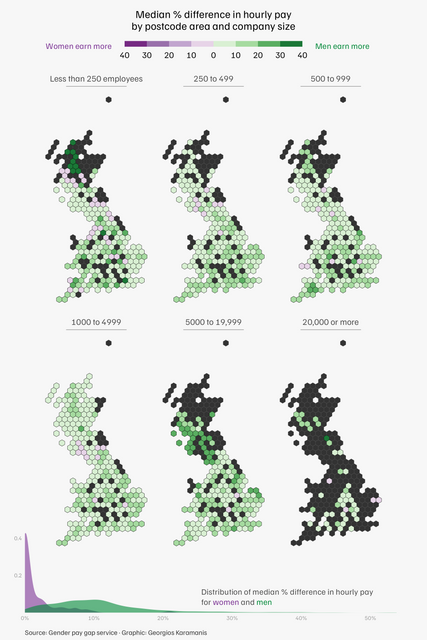 Gender pay gap by company size and postcode area for this week’s #TidyTuesday, using the geogrid package to create a hex grid from a gpkg file. Code
What’s the most common type of livestock in each county - Swedish version
June 24, 2022
animal & livestock & map & Sweden & people & Data Visualization
Gender pay gap by company size and postcode area for this week’s #TidyTuesday, using the geogrid package to create a hex grid from a gpkg file. Code
What’s the most common type of livestock in each county - Swedish version
June 24, 2022
animal & livestock & map & Sweden & people & Data Visualization
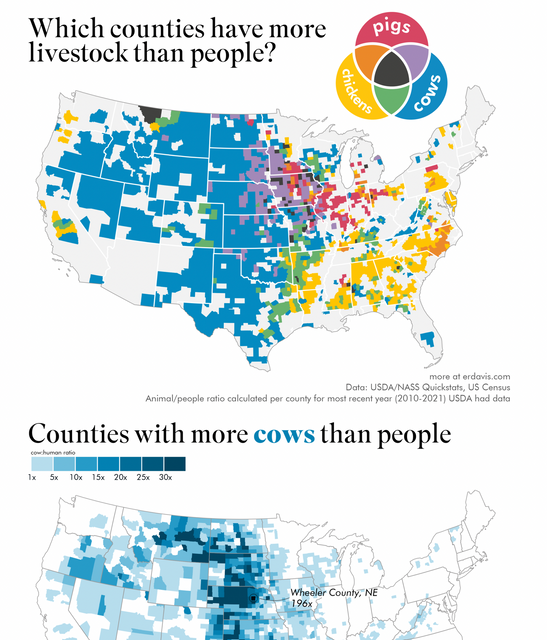 When I saw Erin’s post a couple of days ago, I immediately wanted to do same for Sweden and started searching for data sources. Screenshot from
TidyTuesday 2022/25
June 23, 2022
slavery & TidyTuesday & Data Visualization
When I saw Erin’s post a couple of days ago, I immediately wanted to do same for Sweden and started searching for data sources. Screenshot from
TidyTuesday 2022/25
June 23, 2022
slavery & TidyTuesday & Data Visualization
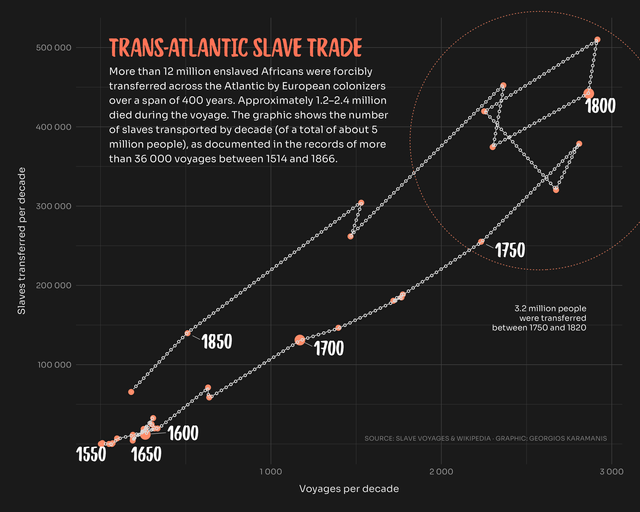 For this week’s #TidyTuesday I revisited a plot about the Trans-Atlantic slave trade I did two years ago. Code on GitHub
Next page
For this week’s #TidyTuesday I revisited a plot about the Trans-Atlantic slave trade I did two years ago. Code on GitHub
Next page