TidyTuesday 2022/24
June 16, 2022
drought & US & map & R & Data Visualization
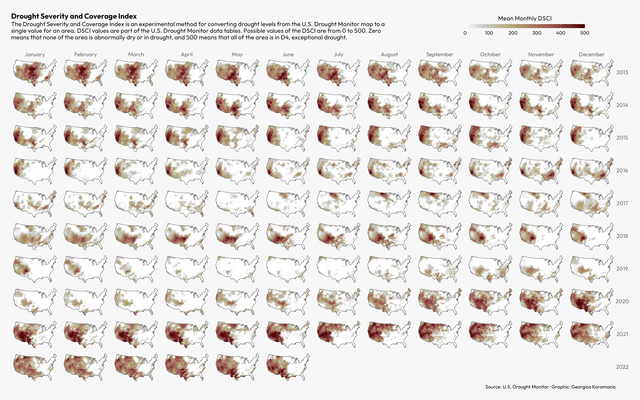 Small multiples mapping the Drought Severity and Coverage Index the last 10 years for this week’s #TidyTuesday. The subtitle text was taken from the
TidyTuesday 2022/23
June 10, 2022
Pride & R & corporate & donations & Data Visualization
Small multiples mapping the Drought Severity and Coverage Index the last 10 years for this week’s #TidyTuesday. The subtitle text was taken from the
TidyTuesday 2022/23
June 10, 2022
Pride & R & corporate & donations & Data Visualization
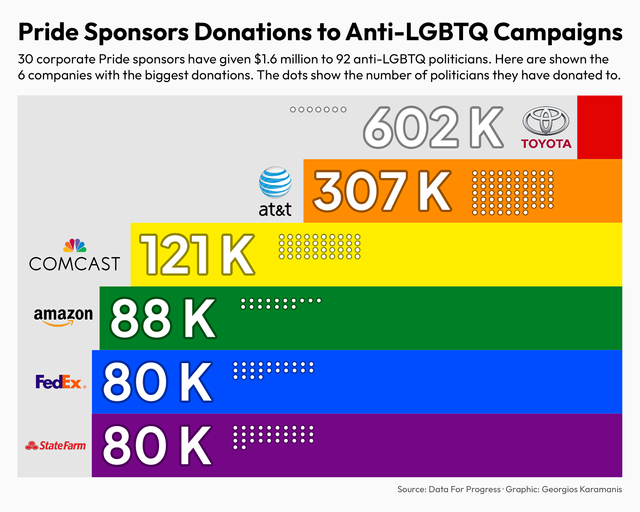 Pride Sponsors Donations to Anti-LGBTQ Campaigns for this week’s #TidyTuesday Source: Data for Progress code on GitHub
TidyTuesday 2022/22
June 3, 2022
table & reputation & Axios & reactable & Data Visualization
Pride Sponsors Donations to Anti-LGBTQ Campaigns for this week’s #TidyTuesday Source: Data for Progress code on GitHub
TidyTuesday 2022/22
June 3, 2022
table & reputation & Axios & reactable & Data Visualization
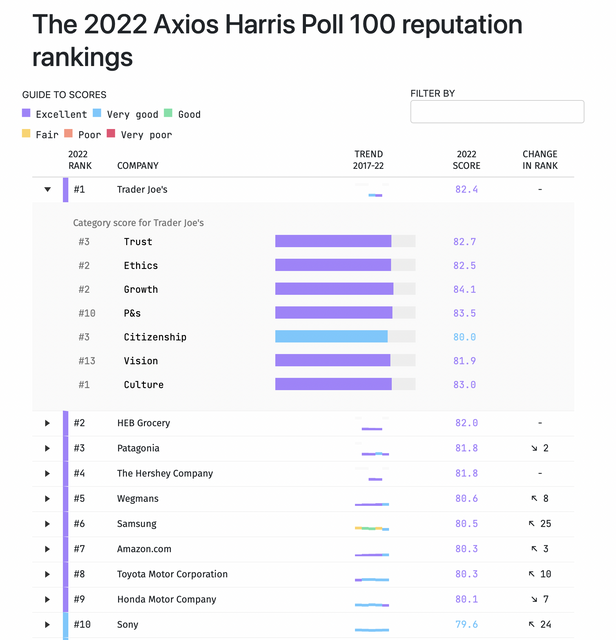 For this week’s #TidyTuesday I recreated most parts of the Axios original table with the reactable and reactablefmtr packages. code on GitHub
TidyTuesday 2022/21
May 29, 2022
rugby & TidyTuesday & map & Europe & Sweden & sports & Data Visualization
For this week’s #TidyTuesday I recreated most parts of the Axios original table with the reactable and reactablefmtr packages. code on GitHub
TidyTuesday 2022/21
May 29, 2022
rugby & TidyTuesday & map & Europe & Sweden & sports & Data Visualization
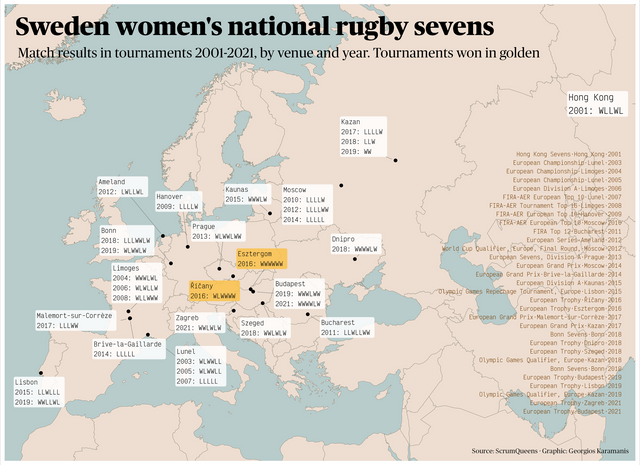 Match results of Sweden women’s national rugby sevens for this week’s #TidyTuesday code on GitHub
TidyTuesday 2022/20
May 19, 2022
Eurovision & scoreboard & R & tutorial & Data Visualization
Match results of Sweden women’s national rugby sevens for this week’s #TidyTuesday code on GitHub
TidyTuesday 2022/20
May 19, 2022
Eurovision & scoreboard & R & tutorial & Data Visualization
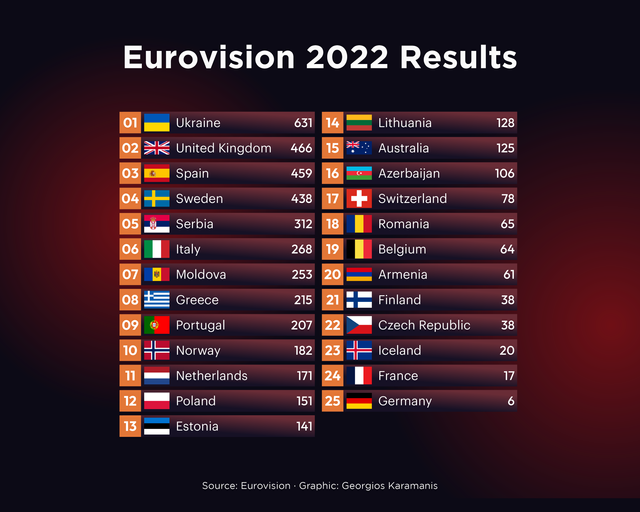 For this week’s #TidyTuesday I recreated the scoreboard from this year’s Eurovision with ggplot. code on GitHub Here is a mini tutorial: I used
TidyTuesday 2022/19
May 11, 2022
R & TidyTuesday & books & New York Times & bestsellers & Data Visualization
For this week’s #TidyTuesday I recreated the scoreboard from this year’s Eurovision with ggplot. code on GitHub Here is a mini tutorial: I used
TidyTuesday 2022/19
May 11, 2022
R & TidyTuesday & books & New York Times & bestsellers & Data Visualization
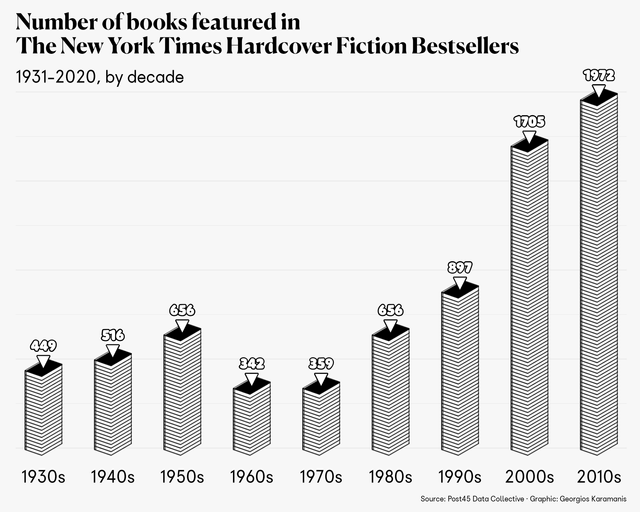 Number of books featured in The New York Times Hardcover Fiction Bestsellers for this week’s #TidyTuesday. First “published” plot using {ggsvg} Code
TidyTuesday 2022/18
May 8, 2022
R & energy & solar & wind & TidyTuesday & Data Visualization
Number of books featured in The New York Times Hardcover Fiction Bestsellers for this week’s #TidyTuesday. First “published” plot using {ggsvg} Code
TidyTuesday 2022/18
May 8, 2022
R & energy & solar & wind & TidyTuesday & Data Visualization
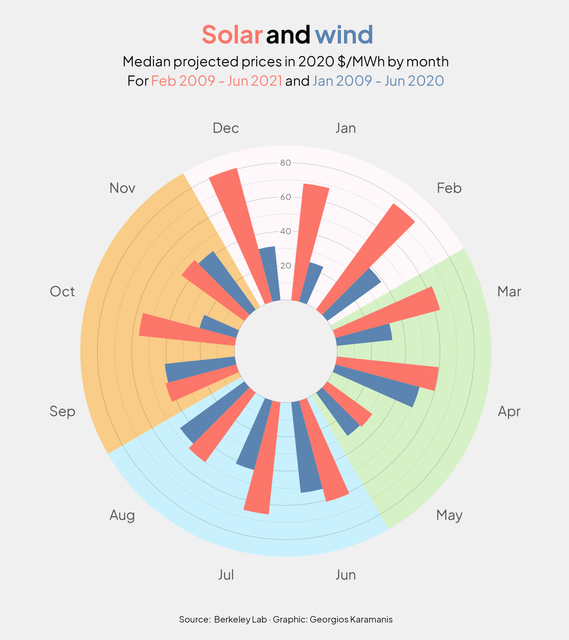 Solar and wind costs by month of year for this week’s #TidyTuesday Code on GitHub
TidyTuesday 2022/17
April 29, 2022
R & Kaggle & people & Data Visualization
Solar and wind costs by month of year for this week’s #TidyTuesday Code on GitHub
TidyTuesday 2022/17
April 29, 2022
R & Kaggle & people & Data Visualization
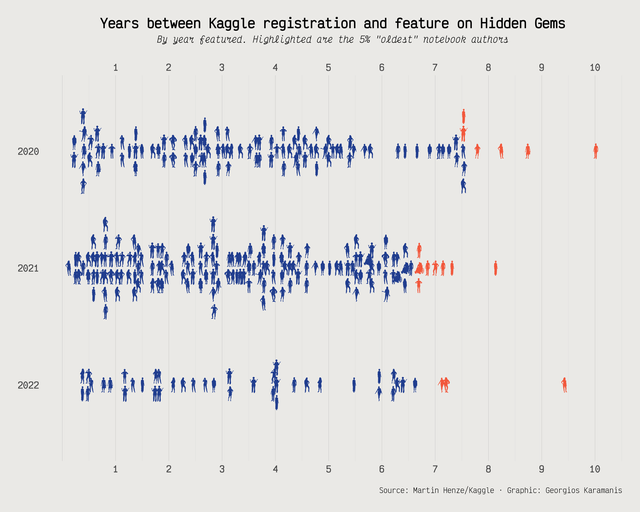 For this week’s #TidyTuesday I used the new family aesthetic of ggdist::geom_dots() to plot the Kaggle age of the notebook authors featured on
TidyTuesday 2022/16
April 22, 2022
crossword & The Times & Jumbo & cryptic & R & Data Visualization
For this week’s #TidyTuesday I used the new family aesthetic of ggdist::geom_dots() to plot the Kaggle age of the notebook authors featured on
TidyTuesday 2022/16
April 22, 2022
crossword & The Times & Jumbo & cryptic & R & Data Visualization
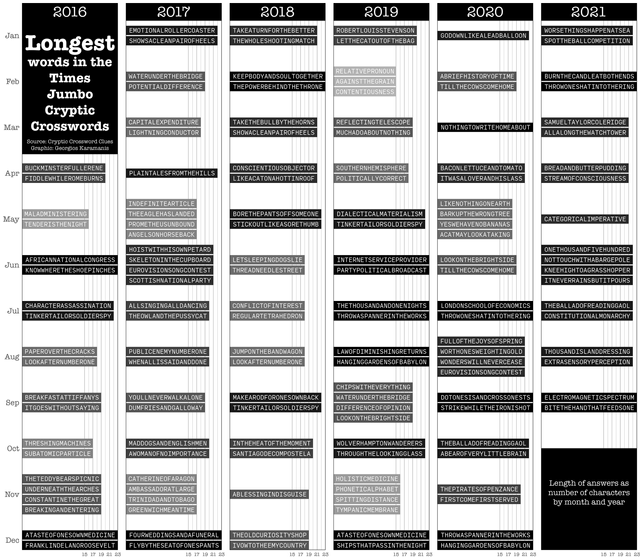 For this week’s #TidyTuesday I looked at the longest answers in The Times Jumbo Cryptic Crosswords. code and full-size image on GitHub
TidyTuesday 2022/15
April 14, 2022
indoor air pollution & R & world & Data Visualization
For this week’s #TidyTuesday I looked at the longest answers in The Times Jumbo Cryptic Crosswords. code and full-size image on GitHub
TidyTuesday 2022/15
April 14, 2022
indoor air pollution & R & world & Data Visualization
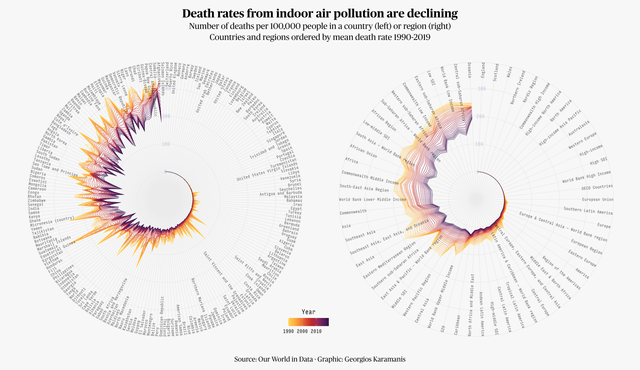 Deaths from indoor air pollution for this week’s #TidyTuesday. Not the most readable chart but I got a little too excited making it, used two hacks
Next page
Deaths from indoor air pollution for this week’s #TidyTuesday. Not the most readable chart but I got a little too excited making it, used two hacks
Next page