TidyTuesday 2022/14
April 8, 2022
news organizations & R & characters & Data Visualization
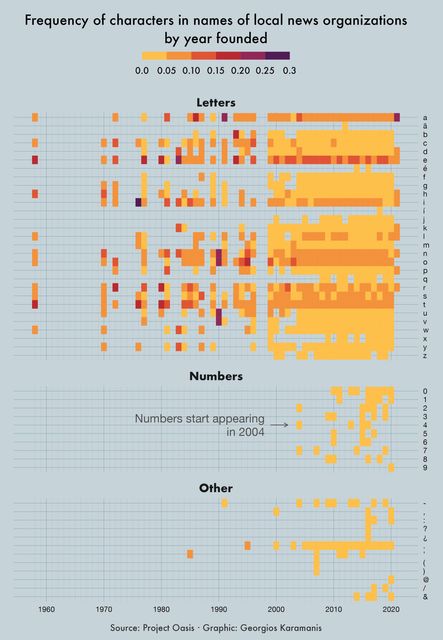 For this week’s #TidyTuesday I looked at the frequency of characters in names of U.S. local news organizations by the year they were founded.
TidyTuesday 2022/13
April 1, 2022
sports & US & map & R & Data Visualization
For this week’s #TidyTuesday I looked at the frequency of characters in names of U.S. local news organizations by the year they were founded.
TidyTuesday 2022/13
April 1, 2022
sports & US & map & R & Data Visualization
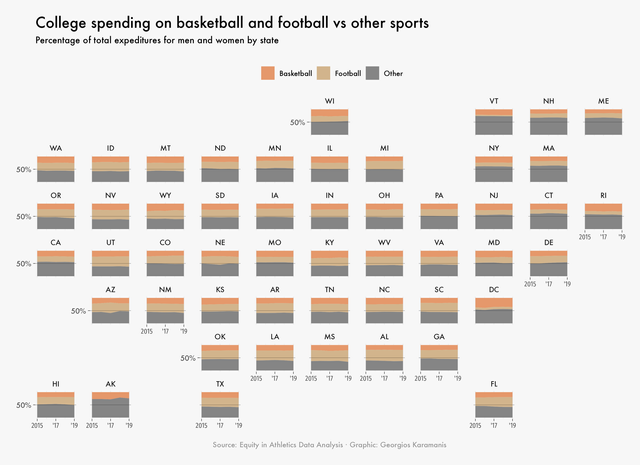 College spending on basketball and football vs other sports for this week’s #TidyTuesday Code on GitHub
TidyTuesday 2022/12
March 23, 2022
names & R & Data Visualization
College spending on basketball and football vs other sports for this week’s #TidyTuesday Code on GitHub
TidyTuesday 2022/12
March 23, 2022
names & R & Data Visualization
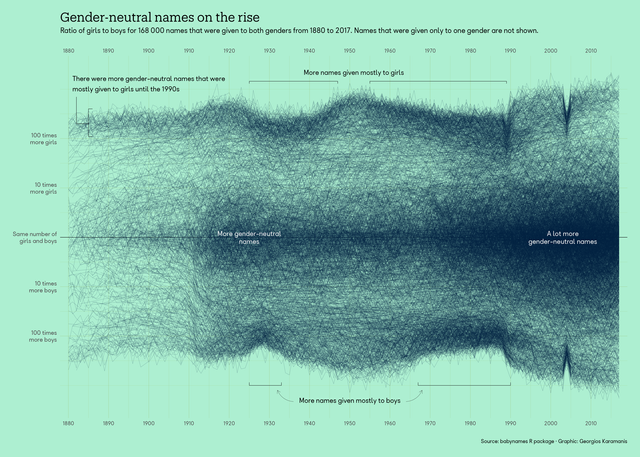 For this week’s #TidyTuesday I plotted the ratio of girls to boys for names that were given to both genders between 1880 and 2017 in the US. There
TidyTuesday 2022/11
March 19, 2022
R & packages & CRAN & Data Visualization
For this week’s #TidyTuesday I plotted the ratio of girls to boys for names that were given to both genders between 1880 and 2017 in the US. There
TidyTuesday 2022/11
March 19, 2022
R & packages & CRAN & Data Visualization
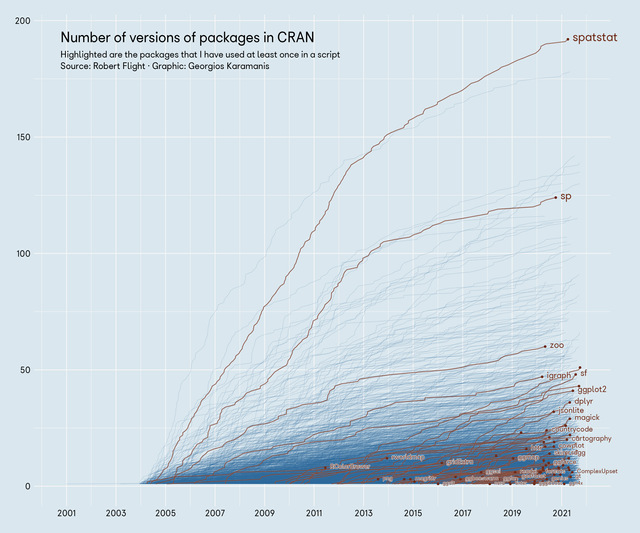 For this #TidyTuesday I plotted the number of versions of packages in CRAN and highlighted those I have used at least once. code on GitHub
TidyTuesday 2022/10
March 12, 2022
Erasmus & exchange & students & Europe & R & Data Visualization
For this #TidyTuesday I plotted the number of versions of packages in CRAN and highlighted those I have used at least once. code on GitHub
TidyTuesday 2022/10
March 12, 2022
Erasmus & exchange & students & Europe & R & Data Visualization
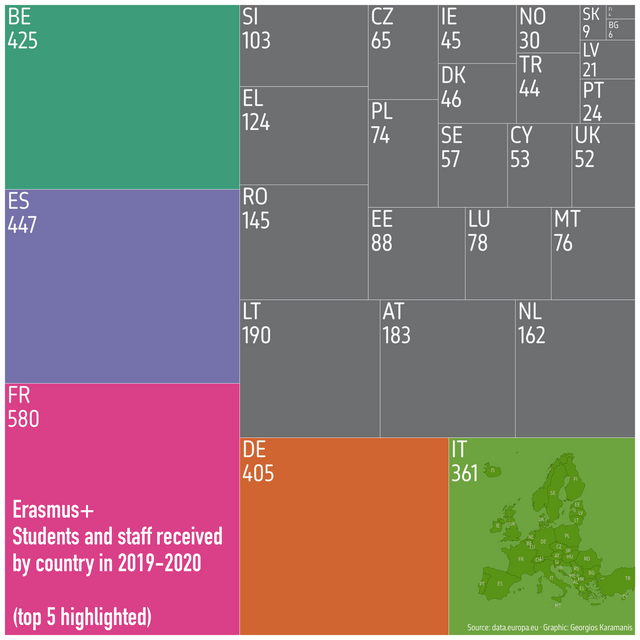 For this #TidyTuesday I made a tree map about the Erasmus+ students and staff received by each country in 2019-2020 code on GitHub
TidyTuesday 2022/09
March 2, 2022
R & EV & charging stations & US & map & TidyTuesday & Data Visualization
For this #TidyTuesday I made a tree map about the Erasmus+ students and staff received by each country in 2019-2020 code on GitHub
TidyTuesday 2022/09
March 2, 2022
R & EV & charging stations & US & map & TidyTuesday & Data Visualization
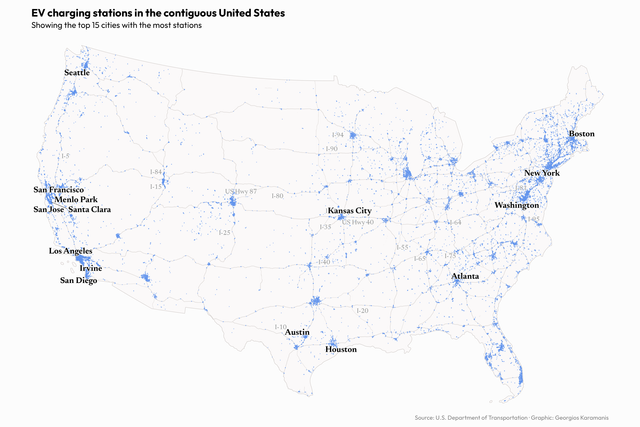 A map about EV charging stations in the US for this week’s #TidyTuesday. I wanted to make a simple and good-looking map, used another shapefile for
TidyTuesday 2022/08
February 25, 2022
R & Africa & political rights & civil liberties & map & Data Visualization
A map about EV charging stations in the US for this week’s #TidyTuesday. I wanted to make a simple and good-looking map, used another shapefile for
TidyTuesday 2022/08
February 25, 2022
R & Africa & political rights & civil liberties & map & Data Visualization
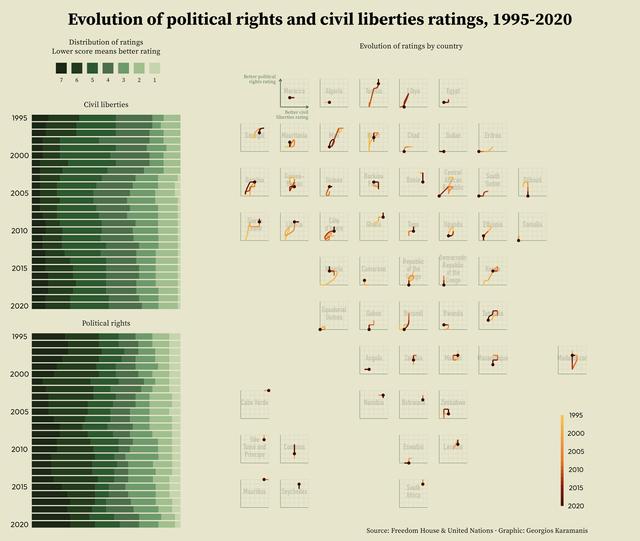 Political rights and civil liberties in Africa for this week’s #TidyTuesday code on GitHub
TidyTuesday 2022/07
February 17, 2022
R & DuBois & US & map & triangle & Data Visualization
Political rights and civil liberties in Africa for this week’s #TidyTuesday code on GitHub
TidyTuesday 2022/07
February 17, 2022
R & DuBois & US & map & triangle & Data Visualization
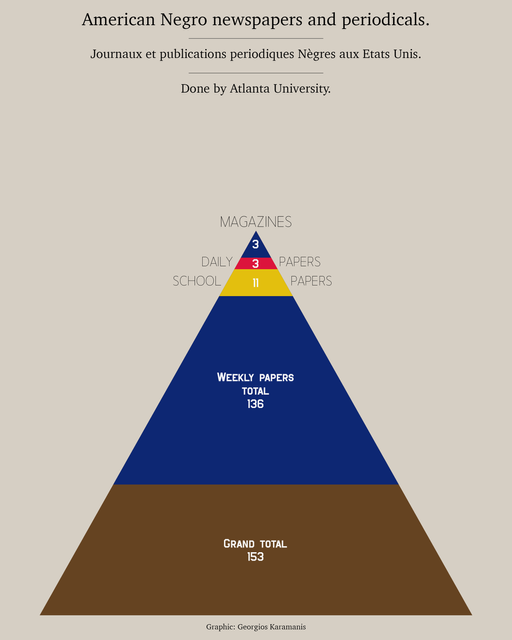 Two plots for this week’s #TidyTuesday and #DuBoisChallenge2022, recreating plates 61 and 42 Code on GitHub
TidyTuesday 2022/06
February 12, 2022
Tuskegee Airmen & R & TidyTuesday & Data Visualization
Two plots for this week’s #TidyTuesday and #DuBoisChallenge2022, recreating plates 61 and 42 Code on GitHub
TidyTuesday 2022/06
February 12, 2022
Tuskegee Airmen & R & TidyTuesday & Data Visualization
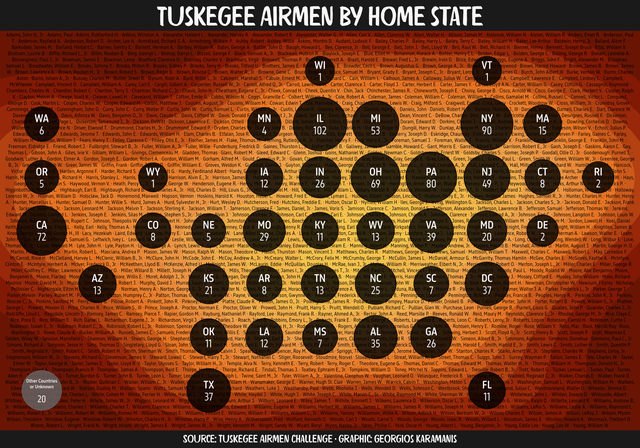 Home state of the Tuskegee Airmen for this week’s #TidyTuesday with data from the #TuskegeeAirmenChallenge Code on GitHub
Tallest buildings in Sweden
February 9, 2022
Sweden & buildings & dataviz & Data Visualization
Home state of the Tuskegee Airmen for this week’s #TidyTuesday with data from the #TuskegeeAirmenChallenge Code on GitHub
Tallest buildings in Sweden
February 9, 2022
Sweden & buildings & dataviz & Data Visualization
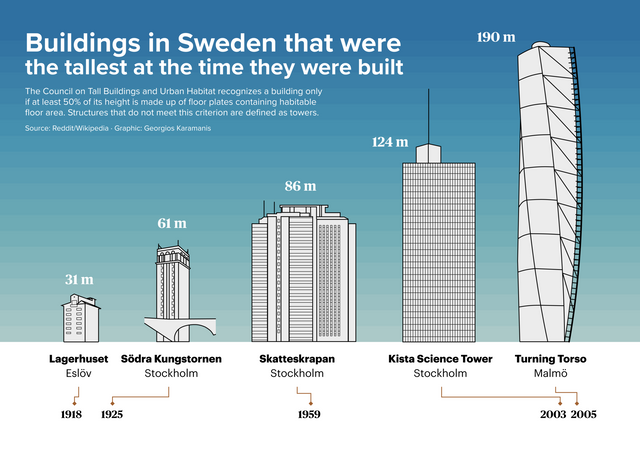 Wanted to try my hand at Figma, so I made this graphic about the tallest buildings in Sweden Idea from a post in r/Sweden
Next page
Wanted to try my hand at Figma, so I made this graphic about the tallest buildings in Sweden Idea from a post in r/Sweden
Next page