TidyTuesday 2022/05
February 1, 2022
R & dogs & dog breeds & Data Visualization
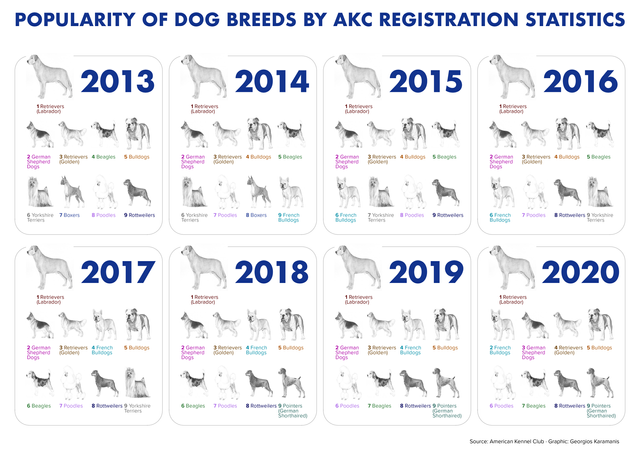 Popular dog breeds for this week’s #TidyTuesday with data from the American Kennel Club. Made with ggplot2, ggimage, ggtext and grid code on GitHub
TidyTuesday 2022/04
January 26, 2022
R & board games & Data Visualization
Popular dog breeds for this week’s #TidyTuesday with data from the American Kennel Club. Made with ggplot2, ggimage, ggtext and grid code on GitHub
TidyTuesday 2022/04
January 26, 2022
R & board games & Data Visualization
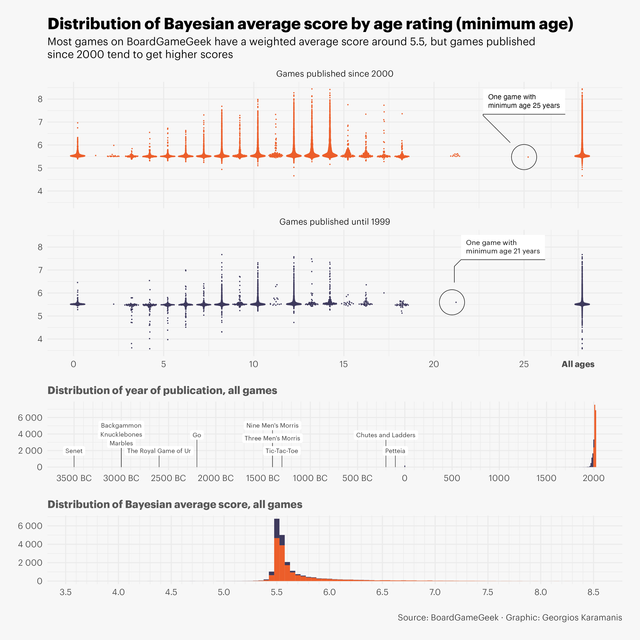 Board games for this week’s #TidyTuesday with data from @BoardGameGeek. Used a few packages to show different distributions and combine them into
TidyTuesday 2022/03
January 21, 2022
R & chocolate & cocoa & Data Visualization
Board games for this week’s #TidyTuesday with data from @BoardGameGeek. Used a few packages to show different distributions and combine them into
TidyTuesday 2022/03
January 21, 2022
R & chocolate & cocoa & Data Visualization
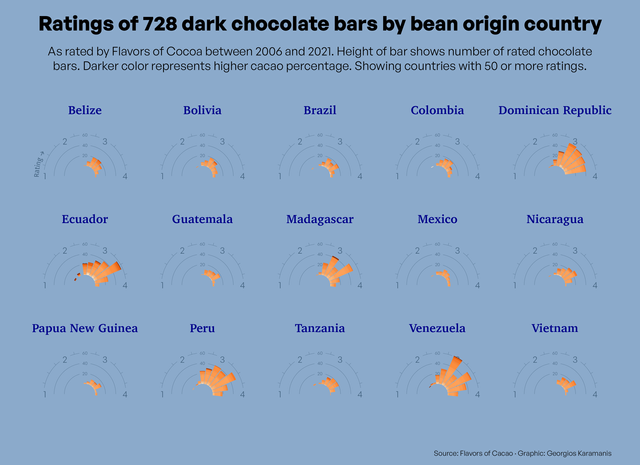 Dark chocolate bar ratings for this week’s #TidyTuesday. code: https://github.com/gkaramanis/tidytuesday/tree/master/2022/2022-week_03
TidyTuesday 2022/02
January 14, 2022
R & bees & Data Visualization
Dark chocolate bar ratings for this week’s #TidyTuesday. code: https://github.com/gkaramanis/tidytuesday/tree/master/2022/2022-week_03
TidyTuesday 2022/02
January 14, 2022
R & bees & Data Visualization
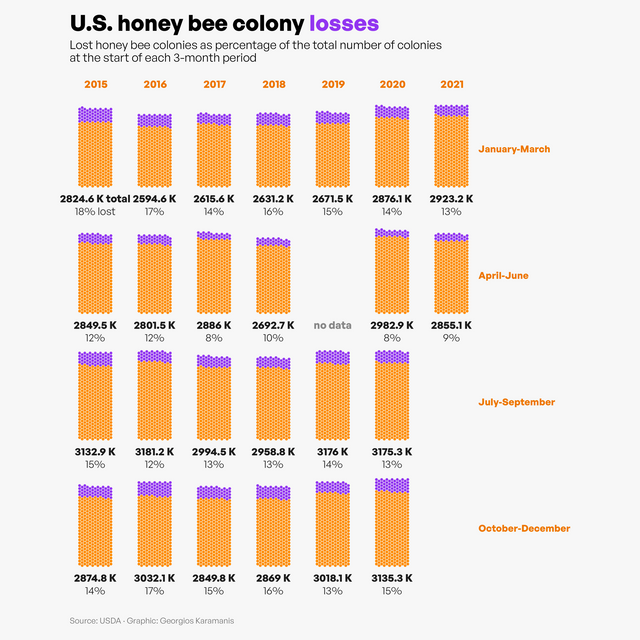 Honey bee colony losses for this week’s #TidyTuesday Code and plots for every state on GitHub
TidyTuesday 2022/01
January 5, 2022
R & hate crime & transphobic & Sweden & Data Visualization
Honey bee colony losses for this week’s #TidyTuesday Code and plots for every state on GitHub
TidyTuesday 2022/01
January 5, 2022
R & hate crime & transphobic & Sweden & Data Visualization
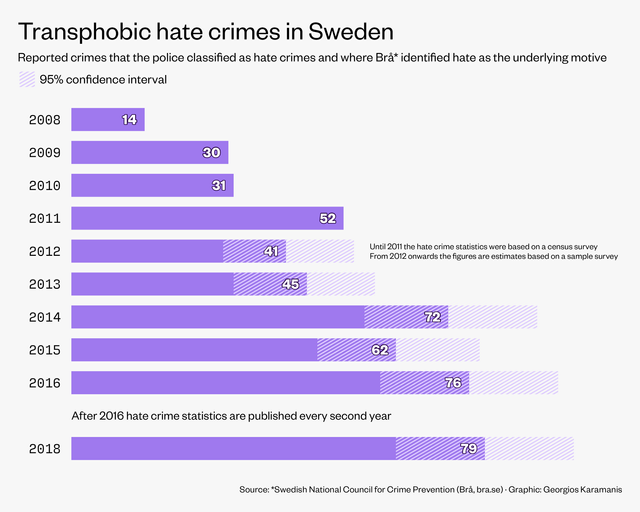 Transphobic hate crimes in Sweden for this week’s Bring Your Own Data #TidyTuesday. The inspiration was a plot made by @thomasoide for an Axios
TidyTuesday 2021/51
December 24, 2021
Starbucks & coffee & R & TidyTuesday & Data Visualization
Transphobic hate crimes in Sweden for this week’s Bring Your Own Data #TidyTuesday. The inspiration was a plot made by @thomasoide for an Axios
TidyTuesday 2021/51
December 24, 2021
Starbucks & coffee & R & TidyTuesday & Data Visualization
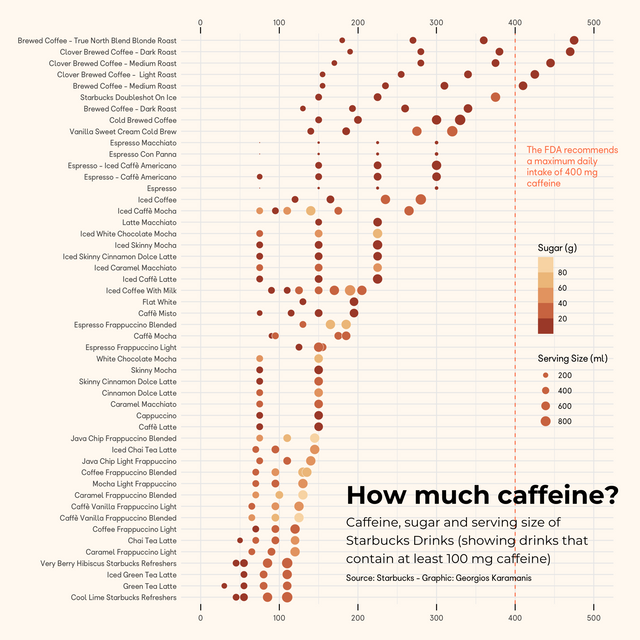 Caffeine, sugar and serving size of Starbucks drinks for this week’s #TidyTuesday. code on GitHub
TidyTuesday 2021/50
December 15, 2021
Spice Girls & Spotify & TidyTuesday & Data Visualization
Caffeine, sugar and serving size of Starbucks drinks for this week’s #TidyTuesday. code on GitHub
TidyTuesday 2021/50
December 15, 2021
Spice Girls & Spotify & TidyTuesday & Data Visualization
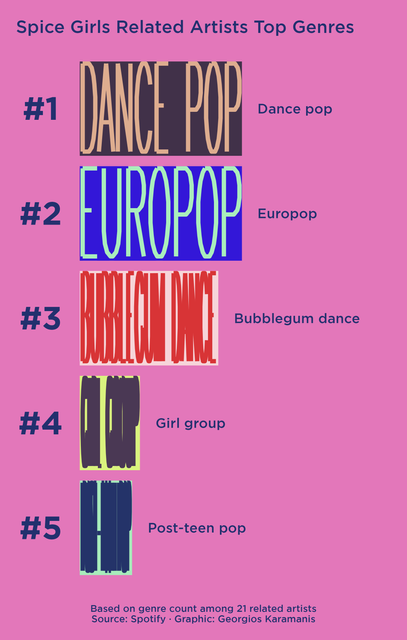 Spice Girls related artists top genres for this week’s #TidyTuesday, in the style of Spotify Wrapped 2021. The text inside the bars was made with
TidyTuesday 2021/49
December 10, 2021
R & spiders & TidyTuesday & Data Visualization
Spice Girls related artists top genres for this week’s #TidyTuesday, in the style of Spotify Wrapped 2021. The text inside the bars was made with
TidyTuesday 2021/49
December 10, 2021
R & spiders & TidyTuesday & Data Visualization
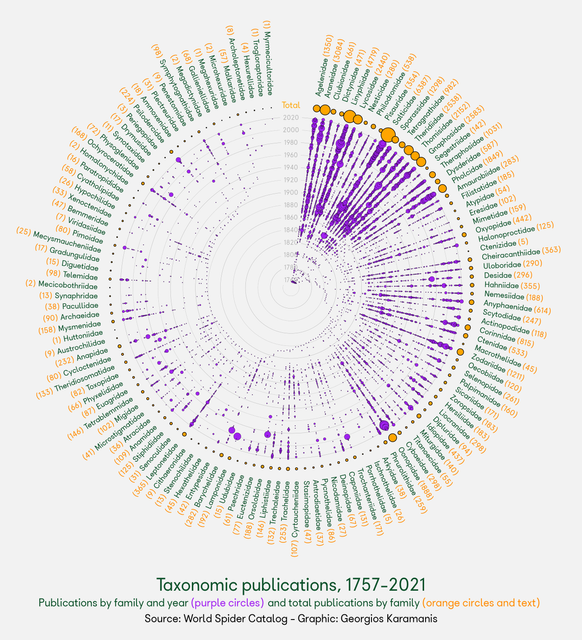 Spider taxonomy publications for this week’s #TidyTuesday with data from the World Spider Catalog. Not very easy to read but looks nice code and big
TidyTuesday 2021/48
December 1, 2021
R & cricket & Notabilia & Data Visualization
Spider taxonomy publications for this week’s #TidyTuesday with data from the World Spider Catalog. Not very easy to read but looks nice code and big
TidyTuesday 2021/48
December 1, 2021
R & cricket & Notabilia & Data Visualization
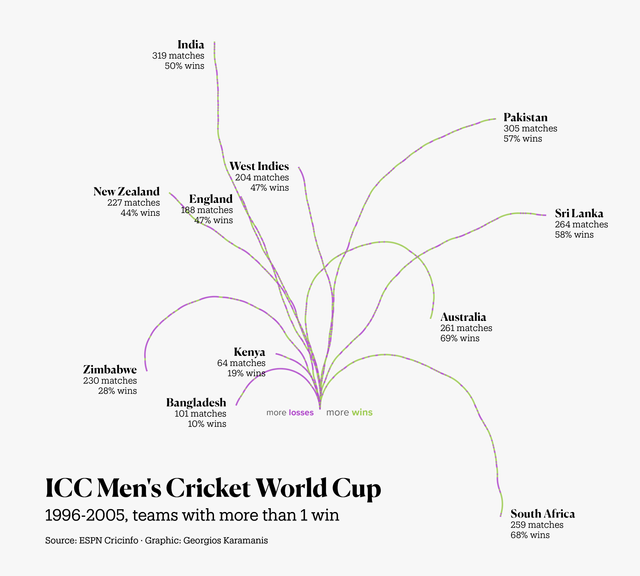 Cricket World Cup team wins for this week’s #TidyTuesday. I got a little lazy this week and reused the code I wrote some time ago to recreate Moritz
TidyTuesday 2021/47
November 28, 2021
Doctor Who & scarf & IMDB & R & Data Visualization
Cricket World Cup team wins for this week’s #TidyTuesday. I got a little lazy this week and reused the code I wrote some time ago to recreate Moritz
TidyTuesday 2021/47
November 28, 2021
Doctor Who & scarf & IMDB & R & Data Visualization
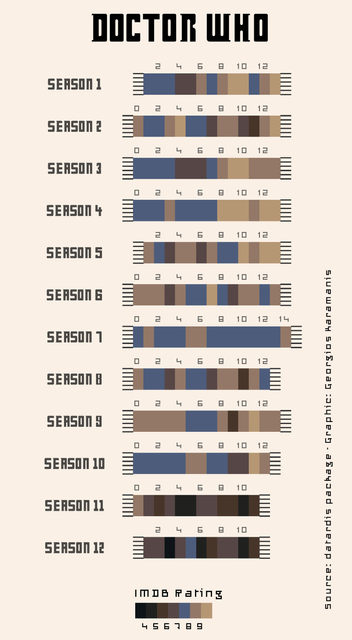 Doctor Who IMDB ratings for this week’s #TidyTuesday, in the style of the 4th Doctor’s scarf code on GitHub
Next page
Doctor Who IMDB ratings for this week’s #TidyTuesday, in the style of the 4th Doctor’s scarf code on GitHub
Next page