30DayMapChallenge 2021
November 27, 2021
R & 30DayMapChallenge & Greece & map & Map & Data Visualization
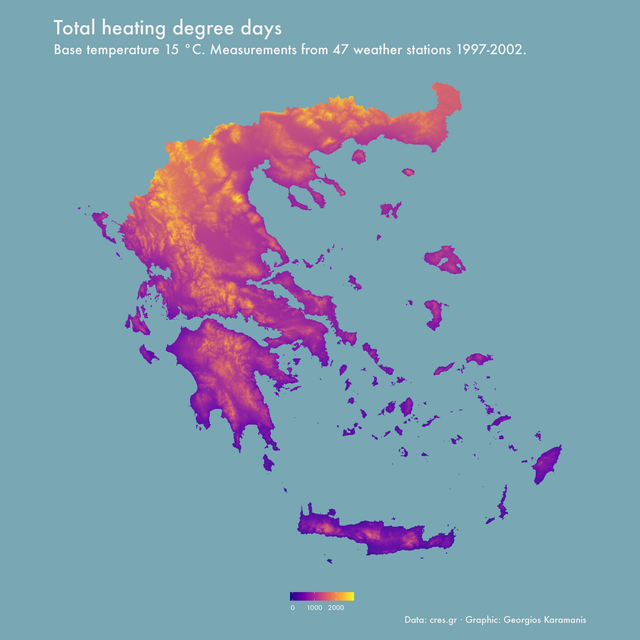 This post is going to be continuously updated with submissions to the 2021 #30DayMapChallenge. The code for all plots is on GitHub. For day 1, I
TidyTuesday 2021/45
November 10, 2021
R & Africa & map & 30DayMapChallenge & population & Data Visualization & Map
This post is going to be continuously updated with submissions to the 2021 #30DayMapChallenge. The code for all plots is on GitHub. For day 1, I
TidyTuesday 2021/45
November 10, 2021
R & Africa & map & 30DayMapChallenge & population & Data Visualization & Map
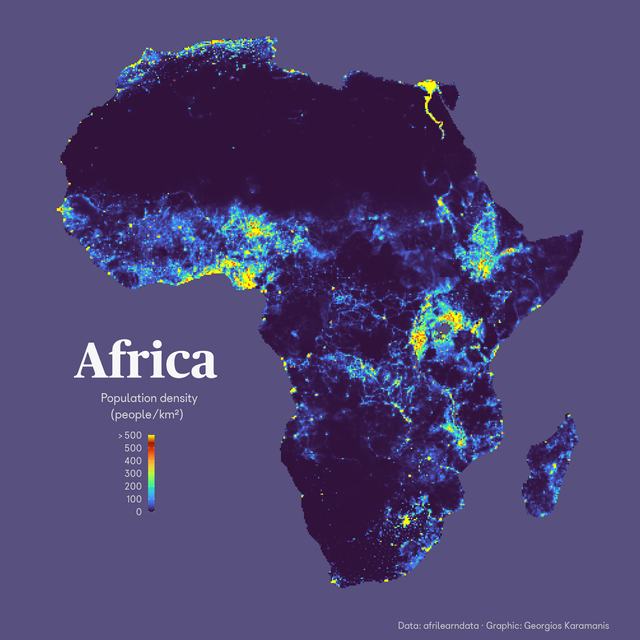 Cross post for this week’s #TidyTuesday and day 10 of #30daymapchallenge, raster. Population density in Africa with raster data from @afrimapr Code
TidyTuesday 2021/44
November 6, 2021
R & plot & Earth & Globe & life expectancy & Data Visualization
Cross post for this week’s #TidyTuesday and day 10 of #30daymapchallenge, raster. Population density in Africa with raster data from @afrimapr Code
TidyTuesday 2021/44
November 6, 2021
R & plot & Earth & Globe & life expectancy & Data Visualization
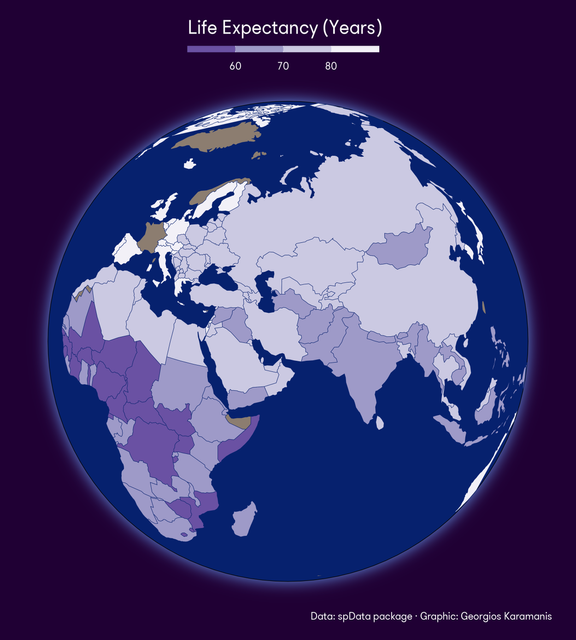 A map for this week’s #TidyTuesday, showing life expectancy on a globe with data from the spData package code on GitHub
TidyTuesday 2021/43
October 30, 2021
trail running & R & plot & TidyTuesday & Data Visualization
Trail running for this week’s #TidyTuesday. A lollipop chart showing the difference of median pace between men and women for 85 nationalities. code
TidyTuesday 2021/42
October 23, 2021
R & pumpkins & Venn & Data Visualization
A map for this week’s #TidyTuesday, showing life expectancy on a globe with data from the spData package code on GitHub
TidyTuesday 2021/43
October 30, 2021
trail running & R & plot & TidyTuesday & Data Visualization
Trail running for this week’s #TidyTuesday. A lollipop chart showing the difference of median pace between men and women for 85 nationalities. code
TidyTuesday 2021/42
October 23, 2021
R & pumpkins & Venn & Data Visualization
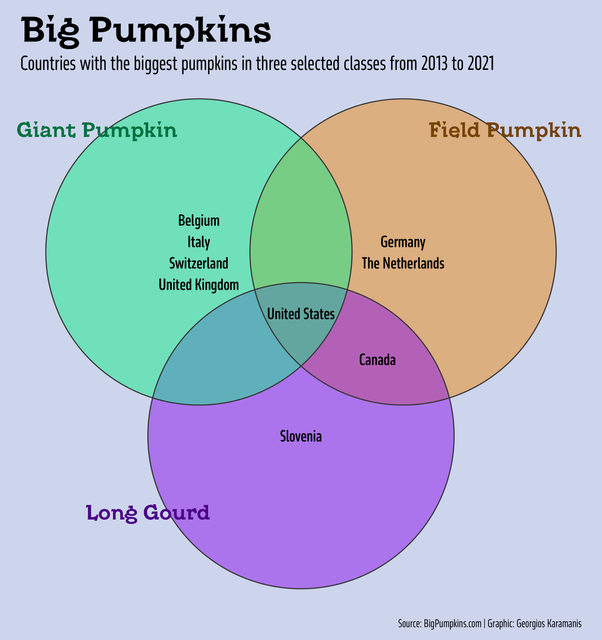 Giant pumpkins for this week’s #TidyTuesday. I decided to make a Venn diagram after seeing a tweet by Andy Kirk, tried 2-3 packages but in the end I
TidyTuesday 2021/41
October 12, 2021
R & Greece & seafood & Data Visualization
Seafood production in Greece for this week’s TidyTuesday. The inspiration for the plot was a data visualization from 1906 from this tweet. code and
TidyTuesday 2021/40
October 6, 2021
R & nurses & Data Visualization
Giant pumpkins for this week’s #TidyTuesday. I decided to make a Venn diagram after seeing a tweet by Andy Kirk, tried 2-3 packages but in the end I
TidyTuesday 2021/41
October 12, 2021
R & Greece & seafood & Data Visualization
Seafood production in Greece for this week’s TidyTuesday. The inspiration for the plot was a data visualization from 1906 from this tweet. code and
TidyTuesday 2021/40
October 6, 2021
R & nurses & Data Visualization
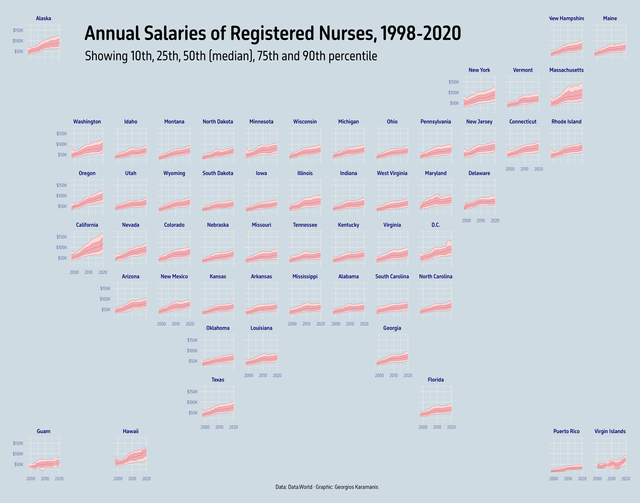 For this week’s #TidyTuesday I used {ggfan} to show the median salaries (and other percentiles) of US registered nurses from 1998 to 2020. [ ](The
TidyTuesday 2021/39
October 4, 2021
R & papers & NBER & Data Visualization
For last week’s #TidyTuesday I combined two plots (actually three with the legend) showing the number and proportion of papers distributed by NBER
TidyTuesday 2021/38
September 26, 2021
plot & Emmys & TV & Data Visualization
For this week’s #TidyTuesday I used {ggfan} to show the median salaries (and other percentiles) of US registered nurses from 1998 to 2020. [ ](The
TidyTuesday 2021/39
October 4, 2021
R & papers & NBER & Data Visualization
For last week’s #TidyTuesday I combined two plots (actually three with the legend) showing the number and proportion of papers distributed by NBER
TidyTuesday 2021/38
September 26, 2021
plot & Emmys & TV & Data Visualization
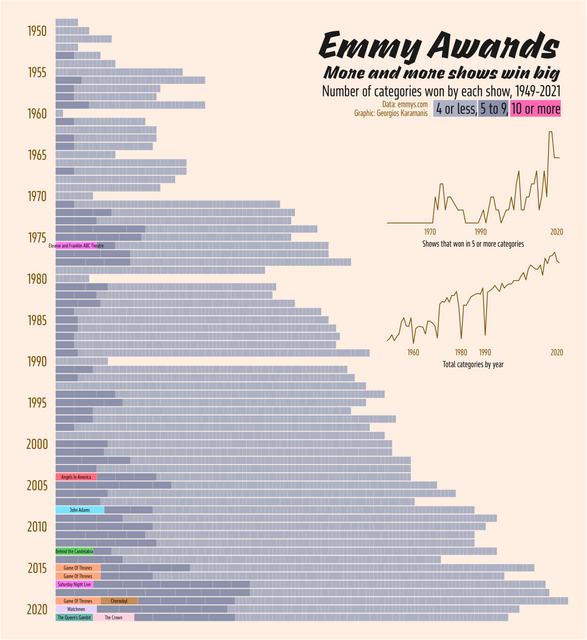 Big Emmy award winners for this week’s #TidyTuesday. The dataset seemed to have missing categories for many years so I merged it with a Kaggle
TidyTuesday 2021/37
September 17, 2021
Spotify & music & Billboard & R & code & Data Visualization
Big Emmy award winners for this week’s #TidyTuesday. The dataset seemed to have missing categories for many years so I merged it with a Kaggle
TidyTuesday 2021/37
September 17, 2021
Spotify & music & Billboard & R & code & Data Visualization
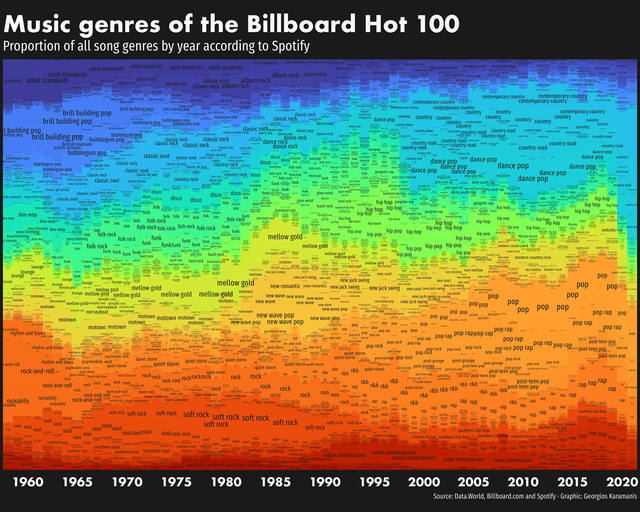 Spotify music genres of the Billboard Hot 100 for this week’s #TidyTuesday. Code and big image on GitHub
Next page
Spotify music genres of the Billboard Hot 100 for this week’s #TidyTuesday. Code and big image on GitHub
Next page