TidyTuesday 2021/36
September 10, 2021
Formula 1 & R & plot & Data Visualization
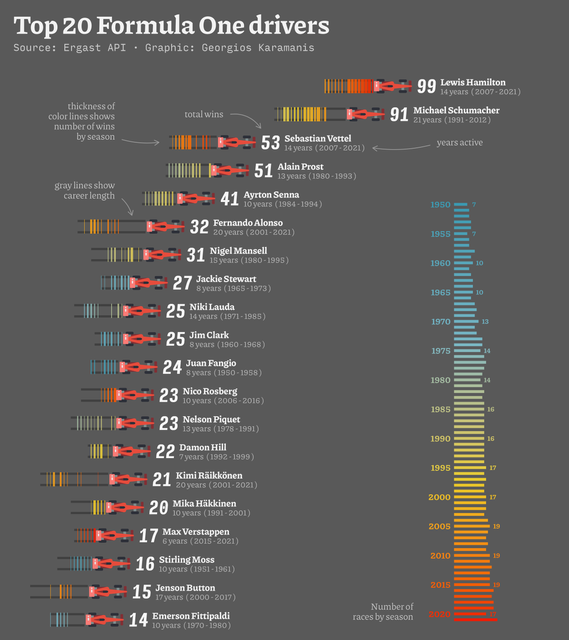 Top 20 Formula 1 drivers by total wins for this week’s #TidyTuesday code on GitHub
TidyTuesday 2021/35
September 3, 2021
birds & Australia & plot & R & Data Visualization
Top 20 Formula 1 drivers by total wins for this week’s #TidyTuesday code on GitHub
TidyTuesday 2021/35
September 3, 2021
birds & Australia & plot & R & Data Visualization
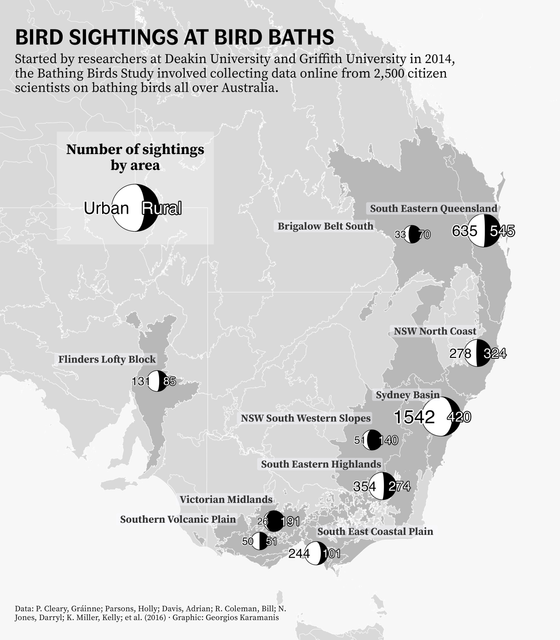 Bird sightings at Australian bird baths for this week’s #TidyTuesday. I really liked the grayscale look while I was working with the map and decided
TidyTuesday 2021/34
August 29, 2021
R & lemurs & plot & Data Visualization
Bird sightings at Australian bird baths for this week’s #TidyTuesday. I really liked the grayscale look while I was working with the map and decided
TidyTuesday 2021/34
August 29, 2021
R & lemurs & plot & Data Visualization
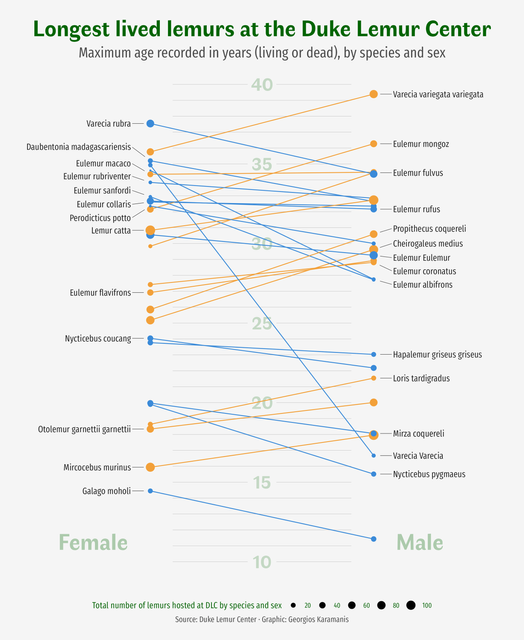 For this week’s #TidyTuesday I plotted the maximum age of all the lemurs hosted at the Duke Lemur Center by species and sex. code on GitHub
TidyTuesday 2021/33
August 22, 2021
Star Trek & R & letters & Data Visualization
For this week’s #TidyTuesday I plotted the maximum age of all the lemurs hosted at the Duke Lemur Center by species and sex. code on GitHub
TidyTuesday 2021/33
August 22, 2021
Star Trek & R & letters & Data Visualization
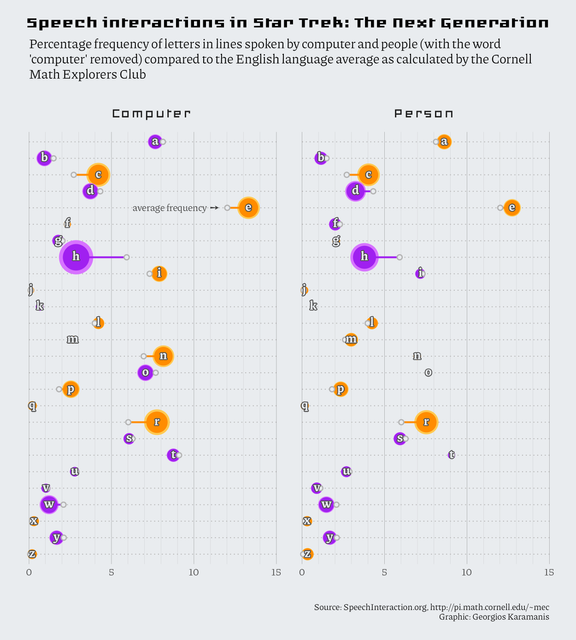 Speech interactions in Star Trek TNG for this week’s #TidyTuesday. I plotted the letter frequencies for lines spoken by computer and people compared
TidyTuesday 2021/32
August 15, 2021
R & plot & infrastructure & Data Visualization
Speech interactions in Star Trek TNG for this week’s #TidyTuesday. I plotted the letter frequencies for lines spoken by computer and people compared
TidyTuesday 2021/32
August 15, 2021
R & plot & infrastructure & Data Visualization
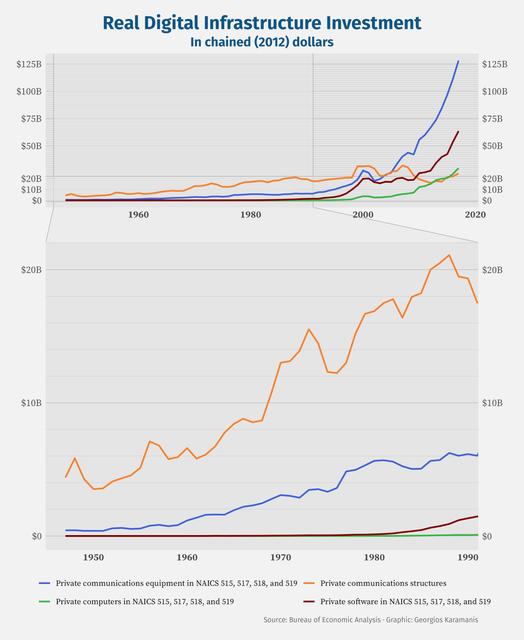 A relatively quick plot for this #TidyTuesday. I started by recreating chart 14 in the BEA Working Paper but then I thought to try facet_zoom of
TidyTuesday 2021/31
August 11, 2021
R & Paralympics & medals & Greece & Data Visualization
A relatively quick plot for this #TidyTuesday. I started by recreating chart 14 in the BEA Working Paper but then I thought to try facet_zoom of
TidyTuesday 2021/31
August 11, 2021
R & Paralympics & medals & Greece & Data Visualization
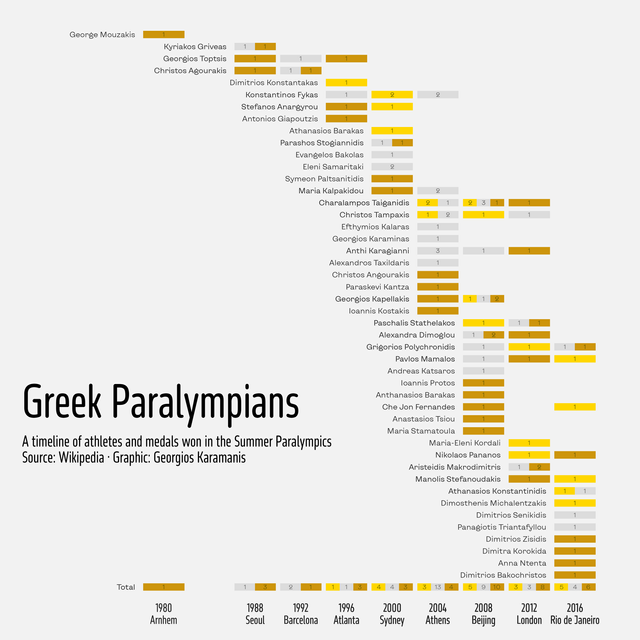 A timeline of the Greek athletes that have won a medal in the Summer Paralympics for last week’s #TidyTuesday. code on GitHub
TidyTuesday 2021/30
August 1, 2021
Olympic games & weight & BMI & R & Data Visualization
A timeline of the Greek athletes that have won a medal in the Summer Paralympics for last week’s #TidyTuesday. code on GitHub
TidyTuesday 2021/30
August 1, 2021
Olympic games & weight & BMI & R & Data Visualization
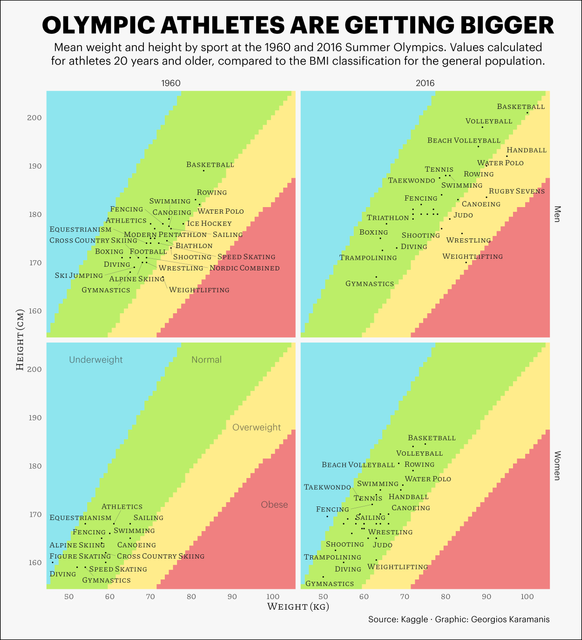 Evolution of olympic athletes’ weight and height from 1960 to 2016 for this week’s #TidyTuesday. Inspiration and reading about the limitations of
TidyTuesday 2021/29
July 26, 2021
R & drought & US & Data Visualization
Evolution of olympic athletes’ weight and height from 1960 to 2016 for this week’s #TidyTuesday. Inspiration and reading about the limitations of
TidyTuesday 2021/29
July 26, 2021
R & drought & US & Data Visualization
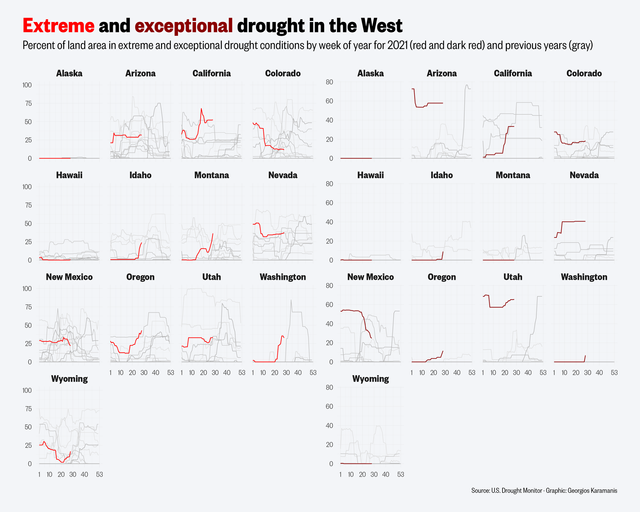 Extreme and exceptional drought in the West US for this week’s #TidyTuesday, comparing 2021 to previous years. Data from @DroughtCenter code:
TidyTuesday 2021/28
July 22, 2021
R & Scooby-Doo & Data Visualization
Extreme and exceptional drought in the West US for this week’s #TidyTuesday, comparing 2021 to previous years. Data from @DroughtCenter code:
TidyTuesday 2021/28
July 22, 2021
R & Scooby-Doo & Data Visualization
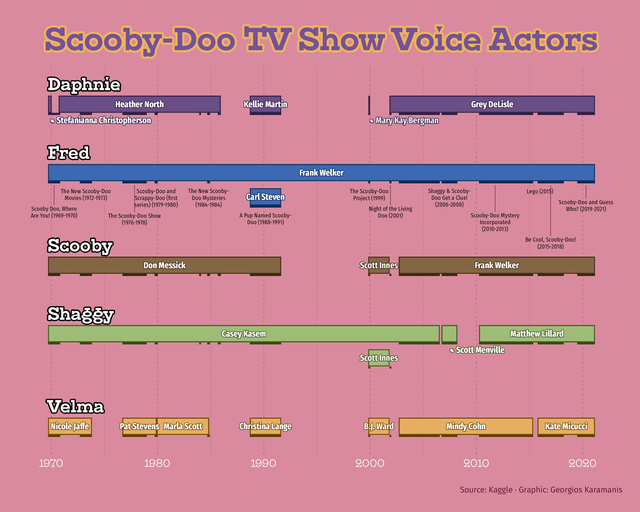 Timeline of the voice actors for the main characters of the Scooby-doo TV show (series and extras) for last week’s #TidyTuesday. code:
TidyTuesday 2021/27
July 11, 2021
TidyTuesday & R & Data Visualization
Timeline of the voice actors for the main characters of the Scooby-doo TV show (series and extras) for last week’s #TidyTuesday. code:
TidyTuesday 2021/27
July 11, 2021
TidyTuesday & R & Data Visualization
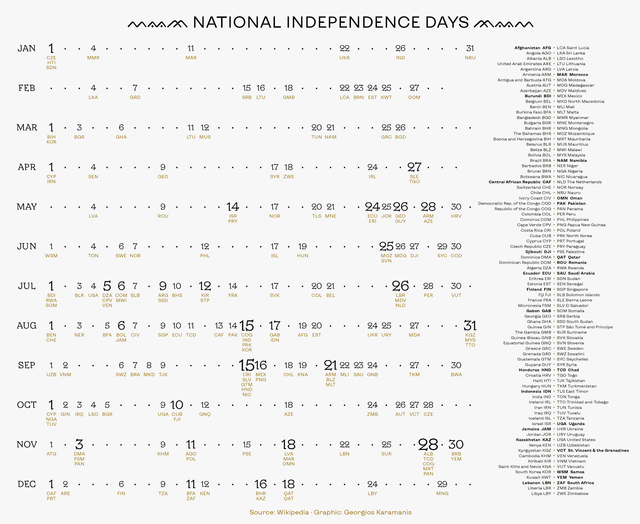 A text-heavy plot for this week’s #TidyTuesday, showing the distribution of national independence days by month and day of month R code:
Next page
A text-heavy plot for this week’s #TidyTuesday, showing the distribution of national independence days by month and day of month R code:
Next page