TidyTuesday 2021/26
July 3, 2021
R & cats & fire brigade & Data Visualization
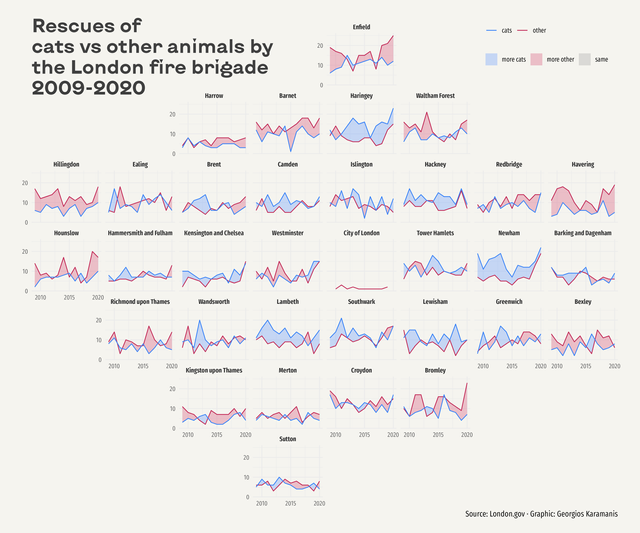 Rescues of cats vs other animals by the London fire brigade for this week’s #TidyTuesday. Used stat_difference() of the ggh4x package for the first
TidyTuesday 2021/25
June 27, 2021
R & parks & dataviz & Data Visualization
Rescues of cats vs other animals by the London fire brigade for this week’s #TidyTuesday. Used stat_difference() of the ggh4x package for the first
TidyTuesday 2021/25
June 27, 2021
R & parks & dataviz & Data Visualization
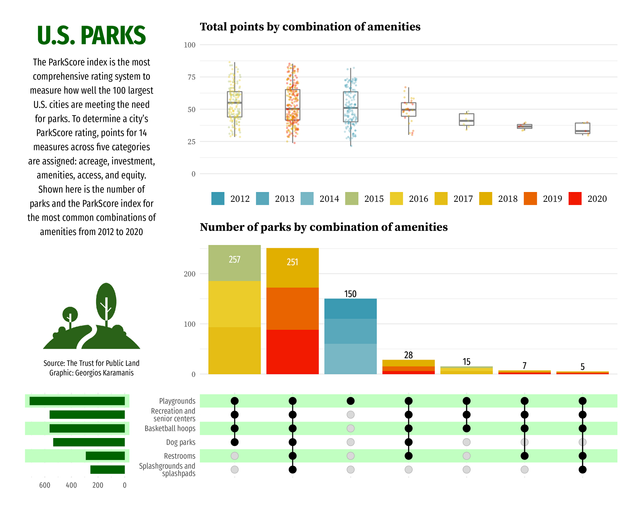 For this week’s #TidyTuesday I used the ComplexUpset package to plot the most common combinations of park amenities from 2018 to 2020, according to
All the blend modes of blend_with()
June 21, 2021
R & dataviz & Data Visualization
For this week’s #TidyTuesday I used the ComplexUpset package to plot the most common combinations of park amenities from 2018 to 2020, according to
All the blend modes of blend_with()
June 21, 2021
R & dataviz & Data Visualization
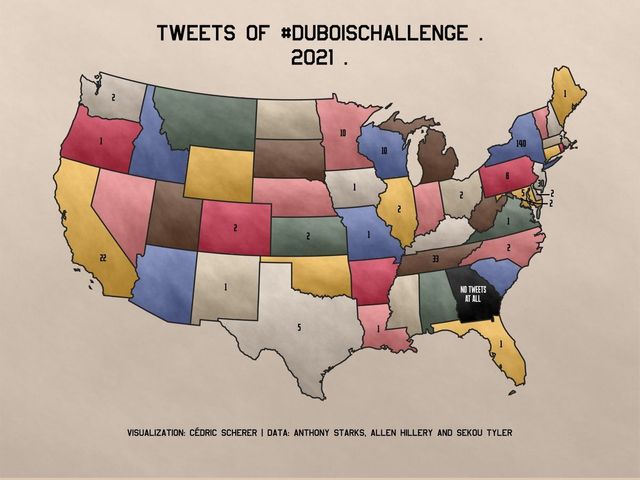 Cédric and I had a little chat when he was making his #DuBoisChallenge map (tweet) and wanted a hand-painted effect for the fill color. My
Commercial Fishing plot breakdown
June 17, 2021
dataviz & tutorial & R & Data Visualization
Cédric and I had a little chat when he was making his #DuBoisChallenge map (tweet) and wanted a hand-painted effect for the fill color. My
Commercial Fishing plot breakdown
June 17, 2021
dataviz & tutorial & R & Data Visualization
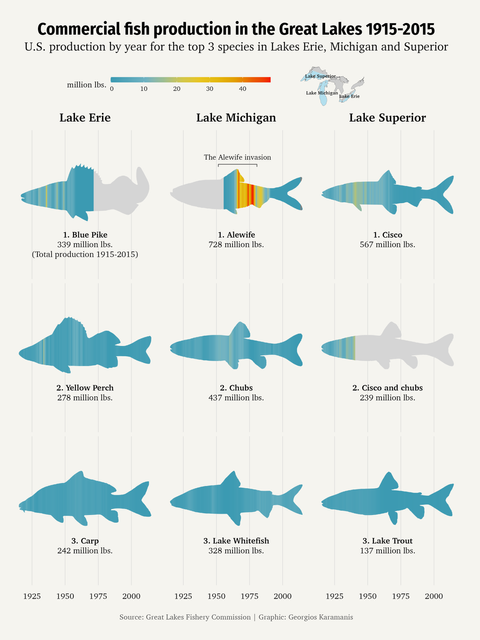 This post is not really a tutorial but more of a visual breakdown of the Commercial Fishing plot I did for last week’s TidyTuesday. The image below
TidyTuesday 2021/24
June 16, 2021
R & dataviz & DuBois & TidyTuesday & Data Visualization
This post is not really a tutorial but more of a visual breakdown of the Commercial Fishing plot I did for last week’s TidyTuesday. The image below
TidyTuesday 2021/24
June 16, 2021
R & dataviz & DuBois & TidyTuesday & Data Visualization
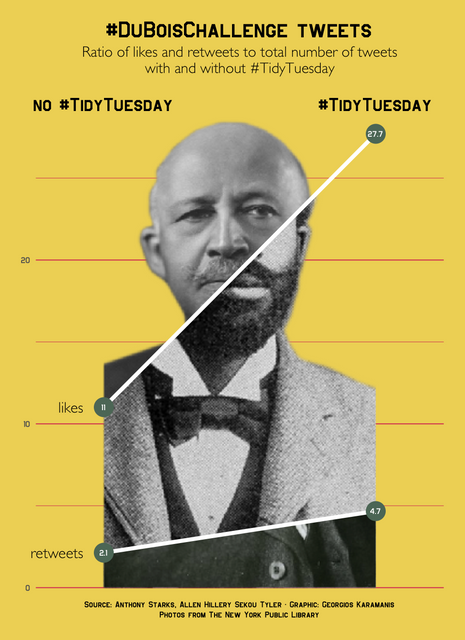 For this #TidyTuesday I was once again inspired by Gabrielle Merite’s (website, Twitter) work, as seen on the Data Viz Today Podcast. I looked at
TidyTuesday 2021/23
June 9, 2021
R & fishing & plot & Data Visualization
For this #TidyTuesday I was once again inspired by Gabrielle Merite’s (website, Twitter) work, as seen on the Data Viz Today Podcast. I looked at
TidyTuesday 2021/23
June 9, 2021
R & fishing & plot & Data Visualization
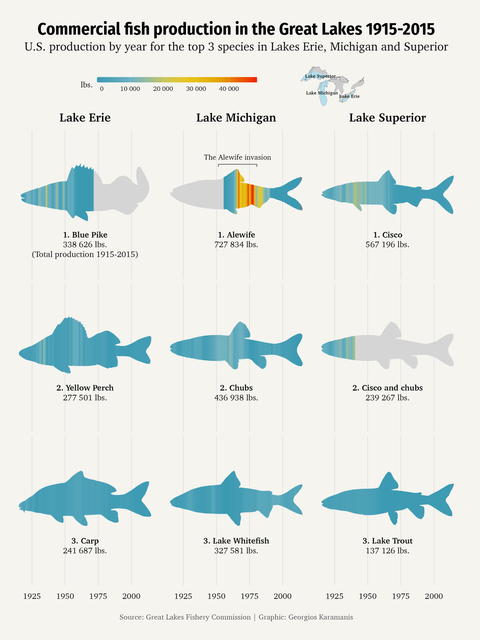 Commercial fish catch data for 3 of the Big Lakes with data by @LampreyControl for this week’s #TidyTuesday. Used, among others, {ggfx} with
#genuary 2021
February 5, 2021
art & R & genuary & Art
Commercial fish catch data for 3 of the Big Lakes with data by @LampreyControl for this week’s #TidyTuesday. Used, among others, {ggfx} with
#genuary 2021
February 5, 2021
art & R & genuary & Art
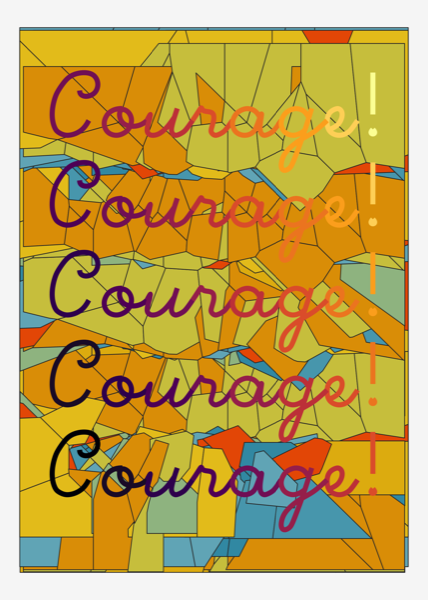 This year was the first #genuary. It was really fun, I did more plots than I expected and learned a lot! All the plots were made in R, the code for
Top 30 downloaded CRAN packages crossword puzzle
December 20, 2020
R & crossword
Crossword puzzle with the top 30 downloaded CRAN packages for the month 20 November - 20 December 2020. Crossword Puzzle Maker
ggplot crossword puzzle
December 13, 2020
crossword & R
Crossword puzzle with ggplot2 functions. For the answers, omit the geom_ part and the parentheses () Crossword Puzzle Maker
dplyr crossword
December 6, 2020
R & crossword
Crossword puzzle with dplyr functions. No parentheses needed but underscores are OK! Crossword Puzzle Maker
Next page
This year was the first #genuary. It was really fun, I did more plots than I expected and learned a lot! All the plots were made in R, the code for
Top 30 downloaded CRAN packages crossword puzzle
December 20, 2020
R & crossword
Crossword puzzle with the top 30 downloaded CRAN packages for the month 20 November - 20 December 2020. Crossword Puzzle Maker
ggplot crossword puzzle
December 13, 2020
crossword & R
Crossword puzzle with ggplot2 functions. For the answers, omit the geom_ part and the parentheses () Crossword Puzzle Maker
dplyr crossword
December 6, 2020
R & crossword
Crossword puzzle with dplyr functions. No parentheses needed but underscores are OK! Crossword Puzzle Maker
Next page