Mobile R setup
August 20, 2020
R
This is a little post about how I use R when I want to make changes in my code or test things and can’t sit in front of a big screen. I have
tidytuesday 2020⁄32
August 8, 2020
R & plot & energy & Data Visualization
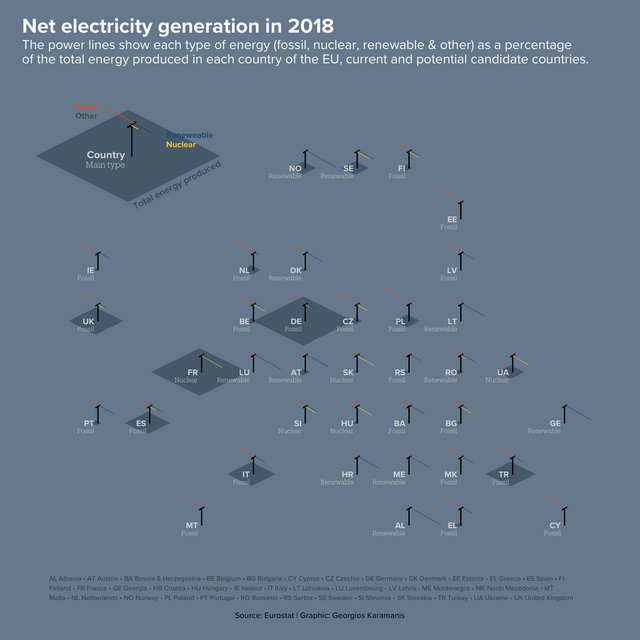 European energy for this week’s #TidyTuesday code: https://github.com/gkaramanis/tidytuesday/tree/master/2020-week32
Family
August 8, 2020
chair & light & Uppsala & home & Photography
European energy for this week’s #TidyTuesday code: https://github.com/gkaramanis/tidytuesday/tree/master/2020-week32
Family
August 8, 2020
chair & light & Uppsala & home & Photography
 tidytuesday 2020⁄31
July 29, 2020
R & penguins & plot & Data Visualization
tidytuesday 2020⁄31
July 29, 2020
R & penguins & plot & Data Visualization
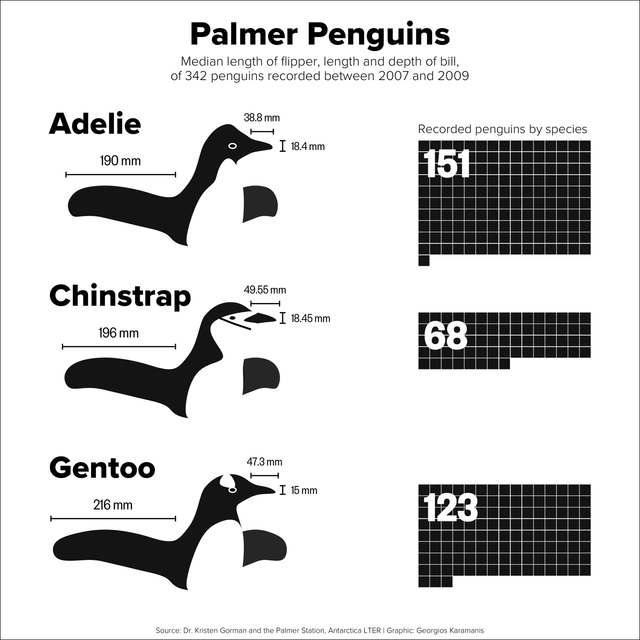 Palmer penguins for #TidyTuesday, happy to get the penguins almost right with geom_bspline_closed() from {ggforce} 😊 code:
How I make the “Making of” videos
July 7, 2020
R & making of
Palmer penguins for #TidyTuesday, happy to get the penguins almost right with geom_bspline_closed() from {ggforce} 😊 code:
How I make the “Making of” videos
July 7, 2020
R & making of
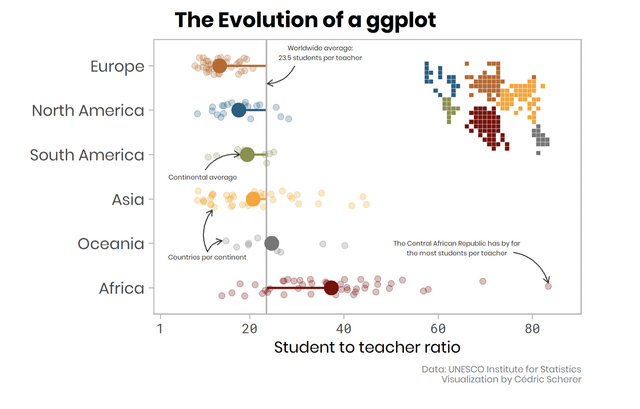 I came across the idea when I saw Cédric’s gif in his tutorial The Evolution of a ggplot (Ep. 1). I was already saving lots of plots, in order to
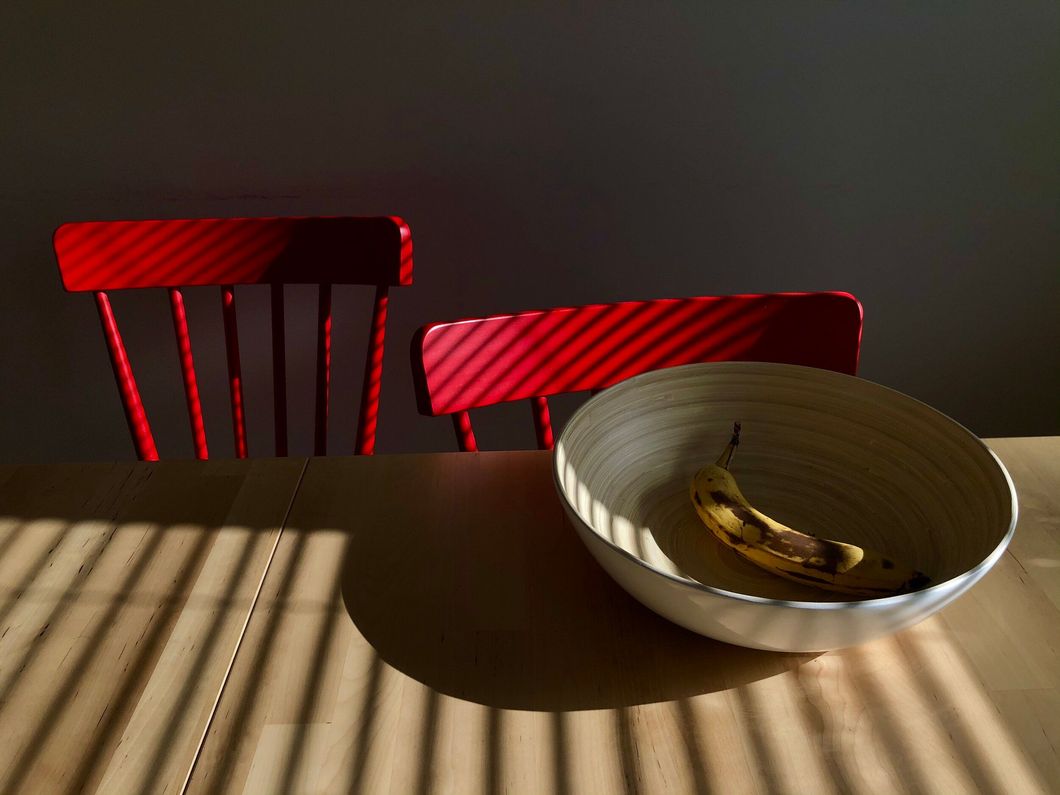
This could be a painting
June 7, 2020
light & chair & banana & table & Uppsala & home & Photography
I came across the idea when I saw Cédric’s gif in his tutorial The Evolution of a ggplot (Ep. 1). I was already saving lots of plots, in order to
This could be a painting
June 7, 2020
light & chair & banana & table & Uppsala & home & Photography
 tidytuesday 2020⁄09
February 29, 2020
TidyTuesday & R & dataviz
tidytuesday 2020⁄09
February 29, 2020
TidyTuesday & R & dataviz
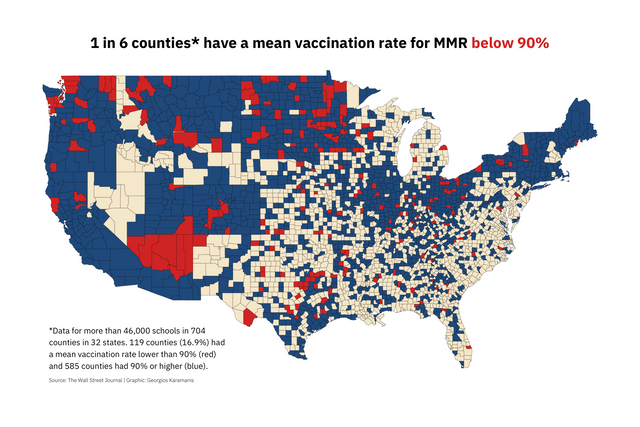 U.S. Measles Vaccination Data for #TidyTuesday, trying a map of counties with high/low vaccination rates code:
tidytuesday
February 21, 2020
food & footprint & co2 & R & Data Visualization
U.S. Measles Vaccination Data for #TidyTuesday, trying a map of counties with high/low vaccination rates code:
tidytuesday
February 21, 2020
food & footprint & co2 & R & Data Visualization
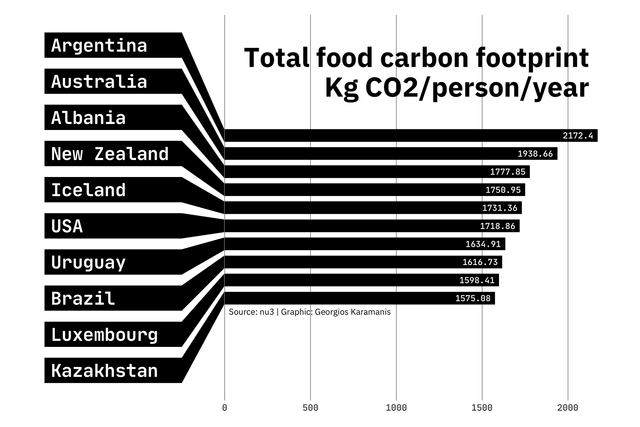 Food carbon footprint for this #TidyTuesday. I saw something and I wanted to replicate it with ggplot, I didn’t stop to think if I should. code:
tidytuesday
February 15, 2020
hotels & plot & R & Data Visualization
Food carbon footprint for this #TidyTuesday. I saw something and I wanted to replicate it with ggplot, I didn’t stop to think if I should. code:
tidytuesday
February 15, 2020
hotels & plot & R & Data Visualization
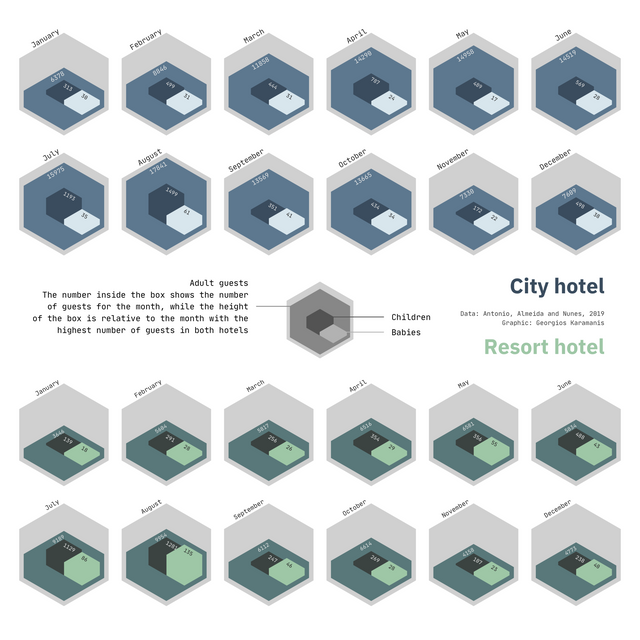 Hotels for this week’s #TidyTuesday. I had a lot of fun making the plot, many things I like and some that don’t work as well, so I’ll just leave
tidytuesday
February 2, 2020
trees & San Francisco & plot & R & Data Visualization
Hotels for this week’s #TidyTuesday. I had a lot of fun making the plot, many things I like and some that don’t work as well, so I’ll just leave
tidytuesday
February 2, 2020
trees & San Francisco & plot & R & Data Visualization
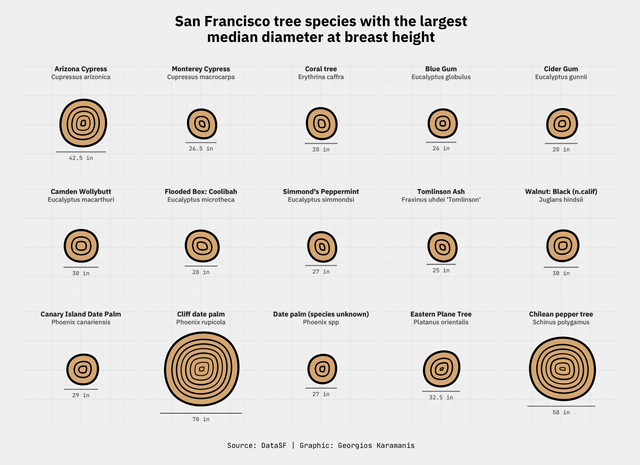 A quick plot for this week’s #TidyTuesday, looking at the streets with most trees, with the location of #rstudioconf for reference 😊 And another
Next page
A quick plot for this week’s #TidyTuesday, looking at the streets with most trees, with the location of #rstudioconf for reference 😊 And another
Next page